
Technology bubble ten years later: The money’s not back
Good news, bad news, and another word of caution for the housing bubble hopeful
I started iTulip.com in 1998 to warn readers that the technology bubble was not just an investor “party” or a neat way to force technology onto the market but was instead an efficient way to savage the heart and soul of the American economy. In 2005, five years after the bubble collapsed, I was at a Stanford investment conference moderating a VC panel hopefully titled “The Money’s Back.” It wasn’t.
Five years later it still isn’t.
Today Thomson Reuters published its PricewaterhouseCoopers/National Venture Capital Association MoneyTree™ Report and Data.
Investment by Development Stage
First the good news. In 2010, investment in pre-product or “seed stage” start-up technology companies is on track to return to 70% of 2000 levels and above 1999 levels.
- Venture Capital - Money supplied by individuals or institutions to finance the losses of innovative new companies
- Seed Stage - Pre-product, pre-revenue
- Early Stage - Product but pre-revenue or minimal revenue
- Expansion Stage - Product and some revenue growth track record
- Late Stage - Rapid revenue growth but pre-profit
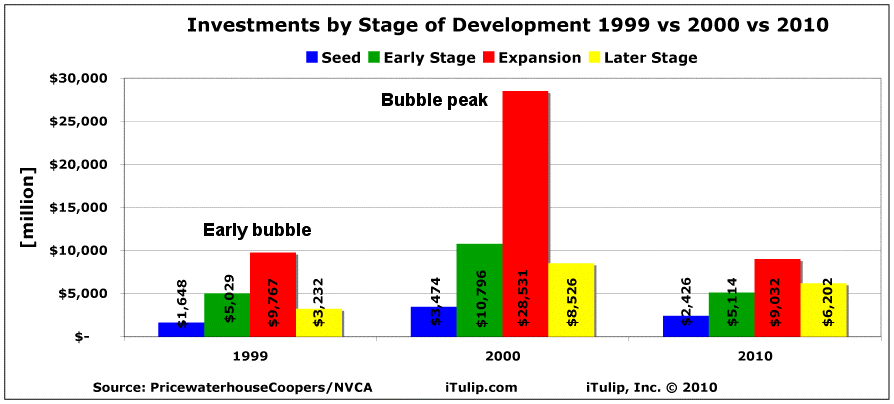
The bad news is that this growth reflects the desire by angel investors to avoid deals that require follow-on financing by venture capital firms. After two economic crashes in ten years that produced cram-down follow-on financings that reduced seed stage investors’ ownership in a company by as much as 95% in some cases, the chickens are no longer keen to dance with elephants. That means few capital-intensive start-ups are starting up. Further bad news is that Early Stage and Expansion Stage financing remains at 47% and 32% of 2000 levels respectively. Early Stage and Expansion Stage financing is finally back to levels first reached 11 years ago in 1999. Late stage start-ups are attracting twice as much capital in 2010 as in 1999, reflecting a tendency of VC investors to harvest investments made in the early 2000s rather than invest in newer and more risky ventures.
Capital-intensive start-ups are still finding it tough to locate the financing they need to get to the next stage of development, depending on the industry segment they occupy.
Investment by Industry
The good news is that if you are a Biotech, Medical Devices and Equipment, Electronics/Instrumentation, or Energy – who could have known? – start-up company, 50% of the funds invested in 2010 are going into your industries.
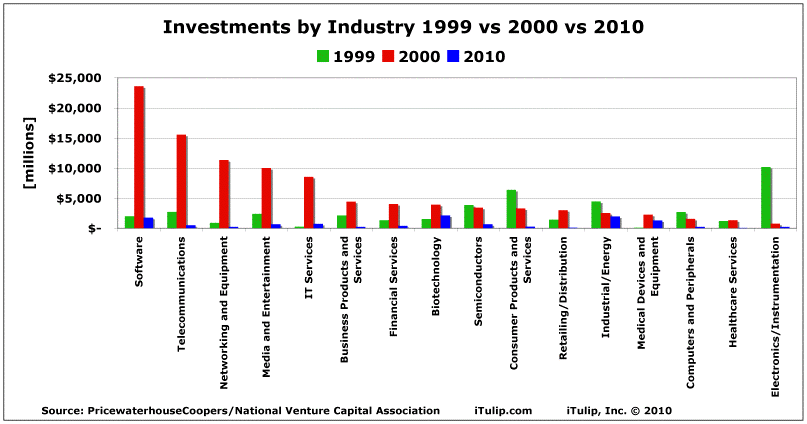
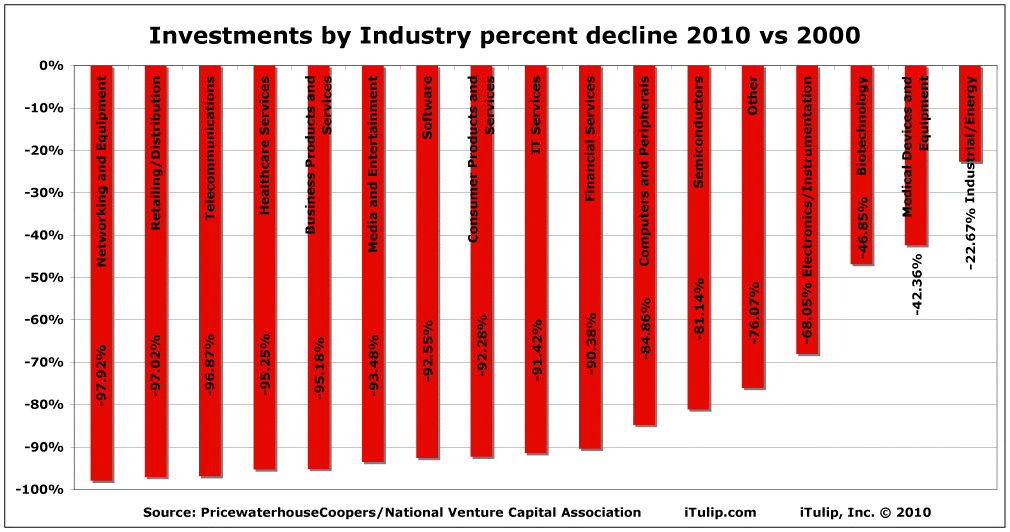
The bad news is that if you are in Networking and Equipment, Retailing/Distribution, Telecommunications, Healthcare Services, Business Products and Services, Media and Entertainment, Software, Consumer Products and Services, IT Services, or Financial Services, investment is still off more than 90% from year 2000 levels. Take particular note of the level of investment in Networking and Equipment and Retailing/Distribution companies, off 98% and 97% since 2000.
A comparison to 1999 levels is less dramatic, and produces a three areas of growth over 1999: Biotech, IT Services, and Medical Devices and Equipment.
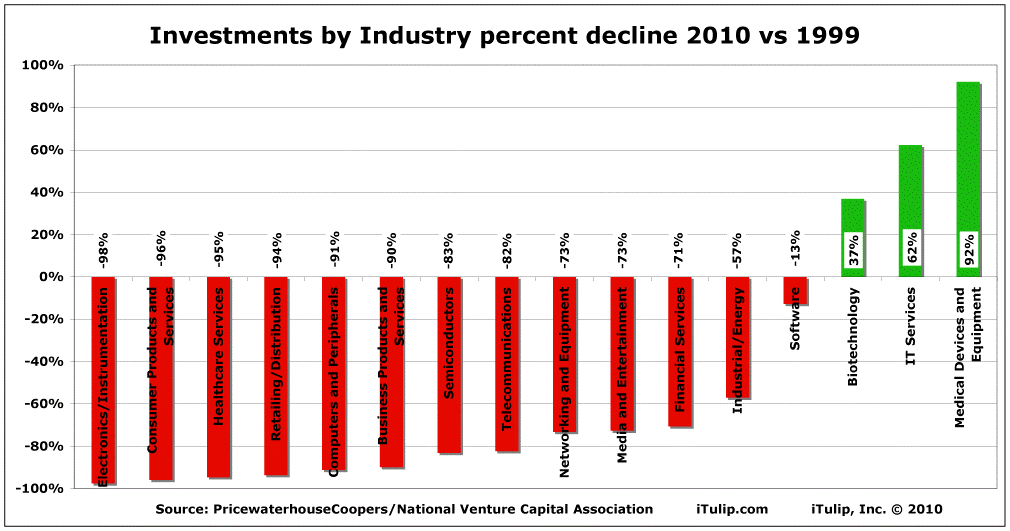
At more than 90% off 1999 levels, the first five industry segments shown above are for all practical purposes dead to private investment. Still 70% or more off 1999 levels nearly a dozen years ago, the Semiconductor, Telco, and Networking industries are victims of industry consolidation that collapsed bubbles cause. Cisco now has 70% market share. Intel has virtually no competition. Media and Entertainment is dominated by two main players as is Financial Services. No one wants to fund new companies to compete with these behemoths. Computer networking start-up business plans read like features of Cisco products not distinct new products unto themselves.
The implications are not good for the economy as a whole. While start-ups represent only 3% of the job market they provide nearly 100% of job growth. The aftermath of asset bubbles is stifled competition and reduced innovation in the medium term and higher unemployment and falling productivity in the long-term.
Investment by Region
The good news for Silicon Valley and the Northeast, former hotbeds of venture financing from the year 2000 era, is that these regions are on track to put up $9 billion and $2.8 billion respectively in 2010, a far cry from the $32.3 billion and $11.4 billion invested a decade ago but far better than the $2 billion and $711 million invested in the dark days of 2003 when the Iraq War began.
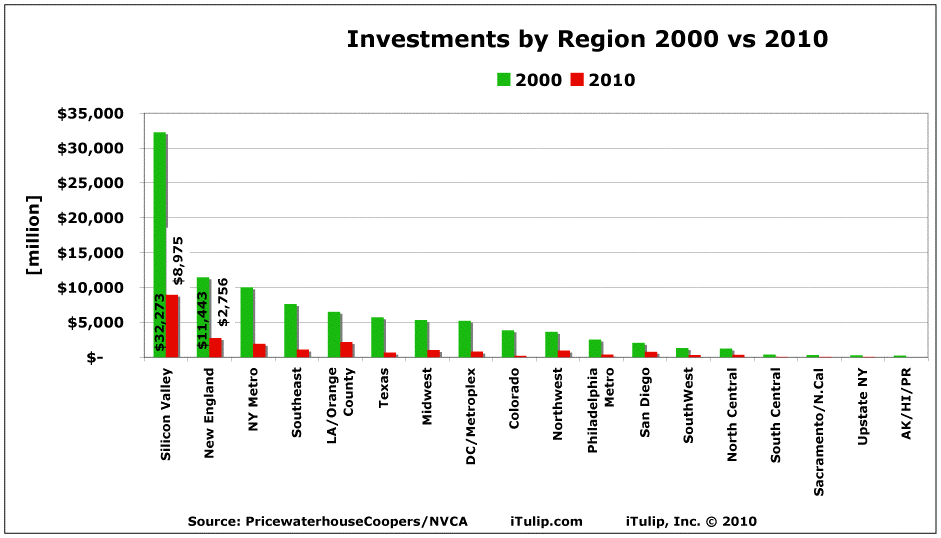
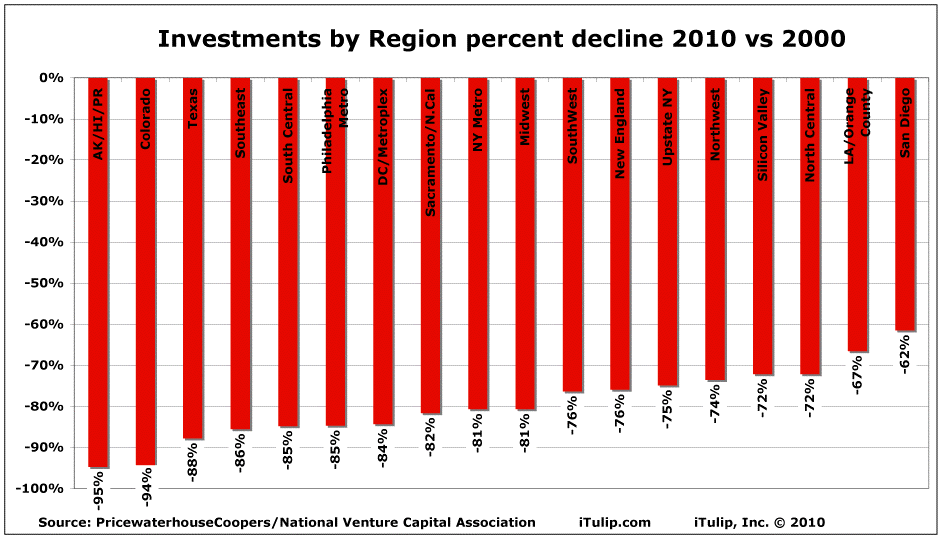
The bad news is that if you live in Colorado, Texas, the Southeast, South Central, or Midwest U.S., or in the Philadelphia Metro, DC/Metroplex, Sacramento/N.Cal, NY Metro regions, and venture financing appears to have dried up in 2001 and stayed that way, that’s because it has.
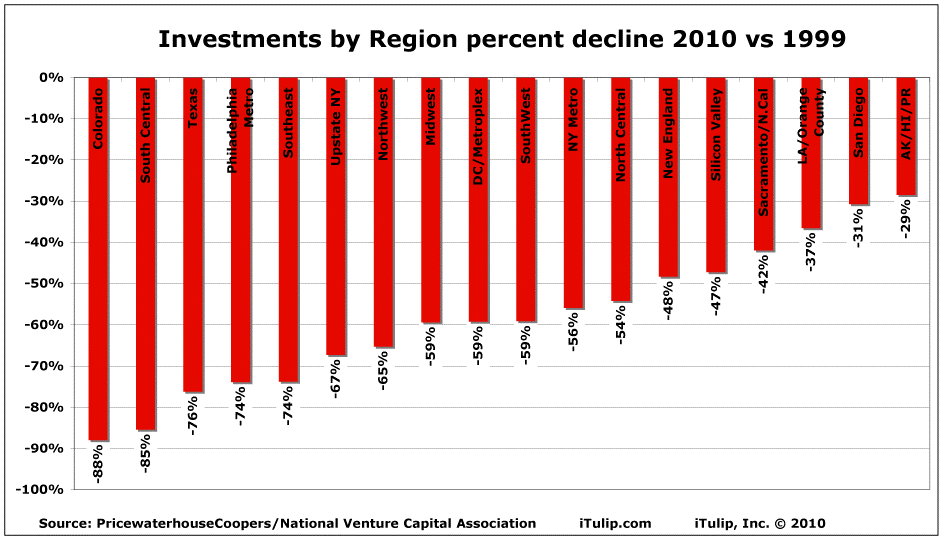
While a comparison between 2010 and 1999 is less dire, all regions remain in the red by 31% to 89% over 1999 investment levels.
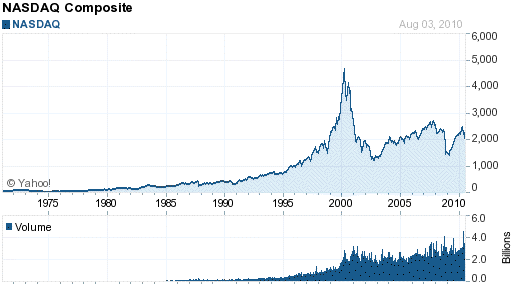
Ten years later, the market liquidity that drives the economics of venture investing remains elusive, and the NASDAQ trades at less than 50% of its peak.
Asset bubbles do lasting market damage
Ten years after the collapse of the tech bubble, the market for venture capital technology investment remains troubled. The implications for the housing market are obvious.
During the tech bubble too many VC firms chased too few good companies with cheap capital and brought them to the public market where stock prices were driven to absurd levels with hype. During the housing bubble too many mortgage brokers sold cheap mortgages to risky borrowers.
The key difference between these two bubbles is that after the tech bubble collapsed in 2000, the equity financed VC industry never got a government bailout. Scores of VC firms and start-up companies went out of business. But after the housing bubble collapsed, the Fed removed $1.2 trillion in unmarketable asset-backed securities from the balances sheets of commercial banks via the miracle of double-entry bookkeeping: they were added to the Fed's balance sheet as "deposits" and "liabilities" that net to zero. The debt financed mortgage industry was nationalized as Fannie Mae and Freddie Mac were made wards of the state. Today 90% of all mortgages are purchased by the government through these two banks. The only way to re-privatize them is to allow mortgage rates to rise to compensate investors for the real level of risk in the housing market. That means 10% plus mortgage rates. Today the National Association of Realtors announced that "its seasonally adjusted index of sales agreements for previously occupied homes dipped 2.6 percent to a reading of 75.7. That was the lowest on records dating back to 2001 and down nearly 19 percent from the same month a year earlier. The index has fallen more than 40 percent from its peak in April 2005. May's reading was revised slightly downward to 77.7." That's will the lowest mortgage rates in history, thanks to government subsidies.
Without ongoing multi-trillion dollar subsidies, by 2016, ten years from 2006 when the housing bubble started to collapse, the U.S. mortgage market will look like the technology financing market does today. Financing activity in some regions and markets will be off 90% or more and home prices will fall an additional 20% to 50% depending on the region. That's how markets operate. The long-term cost of the housing bubble has not yet started to be felt.
See also:
Yes. It's a housing bubble. August 2002
Housing bubbles are not like stock market bubbles, January 2004
Housing Bubble Correction, Fifteen Years to Revert to the Mean, January 2005
Housing bubble has peaked, June 2006
Housing bubble bust recession by Q4 2007, October 2006
iTulip Select: The Investment Thesis for the Next Cycle™
__________________________________________________
To receive the iTulip Newsletter/Alerts, Join our FREE Email Mailing List
To join iTulip forum community FREE, click here for how to register.
Copyright © iTulip, Inc. 1998 - 2010 All Rights Reserved
All information provided "as is" for informational purposes only, not intended for trading purposes or advice. Nothing appearing on this website should be considered a recommendation to buy or to sell any security or related financial instrument. iTulip, Inc. is not liable for any informational errors, incompleteness, or delays, or for any actions taken in reliance on information contained herein. Full Disclaimer
Comment