Announcement

Collapse
No announcement yet.

Shadowstats CPI and the Housing Bubble

Collapse
X
 
  • Filter
  • Time
  • Show
Clear All
new posts

  • Shadowstats CPI and the Housing Bubble

    Dear iTulip,

    As always, thanks for sharing your knowledge and insider access with our online community.

    I have been a bit puzzled by EJ's diagnosis of the housing market being composed of 50% fictitious value. It is stated that housing has historically risen at the rate of inflation. Since the CPI is no longer an accurate measure of inflation, shouldn't the Shadowstats CPI be the benchmark? Seems to me the 3.3% historical average is no longer realistic based on today's government abuse of our fiat currency.

    Looking at even the most conservative Shadowstats numbers (pre-1990 method), it appears that inflation from 1990-2005 averaged about 5.5% (I don't have access to the exact numbers so I'm eyeballing it). That means a compounded 15-year increase in prices of about 123%. Even if it was only 5% annual inflation, that's 108% total.

    Median home prices from the US Census indicate a rise from $96,400 in 1990 to $219,600 in 2005, or a 128% increase. By my calculations, that puts the fictitious value between 2% and 18%. And that's not even taking into account the 19% rise in average square footage (1905sf to 2273sf).

    Whether or not Americans can actually afford the houses is the main issue in my mind. Median incomes over the period only rose 55% while M3 per capita skyrocketed 137%. So the money's out there, it's just not in the average Joe's pocket.

    Could it be that the housing bubble is really more a problem of oversupply caused by cheap money fueling the construction of larger homes than incomes can sustain? Might this play out through slowing construction and wage pressure-driven inflation? And back to my original question... since the CPI is no longer an accurate measure of inflation, shouldn't the Shadowstats CPI be the benchmark for housing prices?

    Thanks!

    Jimmy

    See response here.
    Last edited by FRED; September 27, 2007, 02:46 PM.

  • #2
    Re: Shadowstats CPI and the Housing Bubble

    You are forgetting that the shadowstats CPI includes housing costs as a major component. Therefore the two series are highly correlated. Hence your results are not at all surprising. What you should be looking at is at the proportion of income going to pay for housing -- and that I believe has been rising.

    Comment


    • #3
      Re: Shadowstats CPI and the Housing Bubble

      Originally posted by Rajiv View Post
      You are forgetting that the shadowstats CPI includes housing costs as a major component. Therefore the two series are highly correlated. Hence your results are not at all surprising. What you should be looking at is at the proportion of income going to pay for housing -- and that I believe has been rising.
      Originally posted by jimmygu3 View Post
      Whether or not Americans can actually afford the houses is the main issue in my mind.
      See, you were on the right track there.

      Originally posted by jimmygu3 View Post
      ...Median home prices from the US Census indicate a rise from $96,400 in 1990 to $219,600 in 2005, or a 128% increase....

      ...Median incomes over the period only rose 55%...
      So, 128 - 55 = 73% overvalued compared to median income.:eek: So saying 50% overvalued might even be conservative.

      Comment


      • #4
        Re: Shadowstats CPI and the Housing Bubble

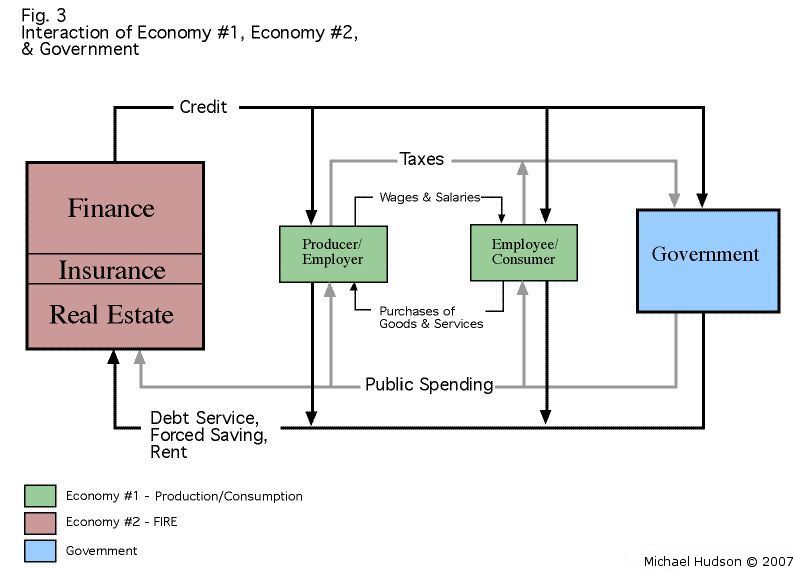
        To really understand how this works is to go back to Hudson's flow chart of the Fire Economy


        The only thing missing is the beneficiaries of the Purple Box -- the so called "Rentiers"

        With decreased taxation and increasing loopholes for this "Purple Class" there has been a shift of assets from the two green boxes tho the beneficiaries of the purple box -- this has led to increased debt loads and reduced discretionary income to the "Green Class"

        Comment


        • #5
          Re: Shadowstats CPI and the Housing Bubble

          This may help:

          http://www.NowAndTheFuture.com

          Comment


          • #6
            Re: Shadowstats CPI and the Housing Bubble

            Thanks to all who replied so quickly.

            Bart, your chart seems to confirm my point that inflation adjusted housing prices are not so far off the norm.

            Zoog, it makes sense to look at income versus housing prices, but Shiller's research that EJ bases his analysis on involves housing tracking CPI.

            Rajiv, As far as the fact that CPI already includes a housing component, creating a correlation, this has always been the case. But what portion of CPI is housing? Anybody know? 25%? 30%? Not enough to skew the whole thing as to create a correlation that is not at least somewhat supported by the other components.

            I suppose my question is: Why point the finger at housing? Nearly all domestically made goods, healthcare, education, commodities, stocks, PMs and other assets have experienced large price gains against the dollar in the last decade or so. Median incomes have not risen as fast as inflation. The one last panacea to keep us all from noticing all the price increases was cashing out home equity, and now that jig is up. There are tough times ahead as we realize how rich we're all not.

            In the '70s, inflation caused prices of consumer goods as well as housing and other assets to soar. Median incomes did not keep pace. The solution was not to adjust prices downward, but for more families to have 2 incomes. Maybe we're all going to have to work harder and longer to pay for all the nice things we're accustomed to. My hypothesis is that perhaps the need to make the housing payment without access to easy credit will cause more people to demand higher wages, exacerbating inflation.

            But 50% fictitious value of housing based on a static 3.3% CPI baseline still makes little sense to me.

            Thanks,

            Jimmy

            Comment


            • #7
              Re: Shadowstats CPI and the Housing Bubble

              Originally posted by jimmygu3 View Post
              But what portion of CPI is housing? Anybody know? 25%? 30%? Not enough to skew the whole thing as to create a correlation that is not at least somewhat supported by the other components.
              It's around 42% as I recall... but that's hugely deceptive due to all the fiddling and hedonics and owners equivalent rent BS, etc.

              Do also be aware that *very* few pay any attention to inflation adjusted values, so a correction of 20-30% in nominal values is not at all out of the question.
              We also have the issues of OFHEO prices not reflecting all the discounting going on and all the freebies being thrown in.
              http://www.NowAndTheFuture.com

              Comment


              • #8
                Re: Shadowstats CPI and the Housing Bubble

                Originally posted by zoog View Post
                So, 128 - 55 = 73% overvalued compared to median income.:eek: So saying 50% overvalued might even be conservative.
                I think you need to include the original values for housing and income in the calculation, not just the % change.

                Let's set both housing and income at a baseline of 100, for ease of calculations:

                After the increases, housing is at 228, and income is at 155.

                155/228=.68 (rounding)

                1-.68=.32, thus a 32% difference in 2005 housing prices vs income as compared to 1990.

                Comment


                • #9
                  Re: Shadowstats CPI and the Housing Bubble

                  Originally posted by Andreuccio View Post
                  I think you need to include the original values for housing and income in the calculation, not just the % change.

                  Let's set both housing and income at a baseline of 100, for ease of calculations:

                  After the increases, housing is at 228, and income is at 155.

                  155/228=.68 (rounding)

                  1-.68=.32, thus a 32% difference in 2005 housing prices vs income as compared to 1990.
                  Yeah you're right, that makes sense to me.

                  Originally posted by jimmygu3 View Post
                  Bart, your chart seems to confirm my point that inflation adjusted housing prices are not so far off the norm.
                  While I always like Bart's charts (even the ones that look like spaghetti), note that the numbers are normalized to the year 2000, so you are only seeing the expanding difference in the last few years. If they were matched to, say, 1960, it might look more extreme.
                  Originally posted by jimmygu3 View Post
                  Zoog, it makes sense to look at income versus housing prices, but Shiller's research that EJ bases his analysis on involves housing tracking CPI.
                  True, and you make a good point below:

                  Originally posted by jimmygu3 View Post
                  I suppose my question is: Why point the finger at housing? Nearly all domestically made goods, healthcare, education, commodities, stocks, PMs and other assets have experienced large price gains against the dollar in the last decade or so. Median incomes have not risen as fast as inflation.
                  Which brings me back to the affordability issue, which I think is more important than any correlation with the CPI or other measure of inflation. Of course the larger bubble here is the credit bubble, of which housing is a significant component, at least from the perspective of ordinary people. The access to cheap and easy credit has driven home prices above and beyond any effects from monetary inflation.

                  Stepping back a bit, I think there are so many flaws and approximations in the various numbers we might use to calculate something like this, that no one can arrive at anything more certain than an educated guess.

                  Furthermore, I am personally a little skeptical about using any type of "national" housing number. While home prices in some places skyrocketed in recent years, other places have plodded along near the CPI rate or a little higher. If nationally prices fall 20%, does that mean they fall that much everywhere? Of course not. Some places may only fall 5%, or not at all. Others may drop well over 50%.

                  Comment


                  • #10
                    Shadowstats CPI and the Housing Bubble

                    Shadowstats CPI and the Housing Bubble

                    Dear iTulip,

                    As always, thanks for sharing your knowledge and insider access with our online community.

                    I have been a bit puzzled by EJ's diagnosis of the housing market being composed of 50% fictitious value. It is stated that housing has historically risen at the rate of inflation. Since the CPI is no longer an accurate measure of inflation, shouldn't the Shadowstats CPI be the benchmark? Seems to me the 3.3% historical average is no longer realistic based on today's government abuse of our fiat currency.

                    Looking at even the most conservative Shadowstats numbers (pre-1990 method), it appears that inflation from 1990-2005 averaged about 5.5% (I don't have access to the exact numbers so I'm eyeballing it). That means a compounded 15-year increase in prices of about 123%. Even if it was only 5% annual inflation, that's 108% total.

                    Median home prices from the US Census indicate a rise from $96,400 in 1990 to $219,600 in 2005, or a 128% increase. By my calculations, that puts the fictitious value between 2% and 18%. And that's not even taking into account the 19% rise in average square footage (1905sf to 2273sf).

                    Whether or not Americans can actually afford the houses is the main issue in my mind. Median incomes over the period only rose 55% while M3 per capita skyrocketed 137%. So the money's out there, it's just not in the average Joe's pocket.

                    Could it be that the housing bubble is really more a problem of oversupply caused by cheap money fueling the construction of larger homes than incomes can sustain? Might this play out through slowing construction and wage pressure-driven inflation? And back to my original question... since the CPI is no longer an accurate measure of inflation, shouldn't the Shadowstats CPI be the benchmark for housing prices?

                    Thanks!

                    Jimmy

                    _____

                    Dear Jimmy,

                    You are asking a very good question that deserves a simple, straight forward answer. Unfortunately, there isn't one. Here's the complicated answer instead.

                    Let's start with your question about supply and demand creating the housing bubble. We make the case in our Open Letter to Federal Reserve Chairman Ben S. Bernanke that the Fed's rate cuts caused the housing bubble:
                    "As the Fed lowered short term interest rates from 6.5% May 2000 to 1% June 2003, LIBOR which is used by banks to set the variable portion of adjustable rate mortgages (ARM) declined to 1.25%. s a result, the monthly interest rate on an ARM declined from 6.5% to as low as 2.0%, effectively reducing the monthly cost of a $1,000,000 home in 2003 to the cost of a $630,000 home purchased with a 6.5% ARM or fixed rate mortgage a few years before. Not surprisingly, an unusually large numbers of ARMs were sold. Several years are needed for home builders to gear up and build new homes to increase supply. However, interest rates were dropped quickly and so credit and the money supply rapidly increased. Home prices therefore rose quickly."
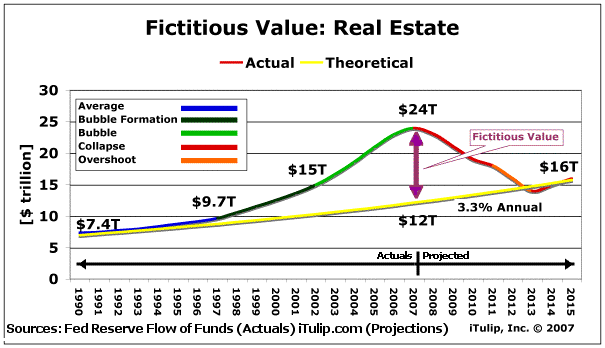
                    Let's move on to your question about fictitious value. In the chart to the left from Groundhog day in the housing market we see the Case-Shiller home prices index plotted against a 3.3% mean US inflation rate. The delta is the fictitious value created during the housing bubble. Your question is whether the Case-Shiller numbers are inflation-adjusted and the answer is: yes. You additionally ask question whether the CPI adjustment is itself valid or if it understates inflation.

                    John Williams notes at ShadowStats that the CPI has been reformulated so many times since the Nixon administration that comparing the inflated price of apples today to apples 20 years ago is impossible. It gets worse. At least we have Production/Consumption Economy inflation numbers to argue about. Inflation measures for the FIRE Economy don't even exist. (Real estate has been the centerpiece of FIRE Economy policy since the passage of the Tax Reform Act of 1986.)

                    Monetary policy is separate and in fact the opposite for the FIRE Economy and P/C Economy, so it doesn't make sense to adjust FIRE Economy asset inflation, such as in housing, using P/C Economy inflation measures like the CPI. The CPI is only marginally better for this purpose than using, say, annual inches of rainfall in Washington DC. By using the CPI what we are really measuring is the rise of the residential real estate sub-sector of the FIRE Economy compared to an inflation measure, arguably itself dubious, of the P/C Economy.

                    Now we enter the house of mirrors, so to speak. What we really want to do is compare the Case-Shiller home price appreciation numbers to overall FIRE Economy inflation. Unfortunately, the BLS doesn't measure FIRE Economy employment, GDP, and inflation, so we have to guess at it.


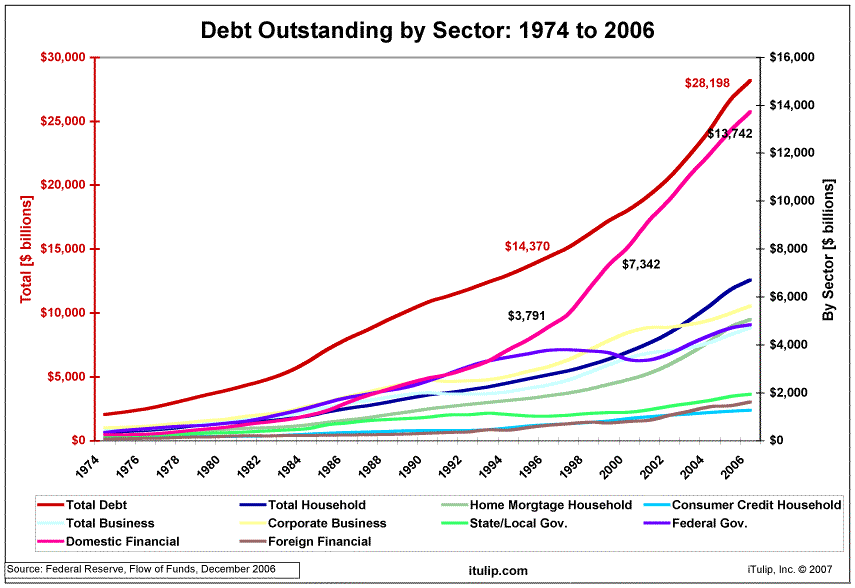
                    One measure of FIRE Economy growth is the amount of debt created. In Economic Cognitive Dissonance we take a stab at it with this chart.

                    It shows the combined FIRE and P/C Economies doubling debt levels between 1996 and 2006, from $14 trillion to $28 trillion. The debt taken on by the FIRE Economy grew more than 250% over the period, from nearly $4 trillion to nearly $14 trillion. Total business debt, which is mostly P/C Economy debt, grew by a modest 100%, from just over $2 trillion to just over $4 trillion. One interpretation of this is that real estate merely kept up with the rate of overall FIRE Economy inflation, and that no fictitious value was created within the FIRE Economy, from a FIRE Economy-centric view.

                    Right about now your wondering if this hall of mirrors has an exit. No, it leads to the question, how much of the value in the entire FIRE Economy is fictitious? From the perspective of the P/C Economy, all FIRE Economy growth off the 100 year trend line of FIRE Economy growth since 1980 can be considered fictitious. We'd hate to say how much that is, but the $13 trillion we assign to real estate is likely an understatement.

                    Payments that occur within the FIRE Economy are only relevant to the P/C Economy when they either escape or are not captured. As Hudson explains in grueling detail, the tax law system is designed to make sure that profits earned within the FIRE Economy stay there. If you try to take them out, the tax rate is so high that your profits are virtually wiped out. But if you use your profits to buy more real estate or other FIRE Economy assets then the tax rate is low on the transaction, as low as zero in some cases.

                    The FIRE Economy can implode if debts cannot be repaid out of profits within the FIRE Economy, due to asset price deflation or out of income from wages that the FIRE Economy captures as what economist's call "economic rent." This happened to Japan's FIRE Economy gradually since 1992 and the USA's suddenly after 1929. The system of capturing wages as economic rent for the FIRE Economy broke down. Asset price deflation was transmitted into the P/C Economy, leading to unemployment and declines in demand generally, which in turn depressed the FIRE Economy.

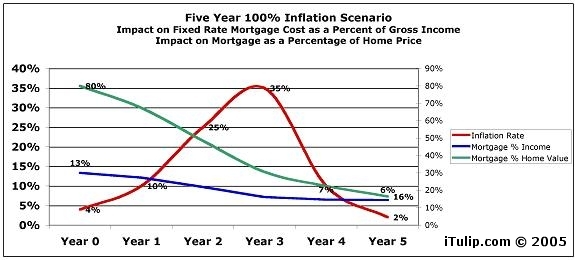
                    This leads us finally to your last question: can wage inflation be used to prevent a collapse in the real estate sector of the FIRE Economy? We explored this idea in Inflation is Dead! Long Live Inflation! It lays out a hypothetical 100% six year inflation and the impact on debt.

                    In our view, a period of high wage inflation can rescue the FIRE Economy. Granted, there are a lot of political reasons why this scenario is unlikely since it represents what FIRE Economy interests view as an unfortunate transfer of wealth in the wrong direction, from creditors to debtors. The preferred approach that benefits the banks that back the FIRE Economy is to keep re-financing and extending existing debts, for example turning 30 year mortgages into 50 or 100 year mortages. So that is likely what we will see.

                    That may not be entirely the answer that you were looking for, but we didn't create this crazy world. We just live in it.

                    Sincerely,

                    Eric

                    iTulip Select: The Investment Thesis for the Next Cycle™
                    __________________________________________________

                    Special iTulip discounted subscription and pay services:

                    For a book that explains iTulip concepts in simple terms see America\'s Bubble Economy: Profit When It Pops
                    For the safest, lowest cost way to buy and trade gold, see The Bullionvault
                    To receive the iTulip Newsletter or iTulip Alerts, Join our FREE Email Mailing List


                    Copyright © iTulip, Inc. 1998 - 2007 All Rights Reserved


                    All information provided "as is" for informational purposes only, not intended for trading purposes or advice.
                    Nothing appearing on this website should be considered a recommendation to buy or to sell any security or related financial instrument. iTulip, Inc. is not liable for any informational errors, incompleteness, or delays, or for any actions taken in reliance on information contained herein. Full Disclaimer
                    Last edited by FRED; September 28, 2007, 02:21 PM.
                    Ed.

                    Comment


                    • #11
                      Re: Shadowstats CPI and the Housing Bubble

                      Originally posted by zoog View Post
                      While I always like Bart's charts (even the ones that look like spaghetti), note that the numbers are normalized to the year 2000, so you are only seeing the expanding difference in the last few years. If they were matched to, say, 1960, it might look more extreme.
                      I'm glad that at least some have the proper appreciation for pasta... :eek:

                      I used to do those charts with a base year of 1963 or 1970, but then I have to use two scales and too many folk get confused. If I keep one scale and use a base year 1963, the CPI and CPI+lies adjusted numbers are very close to a flat line.

                      And frankly, it doesn't seem to make much difference - here's the same chart with base year 1963, and with two scales.

                      http://www.NowAndTheFuture.com

                      Comment


                      • #12
                        Re: Shadowstats CPI and the Housing Bubble

                        Originally posted by bart View Post
                        I'm glad that at least some have the proper appreciation for pasta... :eek:

                        I used to do those charts with a base year of 1963 or 1970, but then I have to use two scales and too many folk get confused. If I keep one scale and use a base year 1963, the CPI and CPI+lies adjusted numbers are very close to a flat line.

                        And frankly, it doesn't seem to make much difference - here's the same chart with base year 1963, and with two scales.

                        Heh, yeah what do I know? I started trying that with my chart of Shiller's data back to 1890, and it didn't make that much difference either, other than the vertical scale of the chart.

                        I think Fred should give you a Chief Chartmaster title.:p

                        Comment


                        • #13
                          Re: Shadowstats CPI and the Housing Bubble

                          Originally posted by zoog View Post
                          Heh, yeah what do I know? I started trying that with my chart of Shiller's data back to 1890, and it didn't make that much difference either, other than the vertical scale of the chart.

                          I think Fred should give you a Chief Chartmaster title.:p

                          Rimshot alert!
                          http://www.nowandfutures.com/grins/rimshot.mp3


                          I'll settle for ChartMeister-with-spaghetti-on-the-side? ;)
                          http://www.NowAndTheFuture.com

                          Comment


                          • #14
                            Re: Shadowstats CPI and the Housing Bubble

                            Eric,

                            Wow, thanks for the detailed reply! I am always humbled and challenged by the experts like yourself in the iTulip community who take the time to answer questions and break things down so that those of us without a PhD in Econ can digest it all.

                            Good point that the FIRE chiefs don't want inflation to turn the tables, allowing mortgage-holders to repay with cheap dollars. Just refi me into a 100-year neg-am mortgage, set me up with a third job on the overnight shift and I'll be fine.

                            Jimmy

                            Comment


                            • #15
                              Re: Shadowstats CPI and the Housing Bubble

                              It sounds to me like there's a serious need for Shadowstats to separate the data and create distinct FIRE and P/C price indexes.

                              My hunch is that oscillations in the FIRE price index will have greater amplitude than the P/C index going back at least to the early 80s if not the early 70s. I would also speculate that FIRE accelerations would tend to "lead" P/C price accelerations by about 6 months -- and similarly with decelerations.

                              In other words, the FIRE economy pulls and the productive economy is just along for the ride.

                              TO JIMMY:

                              The reason why housing *is* out-of-whack, even using Shadowstats, is because Shadowstats adequately accounts for FIRE economy price increases. Thus, the Shadowstats CPI is a good measure of the *combined* effect of the FIRE and P/C sectors.

                              Interestingly, this leads to a less sinister explanation for the Fed's push to alter how CPI is calculated. My guess is that they're trying to eliminate bubble economy factors from the measure so that they can better track when the actual production system is turning toward recession.

                              To summarize further -- the price of housing has remained constant relative to inflation in all sectors, but real wages have tended to follow the rate of P/C price changes. The ability of people to pay for homes has thus declined. Either way the price of homes became progressively higher than the incomes of those purchasing them, which makes it a bubble.

                              Comment

                              Working...
                              X