 |
In a recession, a recovery in personal consumption, incomes, and retail sales signals the start of recovery. The virtuous cycle of credit growth--and its corollary, debt growth—combine with rising incomes as the rate of unemployment growth slows. Credit expansion leads the economy out of the cycle, followed by incomes. That is what many stock market participants think they are seeing now, as previous experience has trained them to see. But they are wrong.
In an economy where household expenditure accounts for 71% of GDP as in the U.S. in 2008, if household cash flows from wage income declines, retail spending falls. Government through interest rate cuts and tax cuts stimulates the economy by increasing credit cash flows. This approached effectively to end every recession in the U.S. since the end of WWII. Keep in mind that each recession was created by monetary policy, by the tightening of credit in order to reduce inflation expectations, real or imagined.

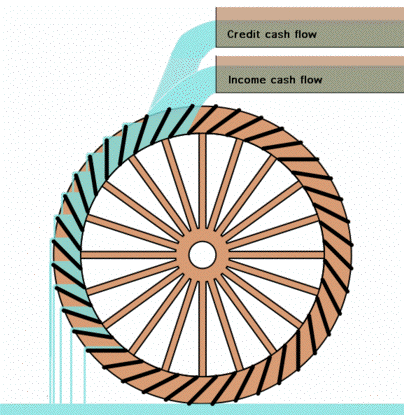
Think of a consumer-dependent economy as a waterwheel, with household cash flow from wages and credit driving the wheel, and the wheel driving the creation of new jobs, income, and credit, pumping money into the economy. If either the credit flows or the income flows dry up, the wheel slows. If they both dry up, one after the other, the wheel slows a lot. In a recession, the government tries to get the wheel moving again by making up for private credit flows and private income flows with government credit and government jobs.
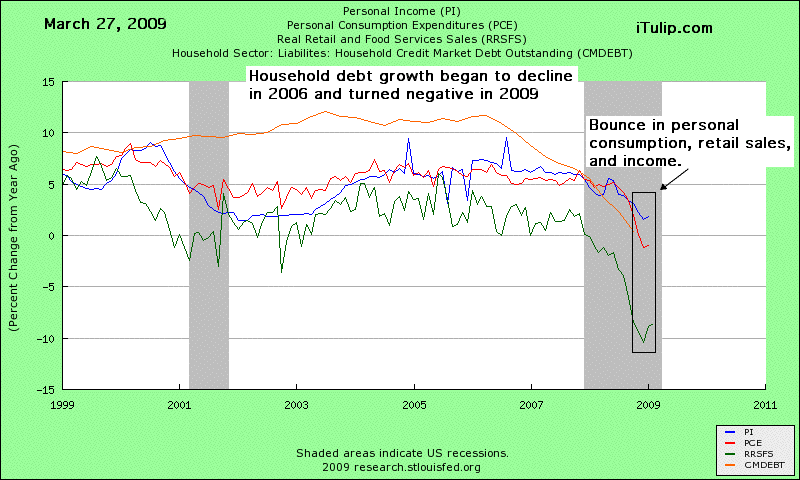
A depression, on the other hand, happens when debt levels are so high that there is not enough cash flow from incomes or new credit creation in the economy to service the interest on the debt. The result is debt deflation and economic depression. Debt deflation started in 2006 for households when the price of their homes began to fall.
A depression, unlike a recession, is not induced by government raising interest rates to combat inflation. On the contrary, a depression occurs in spite of all efforts by government to expand credit; interest rates are cut to zero yet the debt deflation goes on.
Debt deflation cannot be stopped by government credit expansion because that effort only increases debt levels that are already excessive as a result of decades of previous interventions to re-start the already over-indebted economy. As the economy shrinks, there is even less income available to repay debt, and a vicious cycle sets in. The wheel not only stops, it begins to run backwards and pumps money out of the economy.
Debt deflation at first withdraws household purchasing power from credit. Later households experience a decline purchasing power from loss of wage income as layoffs increase and savings are consumed in debt repayment. Government, by pouring vast sums of government money into the economy in an attempt to restart the virtuous credit cycle can produce a small “bounce” in the decline in aggregate demand that shows up as consumer spending, but cannot restart the wheel as it can during a recession. Debt levels continue to fall, and soon consumer expenditures as well.

Stock market participants are trained by previous recessions since WWII to expect a recovery after consumption expenditures turn around in response to fiscal and monetary stimulus. They are not wired to comprehend the wholly different dynamics of a debt deflation as we identified it in Dec. 27, 2007 and forecast a 40% decline in the DJIA in line with the first year decline that the Japanese stock market experienced in the first year of Japan’s debt deflation (see Time, at last, to short the market $ubscription).
U.S. re-inflation policy has been far more aggressive than Japan’s, and the recent announcement by the Fed to begin buying Treasury bonds farther out the yield curve is motivating investors to move out of government bonds, and some of that money moved into stocks.
This rally does not reflect an improvement in the underlying economy but the response of market participants to short term government policy in the context of a widespread misperception of the current depression as a recession.
The stock market rally is a disconnect between investor expectations and the economy. How disconnected?

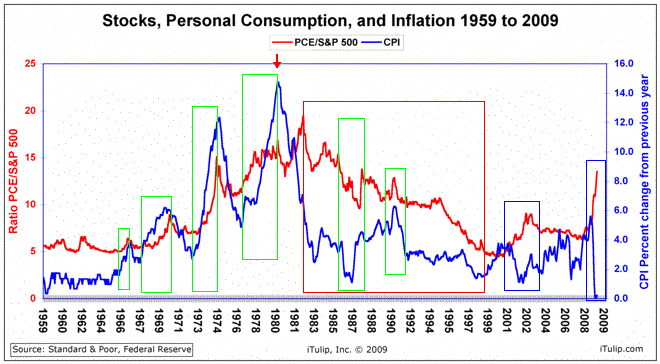
CPI peaks lag peaks in the PCE/S&P ratio by one year in each cycle until
the beginning of the FIRE Economy in 1980s. Over the duration of the disinflationary era
starting in 1981 until the peak of the technology stock asset price inflation in 2000, both
the PCE/S&P ratio and inflation declined, with periods of high correlation between the
PCE/S&P ratio and CPI inflation one year later. The correlation turned negative for the first
time following the extreme asset price reflation measures undertaken in 2001 that
boosted both consumption and the S&P. The extreme negative correlation between the
PCE/S&P ratio and CPI inflation is unique over the 50 year period.
Japan’s experience with managing debt deflation via fiscal stimulus has been similar to that of the U.S. in the 1930s; whenever government spending was cut, the economy slumped back into depression. The U.S. finally escaped debt deflation when WWII. There is no evidence to support the belief that fiscal stimulus can end a debt deflation, but that is the belief that governments are following worldwide.
We claim no special debt deflation bear market rally timing skills. Even after the DJIA approaches our target of 5000, we have no idea how long it will remain trading in a low range. The duration of the downturn depends on the political response to global economic contraction. The flawed philosophy and ideology of curing the debt deflation illness with further exposure to the debt disease, as the U.S. attempted in the 1930s and Japan has tried since the early 1990s, do not encourage optimism but point to a prolonged and painful period of global economic contraction.
iTulip Select: The Investment Thesis for the Next Cycle™
__________________________________________________
To receive the iTulip Newsletter or iTulip Alerts, Join our FREE Email Mailing List
Copyright © iTulip, Inc. 1998 - 2009 All Rights Reserved
All information provided "as is" for informational purposes only, not intended for trading purposes or advice. Nothing appearing on this website should be considered a recommendation to buy or to sell any security or related financial instrument. iTulip, Inc. is not liable for any informational errors, incompleteness, or delays, or for any actions taken in reliance on information contained herein. Full Disclaimer
Comment