 |
The lead economic story today is capacity utilization and output, or, more to the point, the lack thereof. Output plunged 1.4% in February after falling for four months, and five out of the past six. As usual for this depression, the February decline was far worse than most "economists" expected; the consensus view was a 0.9% drop.
Capacity utilization fell in February to the same level reached at the bottom of the second 1980s recession, 70.9% in December 1982, an all time low since the Fed started keeping records. Are we having fun yet?
Back to the US and the present. Capacity utilization for manufacturing alone fell in February 2009 to a new record post-war low of 67.4.0%.
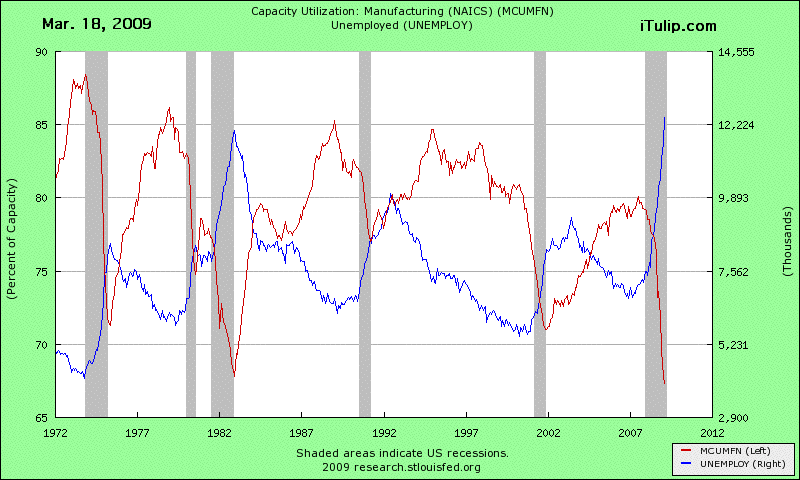
Capacity Utilization (how much manufacturing capacity is being used) versus unemployment
We have long warned that this depression will be as severe in terms of falling output and employment as the early 1980s recession. But a crucial difference between that recession and this depression bears repeating: the Fed created the early 1980s recession on purpose, and has done everything in its power to prevent the current collapse, to no avail.
Over the weekend, Bernanke did an interview for 60 Minutes. In it he opined that the recession might end in 2009, as if this were another Fed manufactured recession as in the 1980s that the Fed controlled. Let’s compare then and now and see why this line of thought is faulty.
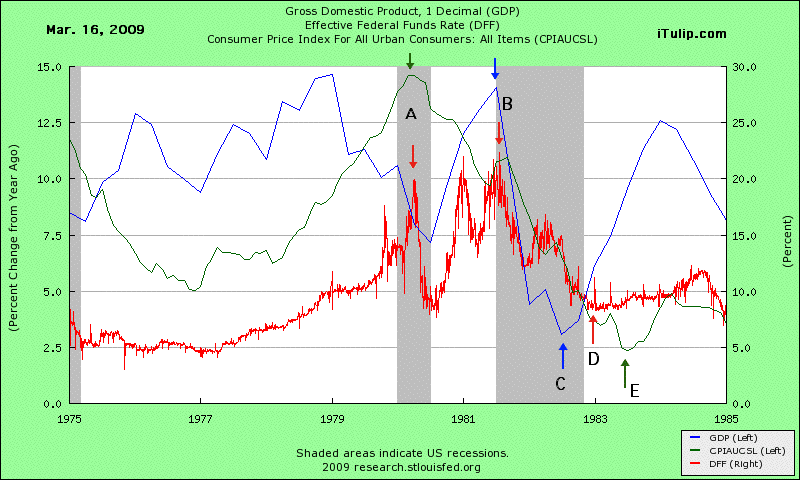
GDP versus Effective Fed Funds rate versus CPI: 1975 to 1985
A: In the 1980 to 1983 recession cycle, CPI inflation peaked as the Fed cranked the Fed Funds Rate up to 16.1% in Oct. 1979, triggering a recession (shaded). Both CPI growth and the Fed Funds rate peaked in 1980 and fell ever since.
B: The Fed dropped rates to below 10% during the recession. The first recession ended and the Fed started to aggressively raise rates again, this time all the way to 22.36% in July 1981 as the CPI continued to decline, although it did make a slight upturn in 1982. The start of the second recession coincided with that peak in rates.
C: The Fed once again dropped rates fast. CPI inflation and GDP growth dropped together through the recession that ended in 1982.
D: In 1983, the Fed Funds Rate touched 8.22%.
E: The Fed Funds rate drifted back up over 10% as the economy recovered. Inflation increased modestly but the beast had been tamed. All it took was high employment, around the same levels we are seeing today.
Since we are frequently told this recession is in severity like the 1980s recession, let’s compare that scenario to our current circumstances.
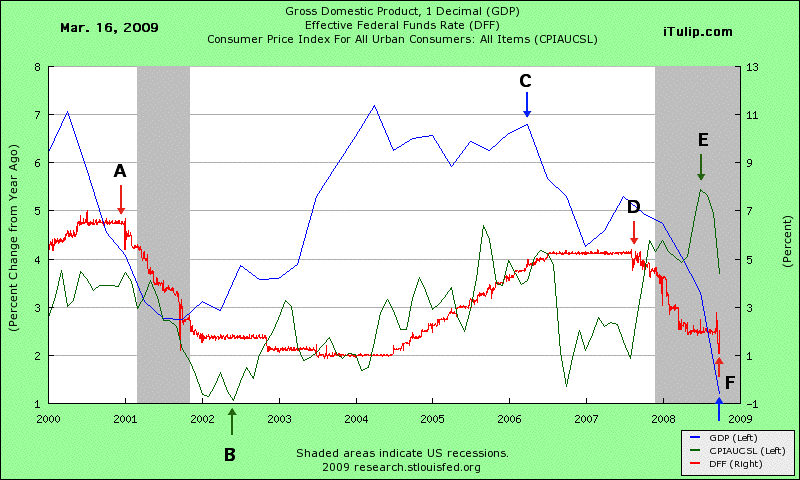
GDP versus Effective Fed Funds rate versus CPI: 2000 to Feb. 2009
A: The Fed Funds Rate peaked at 7.03% in July 2000 as the Fed sought to reign in the stock market bubble fueled economy. GDP had declined for months and with inflation modest, a recession was guaranteed, and we forecasted one to start in January 2001. The Greenspan Fed then began its now famous aggressive rate cutting campaign to 1%.
B: Inflation briefly hit zero in 2002 as the economy expanded, lagging the end of the recession by several months before turning up. The housing bubble and other symptoms of credit expansion started to appear, as the economy expanded again and the Fed raised rates back over 5%.
C: The housing bubble economy peaked with the housing market in 2006 and housing prices started to decline.
D: The first signs of the credit and banking crisis sent the Fed into emergency rate cut mode. Within a year, the funds rate is effectively zero.
E: CPI inflation peaked six months into the current recession, as cost-push inflation caused by the weak dollar (not shown) peaked then subsided with falling demand and, later, a strengthening dollar.
F: Here we are, with GDP in steep decline along with inflation, interest rates at zero, and unemployment (not shown) rising rapidly with collapsing output.
Today is like 1983 with respect to falling GDP growth, output, capacity utilization, demand, and unemployment. But it is different in one absolutely crucial respect:
The recession and disinflation we are experiencing today were not induced intentionally by the Fed raising interest rates from 5% to 22% to create a recession to choke off inflation. Today’s declines are happening in spite of all attempts to stop debt deflation by creating inflation via low interest rates and drastic debt monetization measures to prevent a recession. The decline is global and out of control.
The 2001 - 2007 New New Deal gave us the housing, private equity, and other bubbles, which crashed as we expected one after the other starting in mid 2006.
Where are we?
Unlike 1930, 1983, and 2001, today all of monetary, tax cut, and deficit spending bullets have been fired that won’t backfire on the US by reducing US creditworthiness. With a fiscal deficit to GDP ratio fast approaching third world levels (as high as 10% this year), our one remaining loyal creditor, China, is becoming increasing vocal and public about the future value of its US Treasury bond holdings.
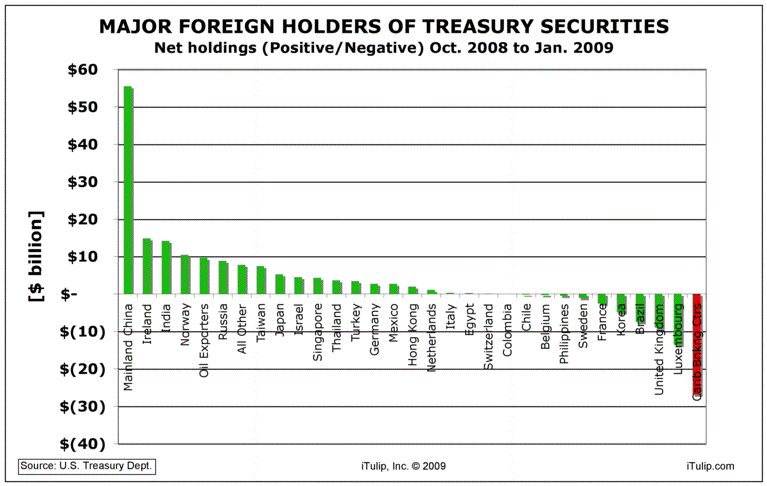
Net increase in Treasury Securities holdings since the U.S. Q3/Q4 2008 debt crisis. Who's your buddy? Who's your pal?
Declines in net holdings in Caribbean Banking Centers and Luxembourg appears to coincide with a crack down on these nations as tax havens. Will the money the U.S. Treasury gains in tax revenue be given up in a decline in foreign borrowing?
China is having plenty of problems of its own, although you’d hardly know it by reading the state media.
China auto sales up nearly 25 pct in Feb: state media
BEIJING (AFP) — Chinese auto sales rose nearly 25 percent last month from a year earlier, buoyed by government policies to boost the sector, state media reported Tuesday.
The figures from the China Association of Automobile Manufacturers appeared to show that the Asian giant beat the United States as the world's largest market for a second consecutive month.
February sales of domestically made autos -- which make up the vast majority of the Chinese market -- hit 827,600, up 24.7 percent from a year earlier, the Xinhua news agency reported, citing the association.
Domestic auto sales are up 25% in January 2009? Odd, because if you go to the Chinese National Bureau of Statistics web site you will see that internal combustion engine output is off 50.4% year over year in January. Unless there are thousands of Chinese buying cars without engines in them, we’ll take the China Association of Automobile Manufacturers unit sales numbers as no more reliable than the U.S. National Association of Realtors' data on home sales. BEIJING (AFP) — Chinese auto sales rose nearly 25 percent last month from a year earlier, buoyed by government policies to boost the sector, state media reported Tuesday.
The figures from the China Association of Automobile Manufacturers appeared to show that the Asian giant beat the United States as the world's largest market for a second consecutive month.
February sales of domestically made autos -- which make up the vast majority of the Chinese market -- hit 827,600, up 24.7 percent from a year earlier, the Xinhua news agency reported, citing the association.
Post Housing Bubble New New Deal, starting in 2008 we are in an new kind of 1938, post credit bubble and post fiscal initial stimulus -- that stimulus that produced the housing bubble -- and with yet more fiscal stimulus beginning, albeit of a more traditional infrastructure development and jobs creation variety. However, the recently approved economic recovery plan is unlikely to create a $10 trillion fictitious value boost to the economy that the the housing bubble provided, and without reducing the debt burden on businesses and households left over from the FIRE Economy era, are not likely to increase savings, net of debt repayment.
No one can say how the US and the world economies could have recovered from the failure of the old New Deal programs to re-start the post 1920s credit bubble economy if WWII had not occurred.
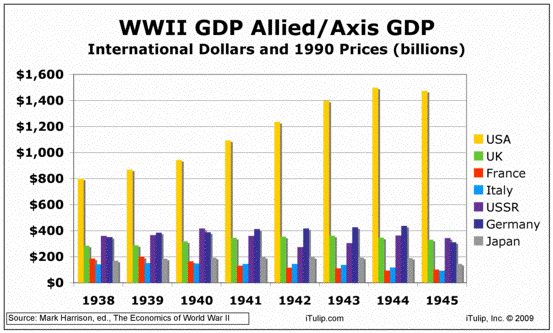
WWII grew all Allied and Axis economies except Italy's
How to halt debt deflation and induce demand creation in a world of over-capacity and over-indebtedness without war? That is the question. All other questions are irrelevant.
New Bull Market?
We hear pronouncements of a new bull market after the latest Debt Deflation Bear Market rally.
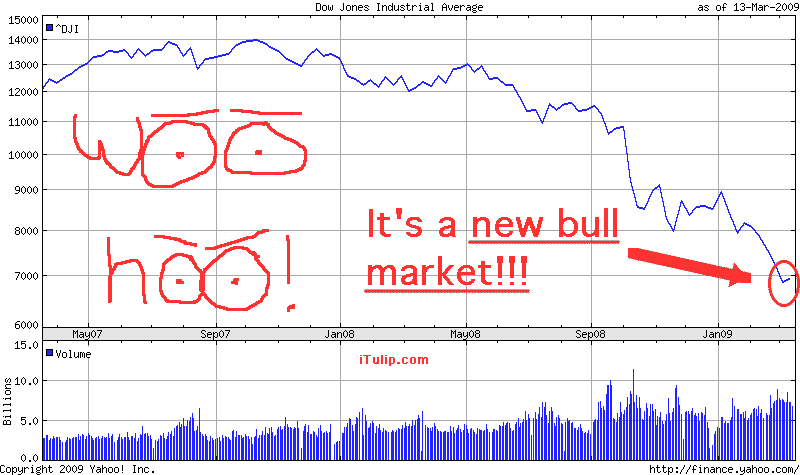
Perhaps premature to be calling the start of a bull market?
We have a feeling, more than a hunch and strong enough for us to take some short positions, that this relief rally has run out of gas.
iTulip Select: The Investment Thesis for the Next Cycle™
__________________________________________________
To receive the iTulip Newsletter or iTulip Alerts, Join our FREE Email Mailing List
Copyright © iTulip, Inc. 1998 - 2009 All Rights Reserved
All information provided "as is" for informational purposes only, not intended for trading purposes or advice. Nothing appearing on this website should be considered a recommendation to buy or to sell any security or related financial instrument. iTulip, Inc. is not liable for any informational errors, incompleteness, or delays, or for any actions taken in reliance on information contained herein. Full Disclaimer


Comment