Announcement

Collapse
No announcement yet.

Real DOW Update: Still looking for a bottom? Eric Janszen

Collapse
X
 
  • Filter
  • Time
  • Show
Clear All
new posts

  • #31
    Re: Real DOW Update: Still looking for a bottom?

    You can't have very high inflation, let alone hyperinflation and a collapsing stock market. One of these two variables is either lying (evidently it's not the stock market lying, as it's doing a swan dive) or that variable will have to turn right around and scoot right back towards the other one in a hurry - it's either that, or we are in an environment which has nothing whatsoever to do with inflation. My suggestion, DOW has to turn and scoot up in a hurry just as soon as iTulip's core thesis (very high inflation) manifests. Last time I checked, iTulip's thesis was that inflation would have to appear ... soon. IMO proponents of the DOW as a bottomless pit are not adding this up. Or iTulip's high inflation forecast is way early. Take your pick. You can't have both.

    Comment


    • #32
      Re: Real DOW Update: Still looking for a bottom?

      Why not? Wouldn't leverage disappear in hyperinflation? In real terms hyperinflation would make things worse not better. I would expect real estate values to fall as well in hyperinflation. If hyperinflation occurs I doubt there will be too many places willing to lend a 30 year mortgage.

      Comment


      • #33
        Re: Real DOW Update: Still looking for a bottom?

        Real estate and land would do well under hyperinflation. Under high inflation, it would depend.

        When has the stock market been an accurate predictor of the economy? It is governed by manics/depressives who bid up and short the stocks with the slightest of whims. In periods of high inflation the stock market may continue to fall but commodities will improve. Under hyperinflation, many businesses will go bust while others will succeed. The indexes will rise as it drops the dead weight and adds those that are rising. However, to assume that all stocks will rise is not correct.

        Lukester please stop with your gloating over the recent drop in gold prices, it is very unbecoming and annoying. First your predictions of 1-2 year decline has not fully played out yet so it may be premature to wave the victory flag. Second, no one is perfect. Learn from your mistake and be humble with your successes. Many of your predictions have not panned out let alone been coherent.

        Final thought, the gold market reeks of current manipulation. They have been successful in suppressing daily gold prices.

        Comment


        • #34
          Re: Real DOW Update: Still looking for a bottom?

          bart, am I correct to assume that your chart implies that the Dow is below its trend line in real (shadowstats) terms?

          If so, that appears to be a divergence from iTulip real Dow chart no?

          Or perhaps your trend line differs from iTulip's trend line, hence a direct comparison is not possible...?

          Comment


          • #35
            Re: Real DOW Update: Still looking for a bottom?

            Originally posted by LargoWinch View Post
            bart, am I correct to assume that your chart implies that the Dow is below its trend line in real (shadowstats) terms?

            If so, that appears to be a divergence from iTulip real Dow chart no?

            Or perhaps your trend line differs from iTulip's trend line, hence a direct comparison is not possible...?
            bart: You did a linear fit rather than an exponential, and included the entire data set -- right?

            My impression is that iTulip fit a "compounding rate of growth" model rather than a straight line, and they are not including data from recent decades.

            Comment


            • #36
              Re: Real DOW Update: Still looking for a bottom?

              Originally posted by ASH View Post
              bart: You did a linear fit rather than an exponential, and included the entire data set -- right?

              My impression is that iTulip fit a "compounding rate of growth" model rather than a straight line, and they are not including data from recent decades.
              The data and calculations are all here.
              Ed.

              Comment


              • #37
                Re: Real DOW Update: Still looking for a bottom?

                Originally posted by FRED View Post
                The data and calculations are all here.
                Ah. Average annual growth between the mid points between market peaks.

                Comment


                • #38
                  Re: Real DOW Update: Still looking for a bottom?

                  Bart,

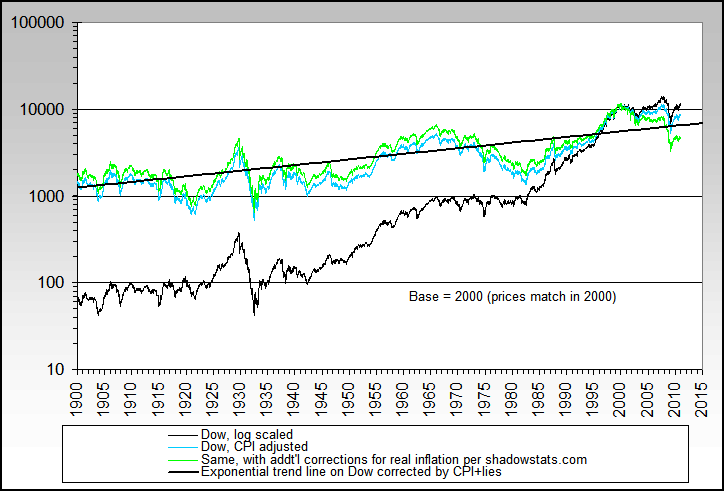
                  Instead of a linear trend , could we have it log linear? log on the vertical?

                  Then we can have a direct comparison between EJs version, and that corrected for CPI+ lies

                  Also that may show what the real Dow Growth rate has been, rather than the 1.64% that EJ shows -- and possibly also GDP corrected appropriately on the same graph.

                  Thanks

                  Comment


                  • #39
                    Re: Real DOW Update: Still looking for a bottom?

                    Originally posted by LargoWinch View Post
                    bart, am I correct to assume that your chart implies that the Dow is below its trend line in real (shadowstats) terms?

                    If so, that appears to be a divergence from iTulip real Dow chart no?

                    Or perhaps your trend line differs from iTulip's trend line, hence a direct comparison is not possible...?
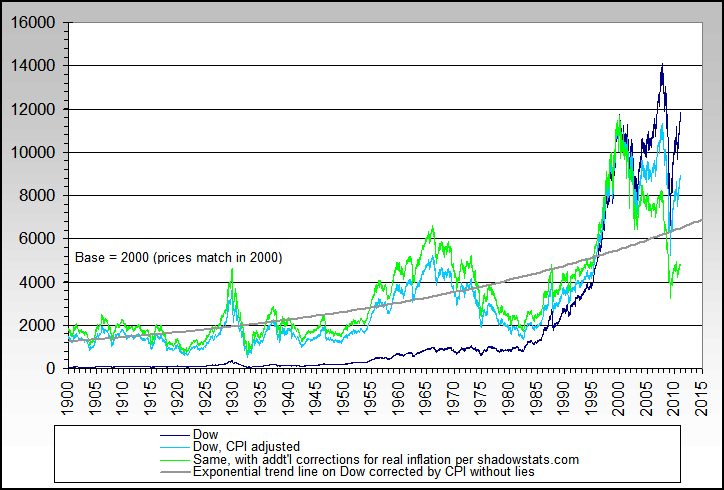
                    First, the two charts are not directly comparable since mine uses Dow values back adjusted from the base year 2000 where iTulip's uses a ratio... but the general shape of the iTulip one matches my CPI only corrected line fairly well.

                    The trend lines are also different, since mine is based on the CPI w/o lies data and also covers a different time period. That's the major difference that makes valid comparisons tough.

                    I did just switch the chart to an exponential trend line to help out a rough comparison, and the approximate value behind the trend line is about 2.3%/year growth which seems pretty close considering that CPI w/o lies would be higher than CPI.

                    And yes, we are already quite a bit below the long term trend line. An overshoot is 100% normal & expected.


                    Originally posted by ASH View Post
                    bart: You did a linear fit rather than an exponential, and included the entire data set -- right?

                    My impression is that iTulip fit a "compounding rate of growth" model rather than a straight line, and they are not including data from recent decades.
                    Right on both... and I mostly posted the chart to satisfy those who were also looking for a shadowstats correction. It didn't strike me that the trend line would turn into an issue, so I just switched it to exponential instead of linear to hopefully help.

                    It looks from here that the iTulip 1.64% value covers the period 1924-1995 (best I can tell from the referenced article), so its to be expected that my growth rate doesn't match -- even excluding that one uses CPI and the other CPI w/o lies.


                    Here's the new chart, the only change being to change the linear to an exponential trend line:

                    http://www.NowAndTheFuture.com

                    Comment


                    • #40
                      Re: Real DOW Update: Still looking for a bottom?

                      What does your "growth rate" work out to?

                      Comment


                      • #41
                        Re: Real DOW Update: Still looking for a bottom?

                        Originally posted by Rajiv View Post
                        Bart,

                        Instead of a linear trend , could we have it log linear? log on the vertical?

                        Then we can have a direct comparison between EJs version, and that corrected for CPI+ lies

                        Also that may show what the real Dow Growth rate has been, rather than the 1.64% that EJ shows -- and possibly also GDP corrected appropriately on the same graph.

                        Thanks
                        I'm limited by the functions available in Excel - exponential is as close as I can get (and its basically log).
                        This is the best I can do on a log chart too:


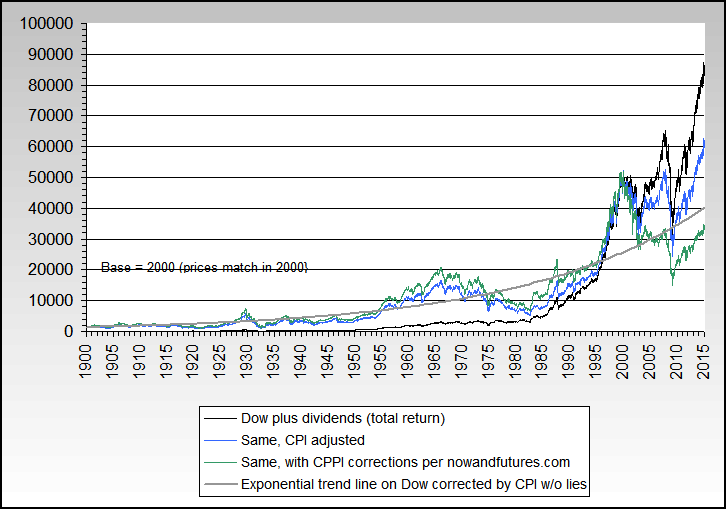
                        As far as the very long term growth rate, I've only calculated it for the yearly return for Dow including dividends from 1/1900-12/2007:
                        Nominal - 6.1%
                        CPI corrected - 2.9%
                        CPI w/o lies corrected - 2.3%


                        Edit/add: I just did calculate the CAGR for my CPI adjusted Dow series for 1900-2007, and its 1.88%/year. If I go through 2008, it's 1.46%/year... so EJ's 1.64% is very workable.
                        Last edited by bart; March 03, 2009, 09:51 PM.
                        http://www.NowAndTheFuture.com

                        Comment


                        • #42
                          Re: Real DOW Update: Still looking for a bottom?

                          Thank you bart!

                          The saying; "gentlemen and a scholar" certainly applies, which to that, I would add: all around good guy.

                          Comment


                          • #43
                            Re: Real DOW Update: Still looking for a bottom?

                            Originally posted by LargoWinch View Post
                            Thank you bart!

                            The saying; "gentlemen and a scholar" certainly applies, which to that, I would add: all around good guy.
                            You're most welcome.

                            Too bad you're not female, single, gorgeous & rich... ;)
                            http://www.NowAndTheFuture.com

                            Comment


                            • #44
                              Re: Real DOW Update: Still looking for a bottom?

                              If the goal is estimating "real" growth instead of debt-driven illusory growth, then it seems like what you would want to do is to calculate the CAGR up to right before the recent debt-driven bubble started. Then extrapolate that curve to 2009. Otherwise, if you include the recent numbers, the curve will be biased to the upside.

                              It would be interesting to compare that curve to one calculated the same way for GDP.

                              Comment


                              • #45
                                Re: Real DOW Update: Still looking for a bottom?

                                Thanks -- I think that this adds clarity to the debate.

                                Comment

                                Working...
                                X