 |
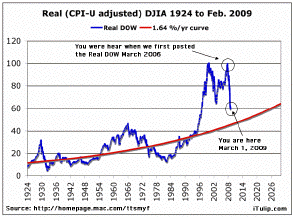
We first published the Real DOW when we re-opened iTulip.com March 2006. At the time the DOW traded around 11,400. Today the DOW closed at 6763, nominally off 41% since our Real DOW warning, and below the 7552 level that so many stock market watchers called a “bottom” at the time we published our warning, Beware Relief Rallies in November 2008. Are we finally close to a bottom? The Real DOW, so reliable for so many years, still says, No.
Back in 2006 – seems so long ago, doesn’t it? -- we received numerous objections to the Real DOW analysis, along the lines of “You aren’t counting dividends!” and “You guys are so negative!” Most were not that polite.
We figured that when the market finally tanked that companies that paid dividends were likely to cut the dividends to conserve cash. GE’s recent move to cut dividends by nearly than 70% is a good example. In any case, dividends or not, the market was entirely over-inflated, as any sentient being could see by looking at our chart. The mean reversion trip to the 1.64% curve started off slowly in 2006 due to inflation while the nominal price rose, and has accelerated downward at a fast and furious pace since early 2008 in nominal terms. Expressed in the Real DOW, it all looks like one continuous correction.
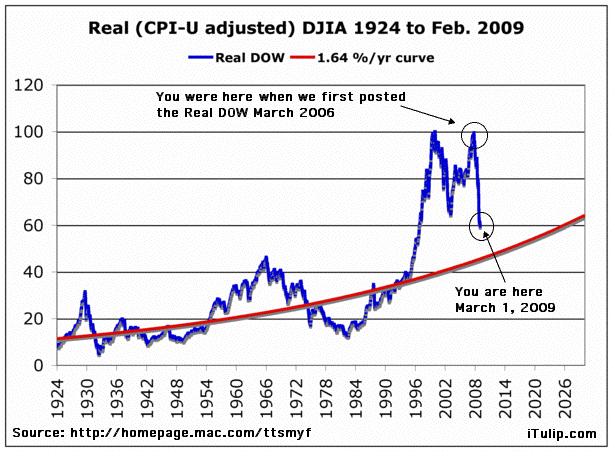
The good news is that the DOW may be more than half way or more through the mean reversion process. The bad news is that we may still have a long way to go.
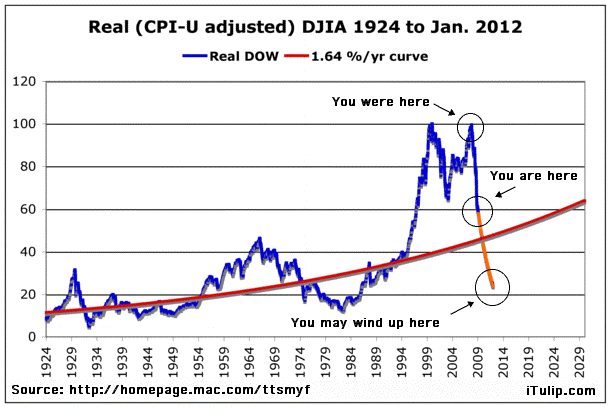
If the Real DOW overshoots as much as it did last time the stock market reflected a relatively minor debt deflation, we are only about half way through the correction.
Keep in mind our Real DOW is, well, real – that is, inflation adjusted; during the previous debt deflation bear market, stocks declined rapidly in nominal terms then in inflation-adjusted terms. Note that in Real DOW terms, the entire 1966 to 1983 period appears as one continuous bear market, first disinflationary then inflationary. Likewise, the more extreme debt deflation bear market that started in early 2006 during the inflationary weak dollar period and continued into the disinflationary period that started at the end of 2008; in Real DOW terms, the decline is continuous.
There are several ways that the DOW can go on to the queasy lows shown above. One way is for inflation to rise and for the DOW to fall only moderately further in nominal terms. We might, for example, see the DOW fall to 5000, our long-term DOW target, while inflation rises into double digits as occurred between 1975 and 1980, in early 2012. But that's just a guess, of course.
Trying to figure out exactly how the Real DOW will finally meet up with the 1.64% curve and how much it may overshoot -- and when -- keeps us busy, but we have since March 2006 not doubted that it eventually will.
How deep a Modern Depression?
We started to talk about The Modern Depression back in April 2006. October of that year we pegged its commencement to Q4 2007, and with Friday’s Commerce Department announcement of GDP contraction in the US at a 6.2% annual rate in Q1 2008, 60% higher than the consensus forecast of 3.8%, we now issue a range of forecasts for the length and depth of the Modern Depression.
Our first analysis focuses on US GDP. Later analyses will delve into output, exports, tax receipts, savings, investment, current account, and other key measures of the Modern Depression economy.
Methodology
We weigh major macro-economic antecedents, economic policies, and policy results comparing The Great Depression and the Modern Depression to arrive at best, medium, and worst-case scenarios.
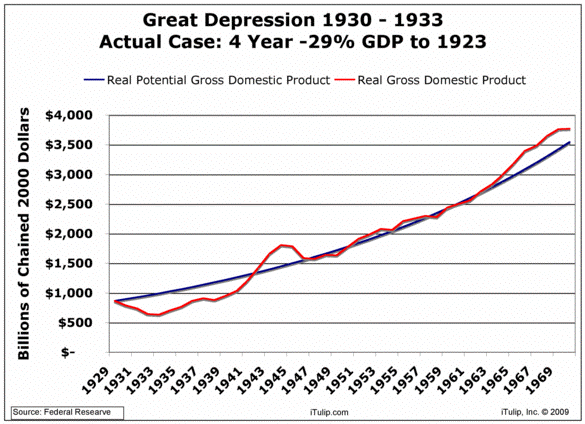
Economy contracted to GDP reached 10 years previous
Current Modern Depression GDP Forecast
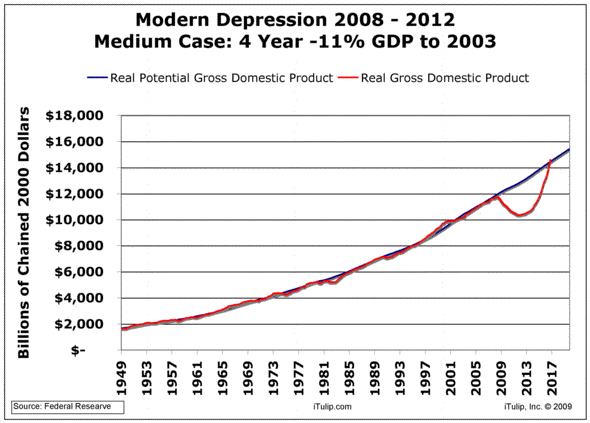
Eight year cycle: Economy contracts to GDP reached 5 years previous, recovers in four years
Subscribers can read the complete analysis at Modern Depression: Focus on US GDP ($ubscription)
iTulip Select: The Investment Thesis for the Next Cycle™
__________________________________________________
To receive the iTulip Newsletter or iTulip Alerts, Join our FREE Email Mailing List
Copyright © iTulip, Inc. 1998 - 2007 All Rights Reserved
All information provided "as is" for informational purposes only, not intended for trading purposes or advice. Nothing appearing on this website should be considered a recommendation to buy or to sell any security or related financial instrument. iTulip, Inc. is not liable for any informational errors, incompleteness, or delays, or for any actions taken in reliance on information contained herein. Full Disclaimer
Comment