Weekly Wrap
Benign inflation. Just what the Professor ordered?
First, a quick look at the inflation picture.
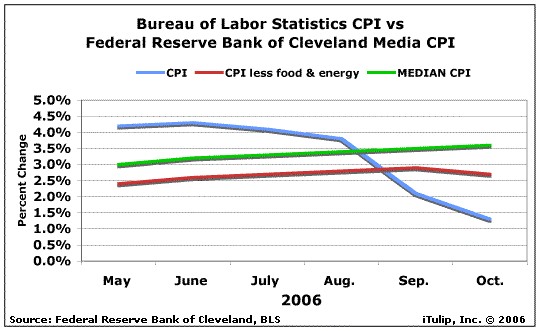
CPI versus median CPI
While Wall Street is cheering the Bureau of Labor Statistics' (BLS) benign November CPI inflation number, before concluding that a Fed rate cut is in the works for early next year, investors need to consider that the Fed may be going by its own less politically convenient statistics, the median CPI. The median CPI is a measure of core inflation calculated by the Federal Reserve Bank of Cleveland based on data released in the BLS's monthly CPI report. Earlier this year, the Median CPI came in below the CPI. But starting in September, as energy prices declined–prices which the BLS discounts from the CPI as "too volatile" when rising, but appears to add back in when energy prices are falling –have over the past few months diverged from the CPI. The Fed sees inflation, just as you and I do when we go to a restaurant or pay a tuition, insurance, or health care bill. The question is, in the face of uncertain fallout from the collapse of the housing bubble, what can the Fed do about it?
That depends on what the Fed sees in the economy. Our position is that the collapsing housing bubble is as likely to lead to recession as driving drunk while talking on a cell phone in rush hour traffic is likely to lead to an accident. In the case of a drop in permits and recessions, causation is hard to prove; there is no breathalyzer test for the housing market, but the correlation is unmistakable. Our analysis shows a high correlation between a steady decline in housing permits to below 25% and recession.
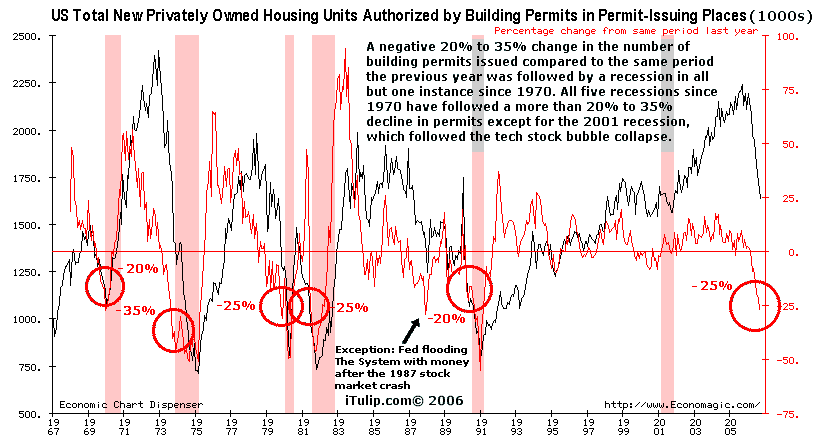
Big drop in housing permits authorized has a high correlation with recession
This chart is a bit busy, so I'll explain. The left hand axis in black shows the actual number of housing permits authorized. The right hand axis in red shows the percent change in the number of permits authorized compared to the same period last year. Note that five of the last six recessions since the late 1960s followed a more than 20% to 35% decline in the number of permits issued compared to the same period the previous year. The only recession that was not associated with such a decline in housing permits was the 2001 recession, which followed the collapse of the technology stock bubble in 2000. No way of saying whether there is one factor that causes both permits to fall and recessions to start, or whether the decline in new building leads to a fall in demand that causes the recession. I say, Who cares? We are approaching a 35% decline in new housing permits since the same period in December 2005. That is the absolute limit below which the U.S. has never failed to experience a recession. Of course there's always a first time, and Wall Street appears to be betting on it.
The stock market is still viewed as a brilliant discounting mechanism, magically pricing in future events six to nine months in advance. Putting aside the obvious evidence that this is false, such as the year 2000 market crash, what is the chance that the markets are failing to discount a housing bust led recession?
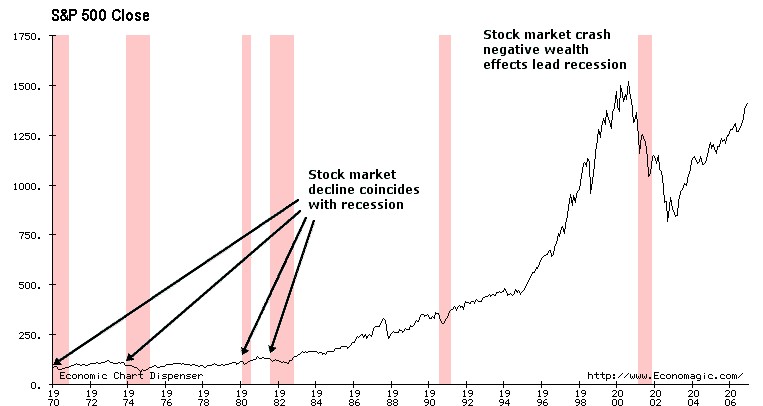
Stock markets tend to not price in recessions
A series of charts not shown here but summarized above zero in on these recession periods shown–1970, 1974, 1980, and so on. These show that the S&P declines usually as a recession begins, except in 2001 when the wealth effect of the declining market contributed to the recession that followed–was part of the cause, not the effect. The summary chart above gives you the general idea. Anyone who says you can't have a rising stock market going into a recession needs to examine strong evidence to the contrary.
So if not discounting a recession, why is the stock market at least not showing more caution in light of a housing market bust that has led every recession except one since 1970?
Four reasons. One, early in an inflation cycle firms enjoy–for six to nine months–a perfect world in which they can raise prices but do not have to raise wages. The result, at least for a while, is increasing profits. This is why Professor Ben doesn't just talk about inflation fears but specifically wage rates. Once inflation works its way into wage rates, a self-reinforcing inflation circuit becomes functional. Inflation gets built into expectations and contracts and profits decline.
Two, housing data are not nearly as transparent as stock market data. There is no "real estate exchange" that provides transparent, real-time data. U.S. Census Bureau: New Home Sales data are not particularly useful. For example, if you go to get data on US Median Price of Houses Actually Sold, you get the following.
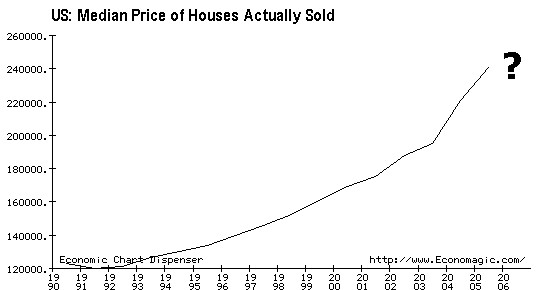
Poor quality housing data
Not very illuminating. The lack of data contributes to investor confusion that causes the stock market to fail to discount much at all. The performance of home builder Toll Brothers (TOL) is a perfect example. The stock price peaked two months after the housing market in August 2005; investors tracked but failed to foresee the future decline in home building orders or the rise in cancellations. Our resident real estate expert Sean O'Toole has a team doing his own data collection and analysis. He's seeing extreme changes in the housing market in northern California. For example, he reported that on Monday that 196 Properties were taken back by banks at foreclosure auction with a total loan value of $77,693,268.04. Here it is in a chart.
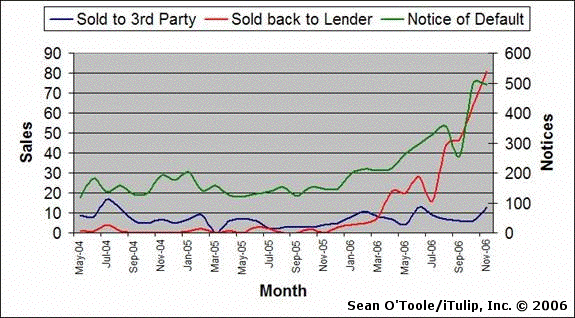
Seventy eight million here, seventy eight million there. This could quickly add up to real money.
Three, as we have mentioned before, a crashing stock market causes stockholders to mark their portfolio to market in the quarter following the crash, leading to an immediate negative wealth effect. In a collapsing housing market, however, home owners only have to confront their loss when they try to extract money from their home, such as when they try to sell it or refinance it. That doesn't happen all at once. A stock market crash is like a cannon ball falling through the bottom of swimming pool. Water immediately rushes out through the hole. The Fed pours money in and the market starts to patch the hole. A collapsing housing bubble is more like a pool that springs 1,000 leaks. Hard to measure how fast water is rushing out. How big are the losses? How much water should the Fed add? When? The Fed likely has housing data that's as poor as the stock market investors'.
Four, as friends on Wall Street explained to me last month and re-enforced in a meeting earlier this week, a combination of a heavy influence of hedge funds on stock prices combines effectively with a natural shared desire to maintain prices until end of year bonuses are in the bank. This last factor, if true, argues for taking any short positions a person plans to take before the end of the year.
To sum up:
___________
For macro-economic and geopolitical currency ETF advisory services see "Crooks on Currencies"
To buy and trade gold easily and inexpensively, see BullionVault
To receive the iTulip Newsletter or iTulip Alerts, Join our FREE Email Mailing List
Copyright © iTulip, Inc. 1998 - 2006 All Rights Reserved
All information provided "as is" for informational purposes only, not intended for trading purposes or advice. Nothing appearing on this website should be considered a recommendation to buy or to sell any security or related financial instrument. iTulip, Inc. is not liable for any informational errors, incompleteness, or delays, or for any actions taken in reliance on information contained herein. Full Disclaimer
Benign inflation. Just what the Professor ordered?
Wall Street Gains on Inflation Data
December 15, 2006 (Tim Paradis – AP)
Wall Street extended its rally Friday after reports showed inflation remained tame in November and industrial production rose for the first time in two months amid increased output by automobile makers. The inflation reading sent bonds sharply higher.
The data underscored a sense in the market that the economy is slowing at a reasonable pace and that inflation, a key concern of the Federal Reserve, was in check. High inflationary readings would likely make the Fed hesitant to lower short-term interest rates.
Wall Street appears to be rallying over benign inflation and a gradually slowing economy, meaning the Street expects a Fed rate cut early next year and no recession. The paradox could not be deeper. I see a rapidly slowing economy with recession in 2007 virtually guaranteed, but inflation pressures remaining.December 15, 2006 (Tim Paradis – AP)
Wall Street extended its rally Friday after reports showed inflation remained tame in November and industrial production rose for the first time in two months amid increased output by automobile makers. The inflation reading sent bonds sharply higher.
The data underscored a sense in the market that the economy is slowing at a reasonable pace and that inflation, a key concern of the Federal Reserve, was in check. High inflationary readings would likely make the Fed hesitant to lower short-term interest rates.
First, a quick look at the inflation picture.

CPI versus median CPI
While Wall Street is cheering the Bureau of Labor Statistics' (BLS) benign November CPI inflation number, before concluding that a Fed rate cut is in the works for early next year, investors need to consider that the Fed may be going by its own less politically convenient statistics, the median CPI. The median CPI is a measure of core inflation calculated by the Federal Reserve Bank of Cleveland based on data released in the BLS's monthly CPI report. Earlier this year, the Median CPI came in below the CPI. But starting in September, as energy prices declined–prices which the BLS discounts from the CPI as "too volatile" when rising, but appears to add back in when energy prices are falling –have over the past few months diverged from the CPI. The Fed sees inflation, just as you and I do when we go to a restaurant or pay a tuition, insurance, or health care bill. The question is, in the face of uncertain fallout from the collapse of the housing bubble, what can the Fed do about it?
That depends on what the Fed sees in the economy. Our position is that the collapsing housing bubble is as likely to lead to recession as driving drunk while talking on a cell phone in rush hour traffic is likely to lead to an accident. In the case of a drop in permits and recessions, causation is hard to prove; there is no breathalyzer test for the housing market, but the correlation is unmistakable. Our analysis shows a high correlation between a steady decline in housing permits to below 25% and recession.

Big drop in housing permits authorized has a high correlation with recession
This chart is a bit busy, so I'll explain. The left hand axis in black shows the actual number of housing permits authorized. The right hand axis in red shows the percent change in the number of permits authorized compared to the same period last year. Note that five of the last six recessions since the late 1960s followed a more than 20% to 35% decline in the number of permits issued compared to the same period the previous year. The only recession that was not associated with such a decline in housing permits was the 2001 recession, which followed the collapse of the technology stock bubble in 2000. No way of saying whether there is one factor that causes both permits to fall and recessions to start, or whether the decline in new building leads to a fall in demand that causes the recession. I say, Who cares? We are approaching a 35% decline in new housing permits since the same period in December 2005. That is the absolute limit below which the U.S. has never failed to experience a recession. Of course there's always a first time, and Wall Street appears to be betting on it.
The stock market is still viewed as a brilliant discounting mechanism, magically pricing in future events six to nine months in advance. Putting aside the obvious evidence that this is false, such as the year 2000 market crash, what is the chance that the markets are failing to discount a housing bust led recession?

Stock markets tend to not price in recessions
A series of charts not shown here but summarized above zero in on these recession periods shown–1970, 1974, 1980, and so on. These show that the S&P declines usually as a recession begins, except in 2001 when the wealth effect of the declining market contributed to the recession that followed–was part of the cause, not the effect. The summary chart above gives you the general idea. Anyone who says you can't have a rising stock market going into a recession needs to examine strong evidence to the contrary.
So if not discounting a recession, why is the stock market at least not showing more caution in light of a housing market bust that has led every recession except one since 1970?
Four reasons. One, early in an inflation cycle firms enjoy–for six to nine months–a perfect world in which they can raise prices but do not have to raise wages. The result, at least for a while, is increasing profits. This is why Professor Ben doesn't just talk about inflation fears but specifically wage rates. Once inflation works its way into wage rates, a self-reinforcing inflation circuit becomes functional. Inflation gets built into expectations and contracts and profits decline.
Two, housing data are not nearly as transparent as stock market data. There is no "real estate exchange" that provides transparent, real-time data. U.S. Census Bureau: New Home Sales data are not particularly useful. For example, if you go to get data on US Median Price of Houses Actually Sold, you get the following.

Poor quality housing data
Not very illuminating. The lack of data contributes to investor confusion that causes the stock market to fail to discount much at all. The performance of home builder Toll Brothers (TOL) is a perfect example. The stock price peaked two months after the housing market in August 2005; investors tracked but failed to foresee the future decline in home building orders or the rise in cancellations. Our resident real estate expert Sean O'Toole has a team doing his own data collection and analysis. He's seeing extreme changes in the housing market in northern California. For example, he reported that on Monday that 196 Properties were taken back by banks at foreclosure auction with a total loan value of $77,693,268.04. Here it is in a chart.

Seventy eight million here, seventy eight million there. This could quickly add up to real money.
Three, as we have mentioned before, a crashing stock market causes stockholders to mark their portfolio to market in the quarter following the crash, leading to an immediate negative wealth effect. In a collapsing housing market, however, home owners only have to confront their loss when they try to extract money from their home, such as when they try to sell it or refinance it. That doesn't happen all at once. A stock market crash is like a cannon ball falling through the bottom of swimming pool. Water immediately rushes out through the hole. The Fed pours money in and the market starts to patch the hole. A collapsing housing bubble is more like a pool that springs 1,000 leaks. Hard to measure how fast water is rushing out. How big are the losses? How much water should the Fed add? When? The Fed likely has housing data that's as poor as the stock market investors'.
Four, as friends on Wall Street explained to me last month and re-enforced in a meeting earlier this week, a combination of a heavy influence of hedge funds on stock prices combines effectively with a natural shared desire to maintain prices until end of year bonuses are in the bank. This last factor, if true, argues for taking any short positions a person plans to take before the end of the year.
To sum up:
- CPI numbers understate inflation, and the Fed likely knows it
- The US economy is on the cusp of rising wage rates which, if allowed to occur, will complete an inflation circuit; Professor Ben has his eye on wage rates and is not likely to cut short term rates when wage rates are rising
- Early stage inflation is creating a short-term profits boom, helping to justify high stock prices
- The housing market is undergoing an extreme correction and this will lead to recession next year
- Making end-of-year bonuses may be a significant factor driving the market
___________
For macro-economic and geopolitical currency ETF advisory services see "Crooks on Currencies"
To buy and trade gold easily and inexpensively, see BullionVault
To receive the iTulip Newsletter or iTulip Alerts, Join our FREE Email Mailing List
Copyright © iTulip, Inc. 1998 - 2006 All Rights Reserved
All information provided "as is" for informational purposes only, not intended for trading purposes or advice. Nothing appearing on this website should be considered a recommendation to buy or to sell any security or related financial instrument. iTulip, Inc. is not liable for any informational errors, incompleteness, or delays, or for any actions taken in reliance on information contained herein. Full Disclaimer
Comment