 |
December 27, 2007 we warned of a major bear market in US stocks coming in 2008. The cause? Debt deflation following a 27 year credit bubble, much as occurred in the US starting in 1930 after the 1920s credit bubble and in Japan since 1990 after a credit bubble in Japan that ended in 1989. We forecast for 2008 a decline similar to the Nikkei in 1990, the first year of Japan’s debt deflation, of around 40%. We called it the Debt Deflation Bear Market. Today in our forecast for 2009 we see the Debt Deflation Bear Market continuing but with a Fiscal Stimulus and Reflation Trade operating within it.
I’m feeling cranky, so this analysis is more cranky than my usual. As regular readers know, my background is in technology and finance, with experience as CEO of high technology companies and in venture capital management. It will not surprise readers to hear that many of my friends have similar backgrounds. You may wonder what they have made of my less than optimistic outlook on the US and global economy over the past several years.
They had the option of hearing my opinions or the professional advice of an army of certified and well meaning financial planners and money managers, the vast majority of whom are trained to sell Wall Street’s main financial product: stocks. Armed with “efficient market hypothesis” that claims that markets are all knowing and asset prices reflect all knowable information, and charts and graphs that “prove” that buy-and-hold is the way to make money in the stock market, they carefully develop for their clients, my friends, portfolios heavy in assorted stock funds and indexes, various flavors of bonds, and perhaps a few commodity ETFs for the adventuresome. The mantra, delivered with the consistency of religious belief, is this: you cannot time the markets.
Entrepreneurs are by nature optimistic, and busy, so they tend to go along with the traditional and rational sounding presentation of the official source for such opinion, a certified financial planner or money manager. Over the years, most of my friends have regarded my warnings about Wall Street and the stock market with skepticism, even amusement. Over the past few months, however, I have received calls and emails from friends I have not heard from in years. The tone is anything but humorous. The typical note goes like this: “I remember what you told me. I wanted to sell last year but my financial planner told me not to, that I can’t time the market. What should I do now?”
Reminding my friends always that I am not a certified financial planner and cannot provide personal investment advice, I proceed to give my views on the markets and economy. Today I update our December 27, 2007 Debt Deflation Bear Market forecast for 2009 by aggregating several of these often tense but always friendly email conversations into a single representative exchange.
Friend's note to me:
Eric,
After hearing you warn us about the stock market for years, we got out when I read your article “Beware Relief Rallies” after the DOW rallied to 9625 after the election. That was it for me! My “puke point” as you once put it. I sold that day. I should have gotten out in 2007, but better late than never. My wife and I are now entirely in Treasury bonds and CDs. We told our financial planner and this is what he said about our decision. Can you comment on it, please? Thanks.
Signed,
Your Friend
Financial Planner’s note to my Friend:After hearing you warn us about the stock market for years, we got out when I read your article “Beware Relief Rallies” after the DOW rallied to 9625 after the election. That was it for me! My “puke point” as you once put it. I sold that day. I should have gotten out in 2007, but better late than never. My wife and I are now entirely in Treasury bonds and CDs. We told our financial planner and this is what he said about our decision. Can you comment on it, please? Thanks.
Signed,
Your Friend
Dear Client,
You are right in that you will not be successful timing the market. You will come out ahead while the market is down but you will lose out to those who stayed in when it goes back up.
As we have discussed in working with older clients and their portfolios, a better approach is to take out enough cash to cover your needs (i.e., the amount of cash you need beyond what you are reasonably sure you will take in from income, bonuses, commissions, etc.) for however long you think it will take for the market to recover.
We estimate that it will take 3-5 years for the market to come back. If you plan to retire and your expenses exceed income by $10,000 per year, we advise you to take $50,000 out of the market to invest in CDs and Treasury bills.
The other thing you can do is use a more conservative balancing formula. For example if you are in your 50s nearing retirement and have been following an approach weighted towards growth equities, you might move to less in growth equities and more in bonds.
The only reason to sell everything and keep only cash (CDs and T-bills) is if you think the world is done growing, that we have all we need and that the minimalist life-style will prevail wholesale for all the time to come that matters to you (i.e., your lifetime). Ok?
Signed,
Your Financial Planner
My response to my Friend regarding his Financial Planner’s advice:You are right in that you will not be successful timing the market. You will come out ahead while the market is down but you will lose out to those who stayed in when it goes back up.
As we have discussed in working with older clients and their portfolios, a better approach is to take out enough cash to cover your needs (i.e., the amount of cash you need beyond what you are reasonably sure you will take in from income, bonuses, commissions, etc.) for however long you think it will take for the market to recover.
We estimate that it will take 3-5 years for the market to come back. If you plan to retire and your expenses exceed income by $10,000 per year, we advise you to take $50,000 out of the market to invest in CDs and Treasury bills.
The other thing you can do is use a more conservative balancing formula. For example if you are in your 50s nearing retirement and have been following an approach weighted towards growth equities, you might move to less in growth equities and more in bonds.
The only reason to sell everything and keep only cash (CDs and T-bills) is if you think the world is done growing, that we have all we need and that the minimalist life-style will prevail wholesale for all the time to come that matters to you (i.e., your lifetime). Ok?
Signed,
Your Financial Planner
Friend,
The idea that markets cannot be timed and that the smart investor buys and holds stocks and never sells is based on two fallacies: one, efficient market hypothesis, and two, that the world does not ever change in significant ways that are bad for stocks for very long periods of time.
As everyone who knows me knows, I got out of the broad stock market in 1998 when the S&P was, believe it or not, higher than it is today in nominal terms. That was ten years ago.
Now add in the cost of inflation. On a CPI inflation-adjusted basis, the market was 48% higher in 1998 than it is today as the purchasing power of the S&P has declined that much since then. This is a sad state of affairs but indisputable by the facts of the matter: any asset that merely kept up with inflation, such as gold, did better than stocks over the past ten years. No secret either that I also got out of the NASDAQ in March 2000 when it was trading around 4,500 (see Boston Globe story from 2002) and got into Treasury bonds in late 2000. Finally, I took a 15% position in gold in 2001 when it was trading at $265 (see Questioning Fashionable Investment Advice, August 2001).
That’s it for me and the stock market. I never got back in and remain in Treasuries and CDs, with, as my friend in London Dr. Peter Warburon put it, a “rump of gold."
No stocks after 2001? That's crazy, said my friends. But to my way of thinking owning stocks since 2001 was crazy. Why?
I expected that after the technology bubble crash the Fed and government was certain via tax cuts, rate cuts, and stealth dollar devaluation a reflation boom like the 1934 - 1937 reflation created after the 1929 stock market bubble bust. Like that reflation the stock market after 2001 was unlikely to produce meaningful inflation-adjusted returns over boring old safe bonds. So why bother? Worse, I knew that the stock market boosted by inflation was not sustainable–I did not expect to be able to time the eventual second collapse.
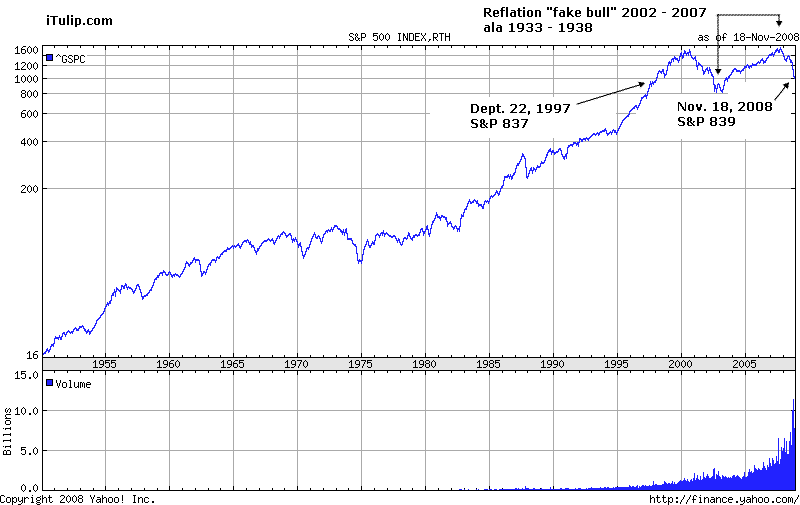
That forecast back in 2001 was complicated by the housing bubble, the most idiotic and irresponsible act of government economic manipulation in world history and completely beyond me to predict. Not even in my darkest dreams did I think our Federal Reserve and banking regulators could be so stupid: bursting real estate bubbles bring down banking systems and economies. They did in the US in the 1870s and 1930s, in Japan since the 1990s, and many other nations as well. The US 2002 to 2006 housing bubble extended the tax cut, rate cut, dollar devaluation reflation boom by two of years longer than the 1930s version sans housing bubble. As you can see, that extension made the collapse we are seeing today considerably more severe.
Now we have a post bubble reflation boom crashing around the fake boom created by the technology stock bubble- two crashes nested one within the other– thus the terrific cascading financial and economic collapse we see today.
We wrote dozens of occasionally over-the-top, but always factual and data driven, warnings on iTulip.com since March 2006 to try to scare readers out of the stock market. As it turns out, we were able to determine and notify subscribers on Dec. 27, 2007 when the DJIA was trading at 13,365 that, if they were for some crazy reason still in the market, that was it: the last chance to get out.
That forecast was informed primarily by two pieces of information.
One, our research told us that US markets were likely to begin in 2008 to experience a bear market that more or less tracked the Nikkei during the first year of the Japanese debt deflation in 1990, off 40%. Here’s the first chart we posted then to mark the starting point of what we called the Debt Deflation Bear Market.
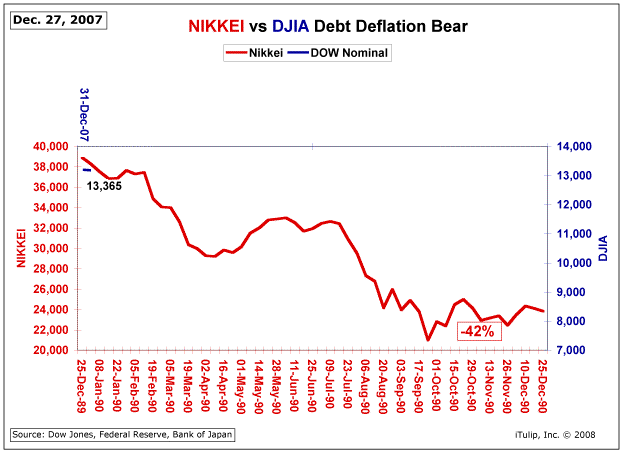
Original chart from Dec. 27, 2007 iTulip Select article notifying subscribers of the start of Debt Deflation Bear Market in 2008 comparable to the Nikkei 40% decline in the first year of the Japanese debt deflation in 1990.
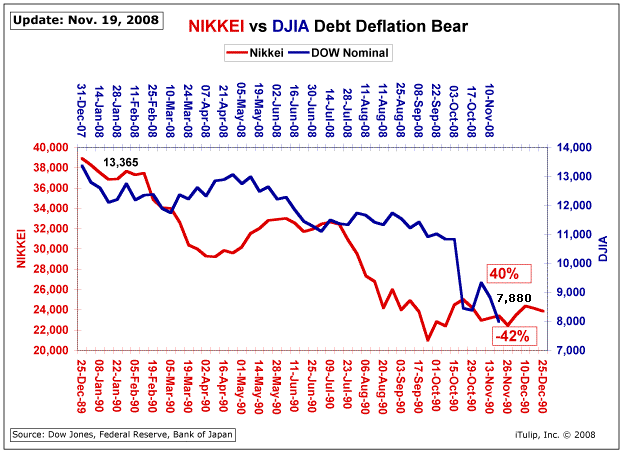
Here is the chart updated as of November 19, 2008.
Yes, we know. “No one has a crystal ball” and “no one can foresee the future of the markets.”
Is that what your financial planner told you?
We hear that all of the time that no one can forecast the markets, certainly not to this degree of accuracy. But this forecast was uncomplicated if you understood the simple underlying dynamic: US households and businesses, and the government itself, had since 1980 built up too much debt. The rate of increase in debt was unsustainable.
The credit bubble began in 1980 after the Fed raised short term interest rates to 19%. The 1975 to 1980 inflation that preceded that drastic action deflated all the debt in the economy, leaving US households and businesses with a clean slate. The “fat spread” between high but falling wholesale borrowing rates paid by banks and more gradual declines in rates paid by retail borrowers made lending very profitable and vastly expanded lending and, with it, increased debt. Once the fat spread effect ran out in the early 1990s, bank reserves rules were changed to extend the credit boom. Once those benefits ran out in the early 2000s, lower lending standards, low interest rates, and financially engineered debt products together enabled by newly deregulated debt markets, extended the credit boom for one final spurt of growth. At its height, the US credit machine was producing five dollars of new debt for every dollar of GDP growth, up from a ratio of one to one in the 1960s.
The entire 27-year old edifice of debt came crashing down starting with the crash of the securitized debt market in Q1 2007. It was game over and 2008 was the first year of the American debt deflation.
All credit bubbles end with a sudden withdrawal of purchasing power from the markets and economy that have become dependent on the massive flows of fresh credit. Debt deflations go on and on until the debt is deflated, one way or another, either by monetary deflation and debt defaults as in the 1930s or by monetary inflation as occurred between 1975 and 1980 in the US. The Japanese have since 1990 deflated debt the slow, hard way, siphoning off cash flow from households and businesses for nearly two decades to pay it all down, and in the process transferring mountains of private debt to the federal government through public spending programs. Our government is hoping to do that, too, except unlike Japan in 1990 our government is deeply in debt to foreign private and official lenders already.
If somehow we manage to pay our debt down the hard way as Japan has over nearly two decades, what was Japan’s reward for toughing it out? The Nikkei is today at 8,273 after reaching 39,000 at the end of 1989, off 80% in nominal terms in 19 years.
The first relevant fact in our Dec. 27, 2007 Debt Deflation Bear Market forecast was that the US is entering a debt deflation and that debt deflation is a bad investment environment for a buy-and-hold strategy.
Two, contacts on Wall Street conveyed in many ways, some subtle and others not, that a last ditch effort was on to run up the market going into the end of the fiscal year in 2007 to collect the last bonuses that the current generation of bankers expected to see before Wall Street went down for the count in 2008. So much for efficient markets. Quite a few are unemployed now. Some of the analysts I know from Lehman landed at Barclays, a few bearish and therefore well-positioned hedge fund managers did well shorting stocks and are still active, and a few old contacts at JP Morgan and Goldman Sachs are still there, but I can’t imagine the industry will ever be the same.
Huge imbalances in the US and global economy developed for over 30 years. Now they are rebalancing, as many non-mainstream economists have warned was certain to happen sooner or later, warnings which were argued as alarmist by mainstream economists. The global monetary system cobbled together in the 1970s after the US unilaterally abandoned Bretton Woods, and the unintended consequences of that -- the inflated purchasing power of the US dollar, buildup of gross external debt to 95% of GDP, and America's gigantic current account deficit -- started to come apart in 2007 following the crash of the securitized debt market, that followed the collapse of the housing bubble. It had to come apart anyway; the securitized bond market happened to be the proximate cause.
For a historical perspective on these events, see the attached charts, five of hundreds that have gone into our analysis.
The first is a measure of the response of the Fed to the recent crisis in the US banking system showing total reserves of the Fed system going back to 1928.
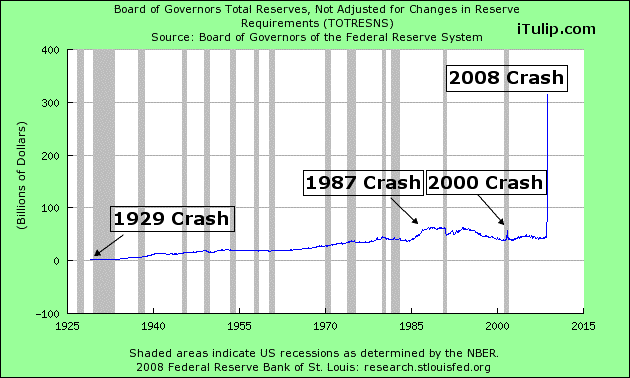
Obviously, a historically unprecedented event has occurred but no one can say what it means long term. Whatever it means, it's not positive for the stock market.
The second chart shows industrial production and duration of unemployment in each of the last eight recessions since 1954.
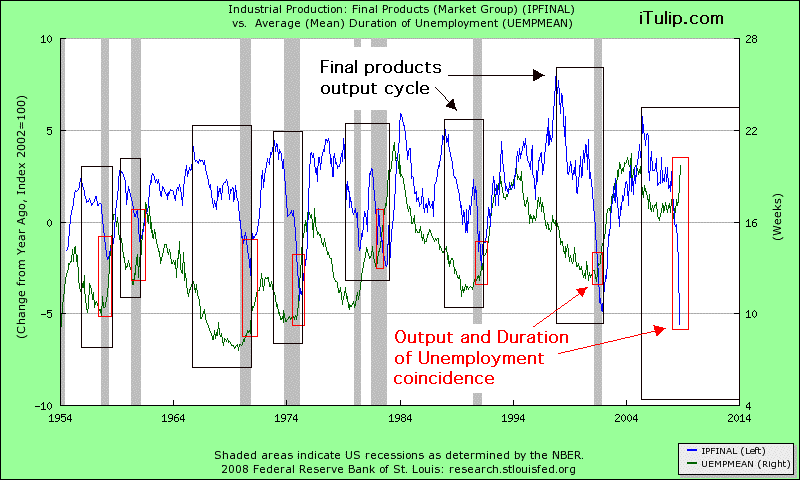
Note that duration of unemployment, a lagging indicator, is only ever briefly rising during a complete economic cycle while industrial production is falling, always during the recession. Not this time. Falling industrial production and unemployment have been coincident for an extended period so far during this recession.
Our interpretation of this is that unemployment will rise precipitously for at least the next year (see Unemployment by industry: Recession or depression?), given data like that shown in chart three below: light truck sales unit volumes are already down to 1983 levels. The reason retail sales are plummeting, as indicated by light truck sales, is that a large portion of the extension of purchasing power to households and business by borrowing was suddenly withdrawn this summer by the credit market crash. That crash came on top of a recession that started in Q4 2007 as we forecast in Oct. 2006.
Why did the credit markets crash? The credit market is best understood as a transactions network. One node or set of nodes crashes, and in the process transmit the information that caused the crash to other nodes. Entire sections of the network crash and become inoperative while others continue to function, which explains why credit continues to flow almost normally in some credit markets that function as more or less autonomous sub-networks. However, eventually the entire network may fail, with only a few isolated sub-networks functioning, and large sections of the US economy will devolve into operating on a cash-only transaction basis as has occurred in other instances of credit market breakdown in other places in the world.
This was, by the way, why I supported the original stinky Paulson emergency bailout plan. Not that I love Paulson or what he represents but after I interviewed Dr. Peter Warburton at the time (See Inside the Whirlpool: Interview with Dr. Peter Warburton $ubscription), who wrote the book on the flawed modern credit system in Debt And Delusion in 1999 and forecast this debacle years before anyone else, I realized that there was a moment when rebooting the first set of crashed credit system network nodes quickly might have prevented a systemic credit network failure. Paulson did not have time to put together an elegant plan or present it well, and Congress gagged and chattered while the network melted down those first few days. Might the $700 billion bailout have worked if immediately applied versus two weeks after proposed? We’ll never know. Now Paulson stands accused of bait and switch, when in fact months ago the time passed when the $700B emergency credit network reboot might have worked. Now he can either return the money and explain “too late” or keep it and try to use it for some other purpose. What would you do?
This mismatch between the speed of the political process and the rate of financial meltdown function was a key feature of the early 1930 credit bubble collapse and response. Experts like Professor Irving Fisher who understood what was going on and what to do were unable to influence Congress in time. He pushed in early 1930 for the US to drop the gold standard and inflate as most other nations were doing. Those countries escaped the worst of the depression. That was finally done in 1933 by FDR, but only after the economy had collapsed. I expect a rerun: Congress will finally do the right thing–find a way to cancel the debt that is choking the economy to death–but only after the economy has virtually collapsed.
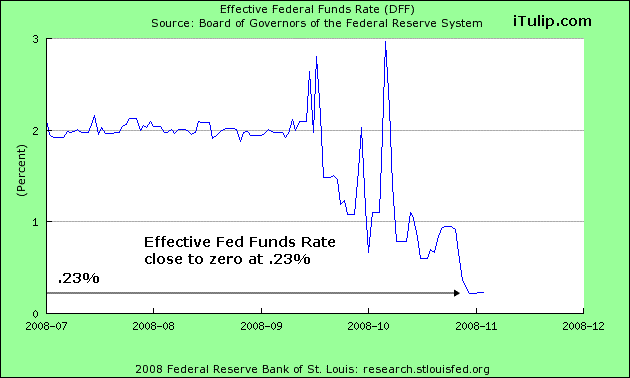
What can the Fed do? Not much on the orthodox reflation front. Chart four shows the effective Fed Funds Rate, for all practical purposes at zero. No more stimulus there. Yesterday Federal Reserve Don Kohn admitted that the Fed was engaged in quantitative easing "and should prepare for the possibility that more extreme measures could be needed to guard against deflation," as reported in the Financial Times. This marks perhaps the fifth or sixth action that the Fed has taken, along with Fed purchases of deflating assets, that our friends in the deflation camp said would never, ever happen. What impact will these measure have on stock prices? I don't know about you but I think I'll wait out the trial and error radical monetary experiments.
Chart five shows major dislocations in TIPS yields and prices. Credit market sea level is not supposed to move this way.
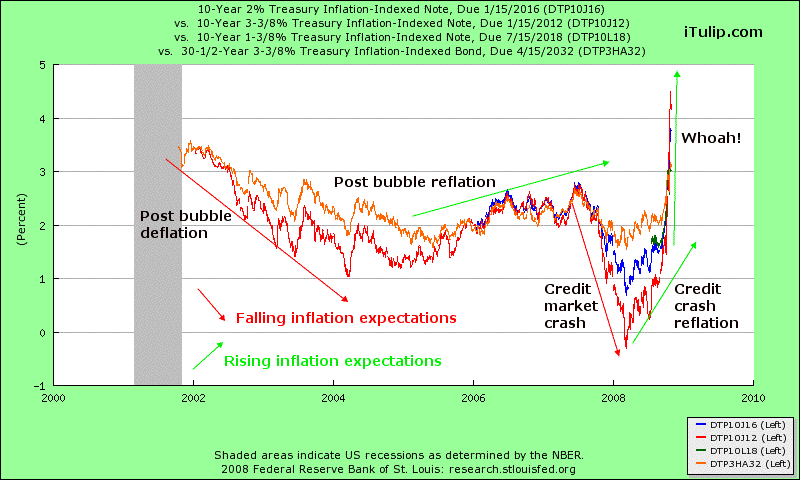
What is the TIPS market saying? Nothing good for the stock market, I can assure you. You can interpret this either as the bond market smelling a repeat of 1930s deflation or late 1970s inflation times two or three. Hoover or FDR? Pick your poison. I expect Hoover then FDR, disinflation then inflation ala late 1970s but more extreme, to deflate the debt.
Everywhere you look you will find anomalies and indications of extraordinary knock-on effects of the global credit crisis, and plenty of evidence of self-reinforcement between real economic activity and asset price deflation, such as the Baltic Dry Goods Index.
Will these market and economic anomalies diminish, the markets recover, and the economy return to normal within the timescale of the 50 or 60 year old buy-and-hold stock investor? Perhaps, but more likely a transformation of the entire structure of the global markets and economy is starting that will take decades to resolve.
In my view, these historic events will next year be complicated by political responses to high unemployment globally, and it is reasonable to expect that some of these responses will not be entirely constructive.
The stock market buy-and-hold era ended in 1998. In a world where the so-called business cycle is dominated by bubbles, inflation, crashes, deflation, recession, and reflations and all manner of government interference, stock market timing, and sector analysis, will continue to be the key to making money. In fact, across the broad stroke of American history, there is never a period when markets are not either largely or entirely influenced by the actions of government. For hundreds of years the US has either been at war, recovering from war, growing asset bubbles, crashing asset bubbles, recovering from asset bubbles, or mucking around with the monetary system–entering the gold standard, leaving the gold standard, entering into a new global monetary regime, leaving that regime– endlessly. How can markets possibly be efficient if they are perpetually driven by large-scale events produced by government policies? The idea is profoundly naive.
On a final note, given what were to me and many others glaringly obvious risks with predictable outcomes for the stock market going back to 1998 when I got out of stocks and started iTulip.com, and the horrific advice that many certified financial planners have given their clients over the years, I wonder if the licensing of financial planners has operated for the last decade as a scheme to portray a unified Wall Street financial products sales force as an independent, disinterested, and expert -- and therefore unquestioned -- collection of investment professionals with only their clients’ best interests at heart. Except for the few renegade licensed financial planners who escape the indoctrination with an ounce of common sense, most doggedly stick to absurd investment theories like “efficient markets” that have no relevance in the real world, follow arbitrary portfolio balancing rules that just happen to favor a large stock market position no matter that a large cash position is warranted by clearly observable risks, and express antagonism toward asset classes such as precious metals that, unfortunately, have a legitimate place in the portfolio of any citizen of a government that has a printing press and knows how to use it, that is, all of them.
The financial mayhem the majority of financially planners have unleashed upon the portfolios of millions of Americans over the past year informs my view that the entire financial planning licensing system should be abandoned and replaced with a simple referral system that qualifies financial planners entirely on performance based metrics, not abstract theory that favors one asset class over another.
No one expects a perfect crystal ball, but going to cash to dodge a 40% correction in 2007 was not rocket science. All you had to do was look at all the debt: there was and is too much of it, and there is no way that the unwinding of all that debt can possibly be good for stocks. That’s just common sense.
Sincerely,
Eric
2008 was an ugly year when Wall Street died and a lot of experts learned that much of what they thought they knew for decades about the stock market and the economy was wrong. The idea that markets cannot be timed and that the smart investor buys and holds stocks and never sells is based on two fallacies: one, efficient market hypothesis, and two, that the world does not ever change in significant ways that are bad for stocks for very long periods of time.
As everyone who knows me knows, I got out of the broad stock market in 1998 when the S&P was, believe it or not, higher than it is today in nominal terms. That was ten years ago.
Now add in the cost of inflation. On a CPI inflation-adjusted basis, the market was 48% higher in 1998 than it is today as the purchasing power of the S&P has declined that much since then. This is a sad state of affairs but indisputable by the facts of the matter: any asset that merely kept up with inflation, such as gold, did better than stocks over the past ten years. No secret either that I also got out of the NASDAQ in March 2000 when it was trading around 4,500 (see Boston Globe story from 2002) and got into Treasury bonds in late 2000. Finally, I took a 15% position in gold in 2001 when it was trading at $265 (see Questioning Fashionable Investment Advice, August 2001).
That’s it for me and the stock market. I never got back in and remain in Treasuries and CDs, with, as my friend in London Dr. Peter Warburon put it, a “rump of gold."
No stocks after 2001? That's crazy, said my friends. But to my way of thinking owning stocks since 2001 was crazy. Why?
I expected that after the technology bubble crash the Fed and government was certain via tax cuts, rate cuts, and stealth dollar devaluation a reflation boom like the 1934 - 1937 reflation created after the 1929 stock market bubble bust. Like that reflation the stock market after 2001 was unlikely to produce meaningful inflation-adjusted returns over boring old safe bonds. So why bother? Worse, I knew that the stock market boosted by inflation was not sustainable–I did not expect to be able to time the eventual second collapse.

That forecast back in 2001 was complicated by the housing bubble, the most idiotic and irresponsible act of government economic manipulation in world history and completely beyond me to predict. Not even in my darkest dreams did I think our Federal Reserve and banking regulators could be so stupid: bursting real estate bubbles bring down banking systems and economies. They did in the US in the 1870s and 1930s, in Japan since the 1990s, and many other nations as well. The US 2002 to 2006 housing bubble extended the tax cut, rate cut, dollar devaluation reflation boom by two of years longer than the 1930s version sans housing bubble. As you can see, that extension made the collapse we are seeing today considerably more severe.
Now we have a post bubble reflation boom crashing around the fake boom created by the technology stock bubble- two crashes nested one within the other– thus the terrific cascading financial and economic collapse we see today.
We wrote dozens of occasionally over-the-top, but always factual and data driven, warnings on iTulip.com since March 2006 to try to scare readers out of the stock market. As it turns out, we were able to determine and notify subscribers on Dec. 27, 2007 when the DJIA was trading at 13,365 that, if they were for some crazy reason still in the market, that was it: the last chance to get out.
That forecast was informed primarily by two pieces of information.
One, our research told us that US markets were likely to begin in 2008 to experience a bear market that more or less tracked the Nikkei during the first year of the Japanese debt deflation in 1990, off 40%. Here’s the first chart we posted then to mark the starting point of what we called the Debt Deflation Bear Market.

Original chart from Dec. 27, 2007 iTulip Select article notifying subscribers of the start of Debt Deflation Bear Market in 2008 comparable to the Nikkei 40% decline in the first year of the Japanese debt deflation in 1990.
Here is the chart updated as of November 19, 2008.

Debt Deflation Bear Market update as of Nov. 19, 2008
Yes, we know. “No one has a crystal ball” and “no one can foresee the future of the markets.”
Is that what your financial planner told you?
We hear that all of the time that no one can forecast the markets, certainly not to this degree of accuracy. But this forecast was uncomplicated if you understood the simple underlying dynamic: US households and businesses, and the government itself, had since 1980 built up too much debt. The rate of increase in debt was unsustainable.
The credit bubble began in 1980 after the Fed raised short term interest rates to 19%. The 1975 to 1980 inflation that preceded that drastic action deflated all the debt in the economy, leaving US households and businesses with a clean slate. The “fat spread” between high but falling wholesale borrowing rates paid by banks and more gradual declines in rates paid by retail borrowers made lending very profitable and vastly expanded lending and, with it, increased debt. Once the fat spread effect ran out in the early 1990s, bank reserves rules were changed to extend the credit boom. Once those benefits ran out in the early 2000s, lower lending standards, low interest rates, and financially engineered debt products together enabled by newly deregulated debt markets, extended the credit boom for one final spurt of growth. At its height, the US credit machine was producing five dollars of new debt for every dollar of GDP growth, up from a ratio of one to one in the 1960s.
The entire 27-year old edifice of debt came crashing down starting with the crash of the securitized debt market in Q1 2007. It was game over and 2008 was the first year of the American debt deflation.
All credit bubbles end with a sudden withdrawal of purchasing power from the markets and economy that have become dependent on the massive flows of fresh credit. Debt deflations go on and on until the debt is deflated, one way or another, either by monetary deflation and debt defaults as in the 1930s or by monetary inflation as occurred between 1975 and 1980 in the US. The Japanese have since 1990 deflated debt the slow, hard way, siphoning off cash flow from households and businesses for nearly two decades to pay it all down, and in the process transferring mountains of private debt to the federal government through public spending programs. Our government is hoping to do that, too, except unlike Japan in 1990 our government is deeply in debt to foreign private and official lenders already.
If somehow we manage to pay our debt down the hard way as Japan has over nearly two decades, what was Japan’s reward for toughing it out? The Nikkei is today at 8,273 after reaching 39,000 at the end of 1989, off 80% in nominal terms in 19 years.
The first relevant fact in our Dec. 27, 2007 Debt Deflation Bear Market forecast was that the US is entering a debt deflation and that debt deflation is a bad investment environment for a buy-and-hold strategy.
Two, contacts on Wall Street conveyed in many ways, some subtle and others not, that a last ditch effort was on to run up the market going into the end of the fiscal year in 2007 to collect the last bonuses that the current generation of bankers expected to see before Wall Street went down for the count in 2008. So much for efficient markets. Quite a few are unemployed now. Some of the analysts I know from Lehman landed at Barclays, a few bearish and therefore well-positioned hedge fund managers did well shorting stocks and are still active, and a few old contacts at JP Morgan and Goldman Sachs are still there, but I can’t imagine the industry will ever be the same.
Huge imbalances in the US and global economy developed for over 30 years. Now they are rebalancing, as many non-mainstream economists have warned was certain to happen sooner or later, warnings which were argued as alarmist by mainstream economists. The global monetary system cobbled together in the 1970s after the US unilaterally abandoned Bretton Woods, and the unintended consequences of that -- the inflated purchasing power of the US dollar, buildup of gross external debt to 95% of GDP, and America's gigantic current account deficit -- started to come apart in 2007 following the crash of the securitized debt market, that followed the collapse of the housing bubble. It had to come apart anyway; the securitized bond market happened to be the proximate cause.
For a historical perspective on these events, see the attached charts, five of hundreds that have gone into our analysis.
The first is a measure of the response of the Fed to the recent crisis in the US banking system showing total reserves of the Fed system going back to 1928.

Obviously, a historically unprecedented event has occurred but no one can say what it means long term. Whatever it means, it's not positive for the stock market.
The second chart shows industrial production and duration of unemployment in each of the last eight recessions since 1954.

Note that duration of unemployment, a lagging indicator, is only ever briefly rising during a complete economic cycle while industrial production is falling, always during the recession. Not this time. Falling industrial production and unemployment have been coincident for an extended period so far during this recession.
Our interpretation of this is that unemployment will rise precipitously for at least the next year (see Unemployment by industry: Recession or depression?), given data like that shown in chart three below: light truck sales unit volumes are already down to 1983 levels. The reason retail sales are plummeting, as indicated by light truck sales, is that a large portion of the extension of purchasing power to households and business by borrowing was suddenly withdrawn this summer by the credit market crash. That crash came on top of a recession that started in Q4 2007 as we forecast in Oct. 2006.
Why did the credit markets crash? The credit market is best understood as a transactions network. One node or set of nodes crashes, and in the process transmit the information that caused the crash to other nodes. Entire sections of the network crash and become inoperative while others continue to function, which explains why credit continues to flow almost normally in some credit markets that function as more or less autonomous sub-networks. However, eventually the entire network may fail, with only a few isolated sub-networks functioning, and large sections of the US economy will devolve into operating on a cash-only transaction basis as has occurred in other instances of credit market breakdown in other places in the world.
This was, by the way, why I supported the original stinky Paulson emergency bailout plan. Not that I love Paulson or what he represents but after I interviewed Dr. Peter Warburton at the time (See Inside the Whirlpool: Interview with Dr. Peter Warburton $ubscription), who wrote the book on the flawed modern credit system in Debt And Delusion
 in 1999 and forecast this debacle years before anyone else, I realized that there was a moment when rebooting the first set of crashed credit system network nodes quickly might have prevented a systemic credit network failure. Paulson did not have time to put together an elegant plan or present it well, and Congress gagged and chattered while the network melted down those first few days. Might the $700 billion bailout have worked if immediately applied versus two weeks after proposed? We’ll never know. Now Paulson stands accused of bait and switch, when in fact months ago the time passed when the $700B emergency credit network reboot might have worked. Now he can either return the money and explain “too late” or keep it and try to use it for some other purpose. What would you do?
This mismatch between the speed of the political process and the rate of financial meltdown function was a key feature of the early 1930 credit bubble collapse and response. Experts like Professor Irving Fisher who understood what was going on and what to do were unable to influence Congress in time. He pushed in early 1930 for the US to drop the gold standard and inflate as most other nations were doing. Those countries escaped the worst of the depression. That was finally done in 1933 by FDR, but only after the economy had collapsed. I expect a rerun: Congress will finally do the right thing–find a way to cancel the debt that is choking the economy to death–but only after the economy has virtually collapsed.

What can the Fed do? Not much on the orthodox reflation front. Chart four shows the effective Fed Funds Rate, for all practical purposes at zero. No more stimulus there. Yesterday Federal Reserve Don Kohn admitted that the Fed was engaged in quantitative easing "and should prepare for the possibility that more extreme measures could be needed to guard against deflation," as reported in the Financial Times. This marks perhaps the fifth or sixth action that the Fed has taken, along with Fed purchases of deflating assets, that our friends in the deflation camp said would never, ever happen. What impact will these measure have on stock prices? I don't know about you but I think I'll wait out the trial and error radical monetary experiments.
Chart five shows major dislocations in TIPS yields and prices. Credit market sea level is not supposed to move this way.

What is the TIPS market saying? Nothing good for the stock market, I can assure you. You can interpret this either as the bond market smelling a repeat of 1930s deflation or late 1970s inflation times two or three. Hoover or FDR? Pick your poison. I expect Hoover then FDR, disinflation then inflation ala late 1970s but more extreme, to deflate the debt.
Everywhere you look you will find anomalies and indications of extraordinary knock-on effects of the global credit crisis, and plenty of evidence of self-reinforcement between real economic activity and asset price deflation, such as the Baltic Dry Goods Index.
Will these market and economic anomalies diminish, the markets recover, and the economy return to normal within the timescale of the 50 or 60 year old buy-and-hold stock investor? Perhaps, but more likely a transformation of the entire structure of the global markets and economy is starting that will take decades to resolve.
In my view, these historic events will next year be complicated by political responses to high unemployment globally, and it is reasonable to expect that some of these responses will not be entirely constructive.
The stock market buy-and-hold era ended in 1998. In a world where the so-called business cycle is dominated by bubbles, inflation, crashes, deflation, recession, and reflations and all manner of government interference, stock market timing, and sector analysis, will continue to be the key to making money. In fact, across the broad stroke of American history, there is never a period when markets are not either largely or entirely influenced by the actions of government. For hundreds of years the US has either been at war, recovering from war, growing asset bubbles, crashing asset bubbles, recovering from asset bubbles, or mucking around with the monetary system–entering the gold standard, leaving the gold standard, entering into a new global monetary regime, leaving that regime– endlessly. How can markets possibly be efficient if they are perpetually driven by large-scale events produced by government policies? The idea is profoundly naive.
On a final note, given what were to me and many others glaringly obvious risks with predictable outcomes for the stock market going back to 1998 when I got out of stocks and started iTulip.com, and the horrific advice that many certified financial planners have given their clients over the years, I wonder if the licensing of financial planners has operated for the last decade as a scheme to portray a unified Wall Street financial products sales force as an independent, disinterested, and expert -- and therefore unquestioned -- collection of investment professionals with only their clients’ best interests at heart. Except for the few renegade licensed financial planners who escape the indoctrination with an ounce of common sense, most doggedly stick to absurd investment theories like “efficient markets” that have no relevance in the real world, follow arbitrary portfolio balancing rules that just happen to favor a large stock market position no matter that a large cash position is warranted by clearly observable risks, and express antagonism toward asset classes such as precious metals that, unfortunately, have a legitimate place in the portfolio of any citizen of a government that has a printing press and knows how to use it, that is, all of them.
The financial mayhem the majority of financially planners have unleashed upon the portfolios of millions of Americans over the past year informs my view that the entire financial planning licensing system should be abandoned and replaced with a simple referral system that qualifies financial planners entirely on performance based metrics, not abstract theory that favors one asset class over another.
No one expects a perfect crystal ball, but going to cash to dodge a 40% correction in 2007 was not rocket science. All you had to do was look at all the debt: there was and is too much of it, and there is no way that the unwinding of all that debt can possibly be good for stocks. That’s just common sense.
Sincerely,
Eric
That was 2008. Time to look ahead to 2009.
Note: Starting Dec. 1, 2008 the annual iTulip Select subscription rate for individuals will increase from $100 to $250 and for institutions to $1,000. Subscribe to iTulip Select here.
Debt Deflation Bear Market Update Part II: 2009 Pitch ($ubscriber)
Last year we warned you of the start of the Debt Deflation Bear Market. It will continue in 2009 but with rallies driven by cycles of fiscal stimulus optimism and disappointment, fear of deflation and fear of inflation. For the next several years, economies and therefore markets will be largely driven by ebbs and flows of sentiment driven by government spending or expectations of government spending, as well as fears of unintended or intended consequences–inflation. Political confusion expressed as policy paralysis over the cause and cure for the root of the problem–the credit bubble debt overhang–will dominate the markets this coming year.
To get a broader sense of the dynamics we face, we take readers back to our Real DJIA analysis and chart from March 2006. The Real DOW forecast predicted three potential reversions to the mean outcomes for the inflated DOW. The original chart from then is immediately below.
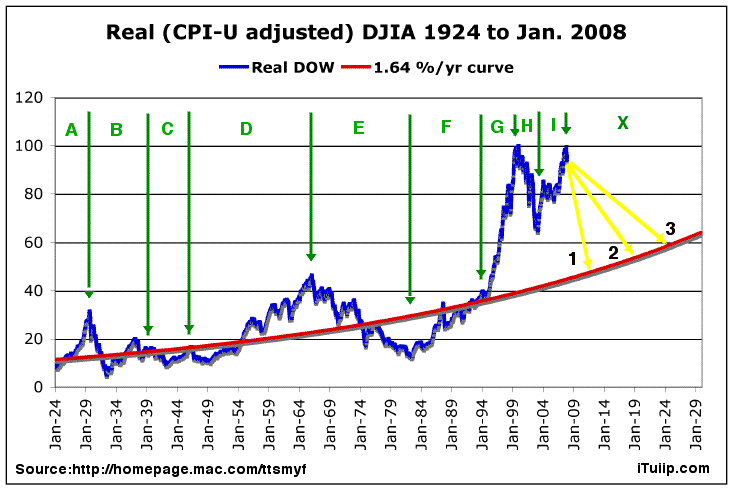
Chart above shows iTulip reversion to the inflation-adjusted mean forecasts (yellow lines) March 2006
1. Worst cast
2. Moderate case
3. Best cast
Two and a half years later, the DOW has taken a path even more steep than #1, our previous worse case scenario. The actual decline has been a more severe and sudden reversal than any of the three projected, a worse, worst case 0. That implies another 40% decline in the Real DOW by the end of 2009, nominally to 5000, the level I forecast in 2006, such as in this interview.
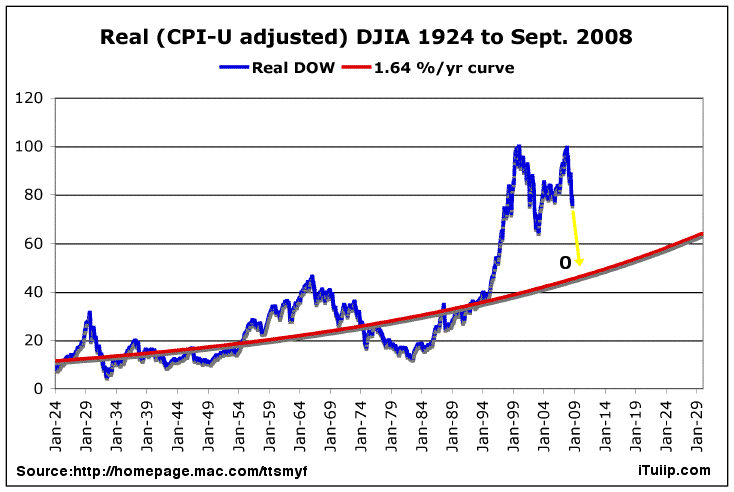
The Real DOW forecast also defined nine periods A thru I starting in 1924 including a future period that we at the time called “Period X” but can now say with more certainty is the end of the FIRE Economy and the start of the Transitional Economy that will lead us to the New American Economy, all over the next ten to twenty years. President Obama will preside over the Transitional Economy, and depending on how he and his team fare at that impossible task, may see the nation into the New American Economy in a second term. More... $ubscribers
__________________________________________________
To receive the iTulip Newsletter or iTulip Alerts, Join our FREE Email Mailing List
Copyright © iTulip, Inc. 1998 - 2007 All Rights Reserved
All information provided "as is" for informational purposes only, not intended for trading purposes or advice. Nothing appearing on this website should be considered a recommendation to buy or to sell any security or related financial instrument. iTulip, Inc. is not liable for any informational errors, incompleteness, or delays, or for any actions taken in reliance on information contained herein. Full Disclaimer
 )
)
Comment