Dow 12,000: Not a bubble, but not healthy growth, either
by Eric Janszen - October 19, 2006
We are not in a bubble market like the one we were in that ended Q1 2000. We are in a dead cat bounce of that bubble, the largest market bubble in history. This dead cat bounce is a different animal, if you'll excuse the pun.

Markets perceived the end of deflation and growth in industrial production
1933 - 1937 as indicators that the worst was over...

Besides the apparent fundamental drivers 1930s reflation policies produced, the rally was also driven by sentiment that was a mix of optimism and nostalgia. But the looming threat of war killed it.
Today we have multiple bubbles that are the unintended consequence of reflation efforts to counter the collapse of the 1990s stock market bubble. These bubbles have resulted from complex processes set in motion by liquidity injections and deficit spending starting in 2001, leading to a rapid acceleration in three previously modest trends. We also appear to have looming threats which, as in 1937, are not priced into the markets.
The first and most important of these trends from a macro-economic standpoint was already more than 30 years old–US dependence on borrowing of foreign savings to maintain US living standards by keeping taxes and interest rates low, and real import prices low. The second two of the three trends started during the previous 1995 to 2000 bubble period, but were not its focus. These were also accelerated by reflation efforts, leading to the rise of the USIP out of the hedge fund industry and the formation of housing bubble out of the 1996 to 2000 housing boom.
A similar dead cat bounce also happened in 1981, six months after the collapse of the 1977 - 1980 gold bubble, as inflation made a surprise come-back in 1981 and it appeared to hopeful gold investors that the Fed might not have the political will to keep up the fight. Since then, the price of gold has been more an indicator of perceived financial system risk than inflation risk, as shown in the chart below.

This chart, along with Ka-Poom™, form the basis of a larger work that I've embarked on. Each period, A1 to A2, B1 to B2, and so on, are explained. What matters going forward is Period X™.
No such bounce happened in Japan after the crash in 1990. They blew it. They caved in to US demands to allow the yen to appreciate, in theory–US policy makers'–to help ease the US trade deficit with Japan. Not only didn't it work, it set Japan's more than decade long deflationary cycle in motion. Today, the Chinese are not falling for the "too much savings" and "too strong a currency" trick.
Unlike Japan, China does not depend on the US as their "Cousin Vinny" to protect them militarily from potential aggressors, such as North Korea. If you want to know why Condi Rice is out pounding the table in Japan right now, reminding the Japanese of the US commitment to defend Japan, it's more about securing continued protection payments from Japan in the form of purchases of US debt than about limiting nuclear proliferation in the face of North Korean tests. For the hawks in Japan, the nuke tests are a boon. After all, Japan is a highly technologically advanced nation. Why should Japan suffer the triple costs of protection payments to the US, loss of potential export income from lucrative weapons trade, and the continued humiliation of being perceived by the rest of Asia as a US puppet? The timing of the nuclear test from North Korea–China's creation and from which it receives most of its financial and military support–is a potential signal that China intends to start slowing their purchases of US debt, as they diversify currency reserves in line with their reduction in dependence on the US for export demand, while other countries do likewise. The former point is informed speculation, but if you are a North American and doubt me on the latter point, I recommend you hit the road and travel to Europe, Latin America, Canada, and other areas of the world. The "Made in PRC" phenomenon is not only limited to your local Walmart or Home Depot.
This kind of secondary dead cat bounce as we are now seeing in US markets ends when an event occurs that informs market participants of what they already suspect, that the cyclical rally within the secular bear market I believe started in April 2000 has no substance, that underlying conditions for sustainable economic growth are deteriorating. In the current instance, that corporate profits and the stock markets are being driven largely by liquidity and credit and by the exit of high net worth investors from more risky hedge fund investments; that if the iron lung of fiscal stimulus funded by foreign borrowing is removed the US economy may stop breathing; that the Chinese are not going to cave in and allow the yuan to appreciate; and that the US might be forced to leave Iraq without a clear victory, and all that such an event implies.
Even though the official sentiment indicators show all time highs of optimism, you can smell the fear. Everyone seems to be waiting for something to happen. Eventually, something will. I am reminded of the following from the top of the 1920s stock market bubble.
For ideas about what to do, order our book americasbubbleeconomy
To receive the iTulip Newsletter or iTulip Alerts, Join our FREE Email Mailing List
Copyright © iTulip, Inc. 1998 - 2006 All Rights Reserved
All information provided "as is" for informational purposes only, not intended for trading purposes or advice. Nothing appearing on this website should be considered a recommendation to buy or to sell any security or related financial instrument. iTulip, Inc. is not liable for any informational errors, incompleteness, or delays, or for any actions taken in reliance on information contained herein. Full Disclaimer
by Eric Janszen - October 19, 2006
We are not in a bubble market like the one we were in that ended Q1 2000. We are in a dead cat bounce of that bubble, the largest market bubble in history. This dead cat bounce is a different animal, if you'll excuse the pun.
After 12,000, Dow Average May Have to Wait for More Milestones
October 19, 2006 (Bloomberg)
Further milestones may prove elusive for the Dow Jones Industrial Average, which surpassed 12,000 for the first time just two weeks after reaching a record high.
The Dow's rally started as U.S. interest rates fell to their lowest levels since 1958, and was sustained by a stretch of 10 percent-plus earnings growth that may become the longest in five decades.
Now the Federal Reserve's benchmark lending rate stands at 5.25 percent, up from 1 percent in June 2004, and analysts are predicting smaller profit increases. Third-quarter earnings at General Electric Co., the world's second-largest company by stock-market value, and revenue at JPMorgan Chase & Co., the third-biggest U.S. bank, trailed some estimates.
"We've had kind of a nirvana,'' said Russ Koesterich, a portfolio manager at Barclays Global Investors in San Francisco, which has $1.6 trillion in assets. "For that to maintain itself, we'd almost have to say, 'look, this is going to be the best of all possible worlds, indefinitely.'"
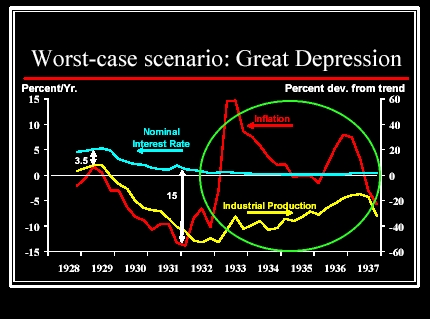
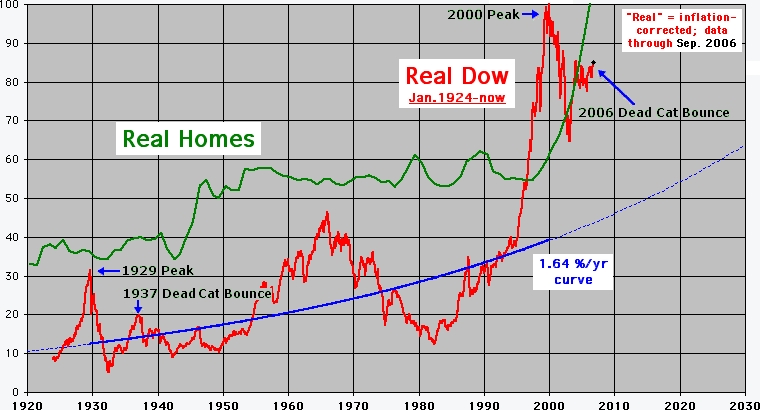
This bounce has more in common with the US market bounce in 1937 that was fueled by the sudden surge of inflation and liquidity produced by the Fed starting in 1933, and the temporary increase in industrial production that followed, as you can see in the charts below.October 19, 2006 (Bloomberg)
Further milestones may prove elusive for the Dow Jones Industrial Average, which surpassed 12,000 for the first time just two weeks after reaching a record high.
The Dow's rally started as U.S. interest rates fell to their lowest levels since 1958, and was sustained by a stretch of 10 percent-plus earnings growth that may become the longest in five decades.
Now the Federal Reserve's benchmark lending rate stands at 5.25 percent, up from 1 percent in June 2004, and analysts are predicting smaller profit increases. Third-quarter earnings at General Electric Co., the world's second-largest company by stock-market value, and revenue at JPMorgan Chase & Co., the third-biggest U.S. bank, trailed some estimates.
"We've had kind of a nirvana,'' said Russ Koesterich, a portfolio manager at Barclays Global Investors in San Francisco, which has $1.6 trillion in assets. "For that to maintain itself, we'd almost have to say, 'look, this is going to be the best of all possible worlds, indefinitely.'"

Markets perceived the end of deflation and growth in industrial production
1933 - 1937 as indicators that the worst was over...

...and the Dow re-traced approximately 80% of its previous 1929 bubble peak
in real terms in 1937, much as has ocurred recently.
in real terms in 1937, much as has ocurred recently.
Besides the apparent fundamental drivers 1930s reflation policies produced, the rally was also driven by sentiment that was a mix of optimism and nostalgia. But the looming threat of war killed it.
Today we have multiple bubbles that are the unintended consequence of reflation efforts to counter the collapse of the 1990s stock market bubble. These bubbles have resulted from complex processes set in motion by liquidity injections and deficit spending starting in 2001, leading to a rapid acceleration in three previously modest trends. We also appear to have looming threats which, as in 1937, are not priced into the markets.
The first and most important of these trends from a macro-economic standpoint was already more than 30 years old–US dependence on borrowing of foreign savings to maintain US living standards by keeping taxes and interest rates low, and real import prices low. The second two of the three trends started during the previous 1995 to 2000 bubble period, but were not its focus. These were also accelerated by reflation efforts, leading to the rise of the USIP out of the hedge fund industry and the formation of housing bubble out of the 1996 to 2000 housing boom.
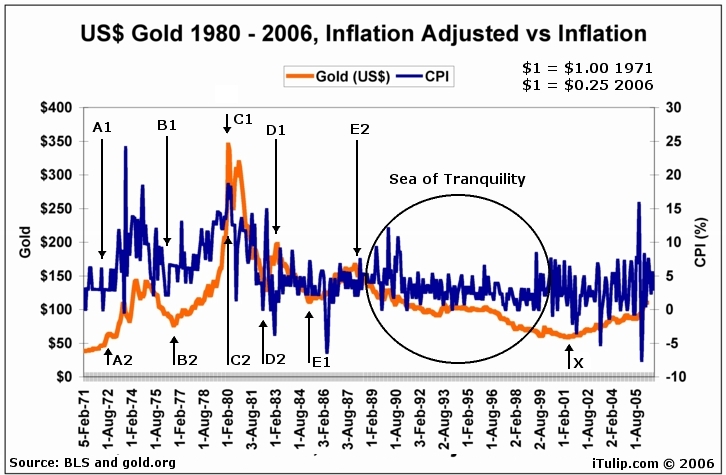
A similar dead cat bounce also happened in 1981, six months after the collapse of the 1977 - 1980 gold bubble, as inflation made a surprise come-back in 1981 and it appeared to hopeful gold investors that the Fed might not have the political will to keep up the fight. Since then, the price of gold has been more an indicator of perceived financial system risk than inflation risk, as shown in the chart below.

This chart, along with Ka-Poom™, form the basis of a larger work that I've embarked on. Each period, A1 to A2, B1 to B2, and so on, are explained. What matters going forward is Period X™.
No such bounce happened in Japan after the crash in 1990. They blew it. They caved in to US demands to allow the yen to appreciate, in theory–US policy makers'–to help ease the US trade deficit with Japan. Not only didn't it work, it set Japan's more than decade long deflationary cycle in motion. Today, the Chinese are not falling for the "too much savings" and "too strong a currency" trick.
Unlike Japan, China does not depend on the US as their "Cousin Vinny" to protect them militarily from potential aggressors, such as North Korea. If you want to know why Condi Rice is out pounding the table in Japan right now, reminding the Japanese of the US commitment to defend Japan, it's more about securing continued protection payments from Japan in the form of purchases of US debt than about limiting nuclear proliferation in the face of North Korean tests. For the hawks in Japan, the nuke tests are a boon. After all, Japan is a highly technologically advanced nation. Why should Japan suffer the triple costs of protection payments to the US, loss of potential export income from lucrative weapons trade, and the continued humiliation of being perceived by the rest of Asia as a US puppet? The timing of the nuclear test from North Korea–China's creation and from which it receives most of its financial and military support–is a potential signal that China intends to start slowing their purchases of US debt, as they diversify currency reserves in line with their reduction in dependence on the US for export demand, while other countries do likewise. The former point is informed speculation, but if you are a North American and doubt me on the latter point, I recommend you hit the road and travel to Europe, Latin America, Canada, and other areas of the world. The "Made in PRC" phenomenon is not only limited to your local Walmart or Home Depot.
This kind of secondary dead cat bounce as we are now seeing in US markets ends when an event occurs that informs market participants of what they already suspect, that the cyclical rally within the secular bear market I believe started in April 2000 has no substance, that underlying conditions for sustainable economic growth are deteriorating. In the current instance, that corporate profits and the stock markets are being driven largely by liquidity and credit and by the exit of high net worth investors from more risky hedge fund investments; that if the iron lung of fiscal stimulus funded by foreign borrowing is removed the US economy may stop breathing; that the Chinese are not going to cave in and allow the yuan to appreciate; and that the US might be forced to leave Iraq without a clear victory, and all that such an event implies.
Even though the official sentiment indicators show all time highs of optimism, you can smell the fear. Everyone seems to be waiting for something to happen. Eventually, something will. I am reminded of the following from the top of the 1920s stock market bubble.
"As the Fall begins there is a tenseness in Wall Street. Its presence is undeniable. There is a general feeling that something is going to happen during the present season. Just what it will be, when it will happen or what will cause it is anybody's guess."
Business Week, Sept. 7, 1929 (Four days after the final top)
________Business Week, Sept. 7, 1929 (Four days after the final top)
For ideas about what to do, order our book americasbubbleeconomy
To receive the iTulip Newsletter or iTulip Alerts, Join our FREE Email Mailing List
Copyright © iTulip, Inc. 1998 - 2006 All Rights Reserved
All information provided "as is" for informational purposes only, not intended for trading purposes or advice. Nothing appearing on this website should be considered a recommendation to buy or to sell any security or related financial instrument. iTulip, Inc. is not liable for any informational errors, incompleteness, or delays, or for any actions taken in reliance on information contained herein. Full Disclaimer

Comment