 |
As we explained years ago, the Fed has a bottomless bag of tricks to use to fight deflation. When deflation inevitably threatens, the Fed planned to continuously change the rules of the game to fight it, and so they have.
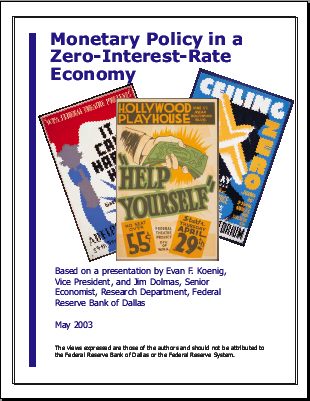
You did not need genius of foresight to make this call. All you needed was a browser and Adobe Acrobat on your PC, and a strong stomach to read the Fed's deflation play book (pdf) published by the Fed in 2003.
It was not the only such publication that the Fed issued to try to jawbone inflation expectations up back then, before explicitly carrying out the policy ideas the play book lays out. All of the several dozen papers issued either by the Fed or by the man who now heads it, Ben Bernanke – some as many as 25 years previous – have a common theme: do not, under any circumstances, allow your economy to fall into a liquidity trap. Avoid the zero bound of inflation and interest rates as if the nation's economic life depends on it – because it does.
Printing money is front and center in all of the anti-deflation policy recommendations in these policy papers issued in accordance with economic policy group-think that is soon to be relegated to the ash heap of history; the economic orthodoxy of any era is a reflection of the political interests of those in charge.
And here we are, facing down deflation and printing money like there's no tomorrow, because if the Fed does not – or so the Fed believes – there won't be.
Print, Ben, print!
Banks borrowed $368 billion per day last week, up from $188 billion per day the week before.
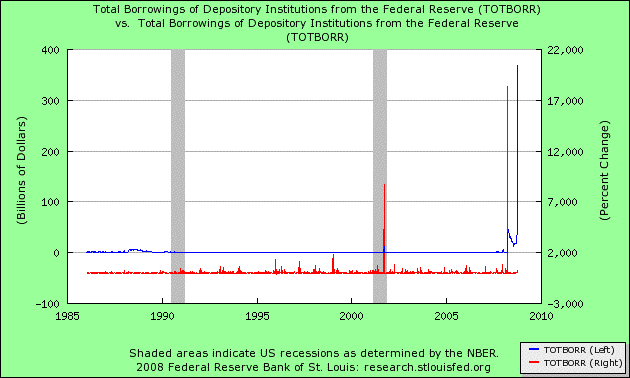
One question we get frequently is: Where the heck is all of this money going?
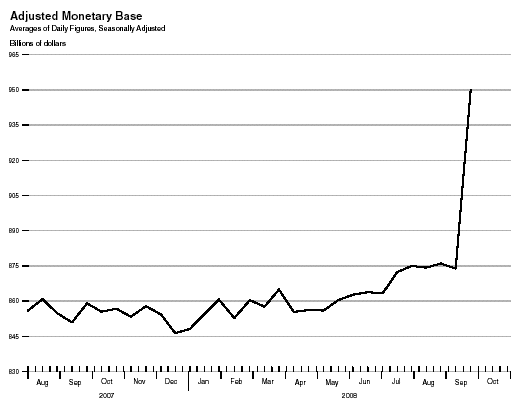
As we forecast February this year, the Fed stopped targeting the price of money but instead the quantity of money in Q2 2008. Since then the money supply has increased more than at any time since the anti-deflation era of 2001.
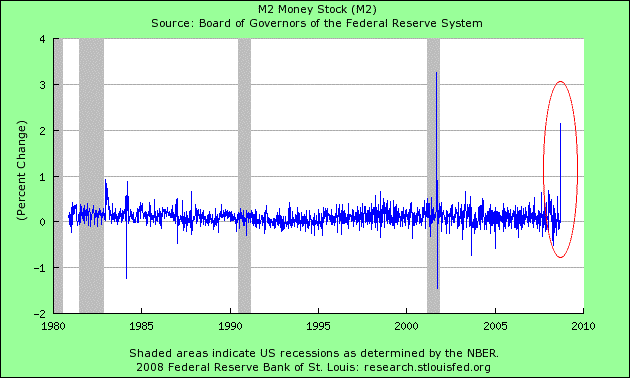
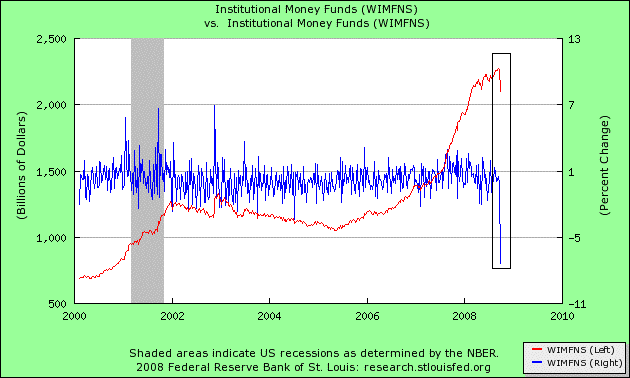
The chart above understates the total growth in money aggregates because most of the growth is in commercial banks, although not institutional money market accounts. Growth in money aggregates there is no longer reported by the Fed as they were in M3 which the Fed discontinued in 2006.
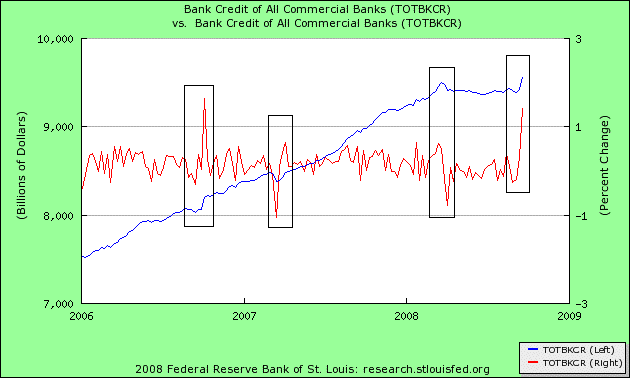
Evidence is that at least some of this money is expanding the credit of commercial banks but you can see from the expansion of bank credit that some of those hundreds of billions are working their way into the banks.
Less successful is the effort to expand institutional money market accounts.
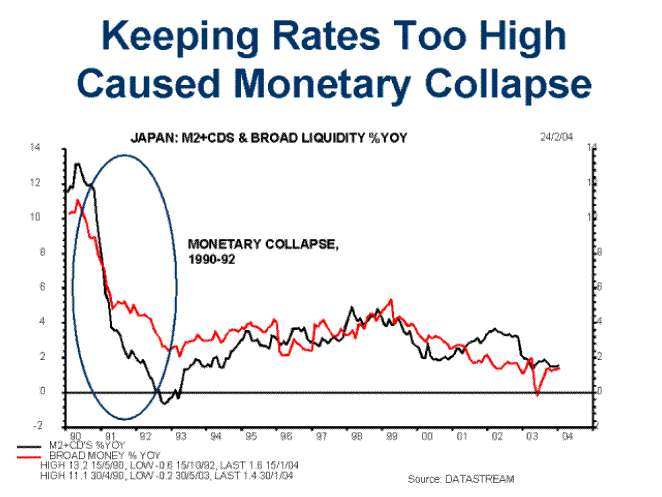
If you are curious to know what actual deflation, as opposed to disinflation, looks like, it looks like this. Note the declines in M2 plus CDs and broad liquidity in Japan in the first two years of Japan's debt deflation, from 1990 to 1993.
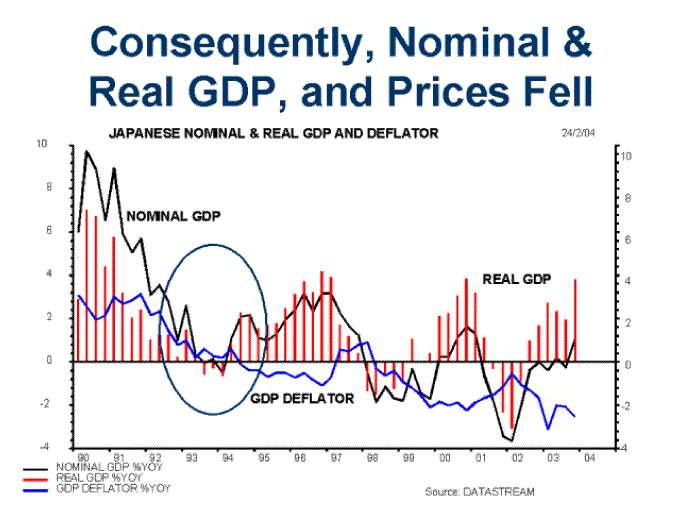
Keep that up for a few years and deflation results. After several years of declines in broad money, deflation appeared in 1993.
In contrast we offer further evidence that the Fed is succeeding in its targeting of money aggregates. We call this chart from the Fed's recent data release on the monetary base: "Showing the Bank of Japan how it's done."
(Hat tip to iTulip's Lukester)
Further reading of the Fed literature tells us that the current period of disinflation, should it continue to develop into actual deflation, will be attacked by the "foolproof means" as Bernanke wrote back in the early 2000s: currency depreciation:
Even if the nominal interest rate is zero, a depreciation of the currency provides a powerful way to stimulate the economy out of the liquidity trap (for instance, Bernanke (2000); McCallum (2000); Meltzer (2001); Orphanides and Wieland (2000)). A currency depreciation will stimulate an economy directly by giving a boost to export and import-competing sectors. More importantly, as noted in Svensson (2001), a currency depreciation and a peg of the currency rate at a depreciated rate serves as a conspicuous commitment to a higher price level in the future, in line with the optimal way to escape from a liquidity trap discussed above. An exchange-rate peg can induce private-sector expectations of a higher future price level and create the desirable long-term inflation expectations that are a crucial element of the optimal way to escape from the liquidity trap.
In order to understand how manipulation of the exchange rate can affect expectations of the future price level, it is useful to first review the exchange-rate consequences of the optimal policy to escape from a liquidity trap outlined above. That policy involves a commitment to a higher future price level and consequently current expectations of a higher future price level. A higher future price level would imply a correspondingly higher future exchange rate (when the exchange rate is measured as units of domestic currency per unit foreign currency, so a rise in the exchange rate is a depreciation, a fall in the value, of the domestic currency).5 Thus, current expectations of a higher future price level imply current expectations of a higher future exchange rate. But those expectations of a higher future exchange rate would imply a higher current exchange rate, a current depreciation of the currency. The reason is that, at a zero domestic interest rate, the exchange rate must be expected to fall (that is, the domestic currency must be expected to appreciate) over time approximately at the rate of the foreign interest rate.
Journal of Economic Perspectives
Escaping from a Liquidity Trap and Deflation: The Foolproof Way and Others
Lars E.O. Svensson
First draft: January 2003
This version: December 2003
I remind readers that our comments and forecasts on central bank policy should not be construed as approval. We cannot help our readers prepare for the future if we try to impose our own theories on how the economy, financial system, and monetary systems should work. We are interested in what the Fed and other central banks are thinking, not how they should be thinking. We'll have time for that later. So far careful observation of that has yielded, unfortunately, accurate forecasts.
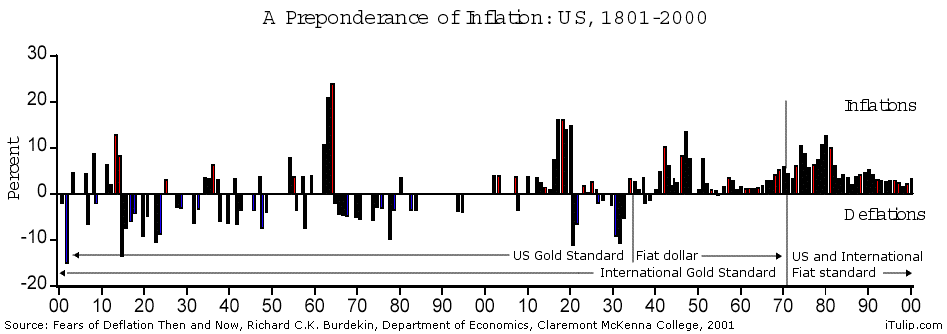
I leave you with the following history of inflations and deflations since 1800. Note that since every central bank abandoned the gold standard globally there have been two slight periods of deflation. These occurred before 1930. Since the international gold standard was abrogated by the US in 1971, ushering in the second era of floating exchange rates in 100 years – the last one ended badly as well – no deflation has occurred. Japan's experience with "deflation" would not show up on this graph because in no year since 1990 has deflation in Japan exceeded 2%.
We continue to expect that the actions of central banks to halt deflation will, as usual, in the long run work too well.
iTulip Select: The Investment Thesis for the Next Cycle™
__________________________________________________
To receive the iTulip Newsletter or iTulip Alerts, Join our FREE Email Mailing List
Copyright © iTulip, Inc. 1998 - 2007 All Rights Reserved
All information provided "as is" for informational purposes only, not intended for trading purposes or advice. Nothing appearing on this website should be considered a recommendation to buy or to sell any security or related financial instrument. iTulip, Inc. is not liable for any informational errors, incompleteness, or delays, or for any actions taken in reliance on information contained herein. Full Disclaimer

Comment