“ESTRAGON: I can't go on like this.
VLADIMIR: That's what you think.”
― Samuel Beckett, Waiting for Godot
Economic Crisis Avoidance Deus ex Machina - Part I: Active Asset Price Inflation
- Asset Price Inflation as a tool of monetary policy
- Rate hikes to end soon
- New large-scale asset purchases in the future
- Crash and recession delayed
Yes, it's getting to be that time in the cycle. After a long hiatus we are re-launching iTulip.com to track the final innings of the current asset price bubbles, and the period after.
iTulip was originally launched in November 1998 to track the tech stock bubble,identified that peak in April 2000 and forecast an 50% NASDAQ correction followed by recession. iTulip re-launched in March 2005 to track the housing mortgage bubble, identified a peak in December 2007, and forecast a 40% SP500 decline followed by a 2-year recession.
This is the first iTulip update on the current state of the markets and economy since January 2014. This analysis identifies a number of reasons why the current expansion, already the longest in US history, may continue in a fashion for some time. This follows from the previous update January 2014 that forecast continued expansion at a time when crash forecasts from reputable sources were legion. Nearly four years later we have an even better handle on why this expansion and asset price inflation period has continued long past its sell-by date.
Backdrop
Recent market volatility has brought out the usual rash of warnings of an imminent crisis, playing on investor anxiety. Market crash forecasts have been a staple of the financial press since the 2008 crash. Following that traumatic time investor anxiety levels have reached a permanently high plateau and markets have been climbing a wall of worry every since.
Another Market Crash in 2011?
- Dan Dorfman, Huffington Post
Wave Theory Predicts A Stock Market Crash In 2012
- Gregor Hovat, Business Insider
THE NEXT STOCK MARKET CRASH 2013: Why Many Pros Think It Has Already Begun
- Sam Ro, Business Insider
Has the Stock Market Crash of 2014 Begun?
- Alex Dumortier, Motley Fool
Stock Market Crash 2015: The Dow Has Already Plummeted 2200 Points From The Peak
- Michael T. Snyder, Seeking Alpha
Opinion: Stock-market crash of 2016: The countdown begins
- Paul B. Farrell, Marketwatch
80% Stock Market Crash To Strike in 2017, Economist Warns
- Jeff L. Yastine, Banyan Hill
A Stock Market Crash In 2018
-Taki Tsaklanos, Investing Haven
Worries about a crash and new crisis are understandable. A total of 113 months have passed since the last recession, nearly as long as the most extended period between recessions in US history when 120 months passed between the end of the 1991 recession and start of the 2001 recession. The perception that “we’re overdue” is valid from an historical perspective.
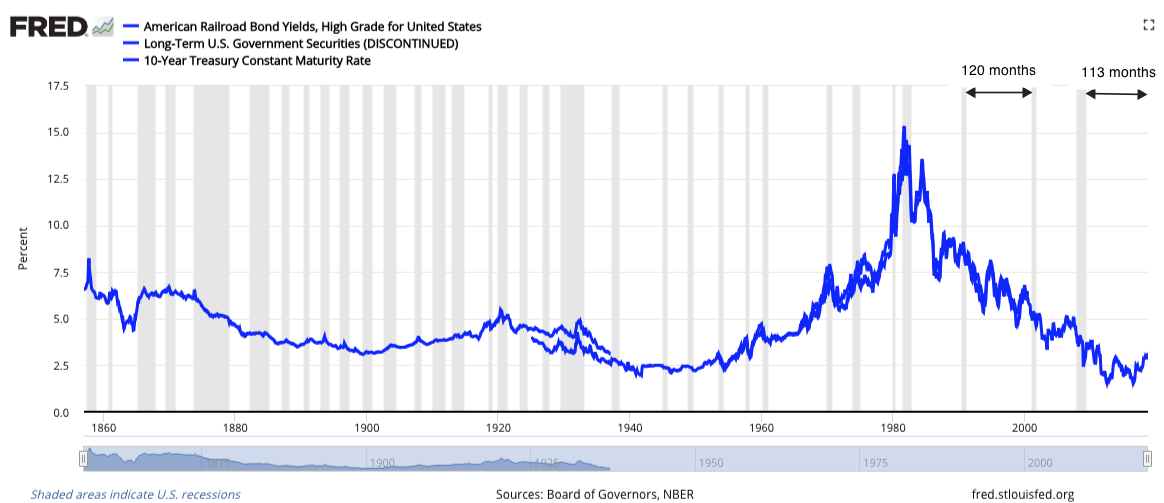
Long-term interest rates and recessions since 1860. Today the economy is experiencing the longest expansion in US history. Note that
counter-cyclical policy has succeeded at reducing the frequently and length of recessions relative to the period preceding.
Further fueling investor angst is the sense that price levels across many asset classes are growing to increasingly alarming and distorted proportions, including housing, ETFs, stocks, and bonds; debt taken on over the period is unsustainable and in some cases quite perverse, notably student debt.
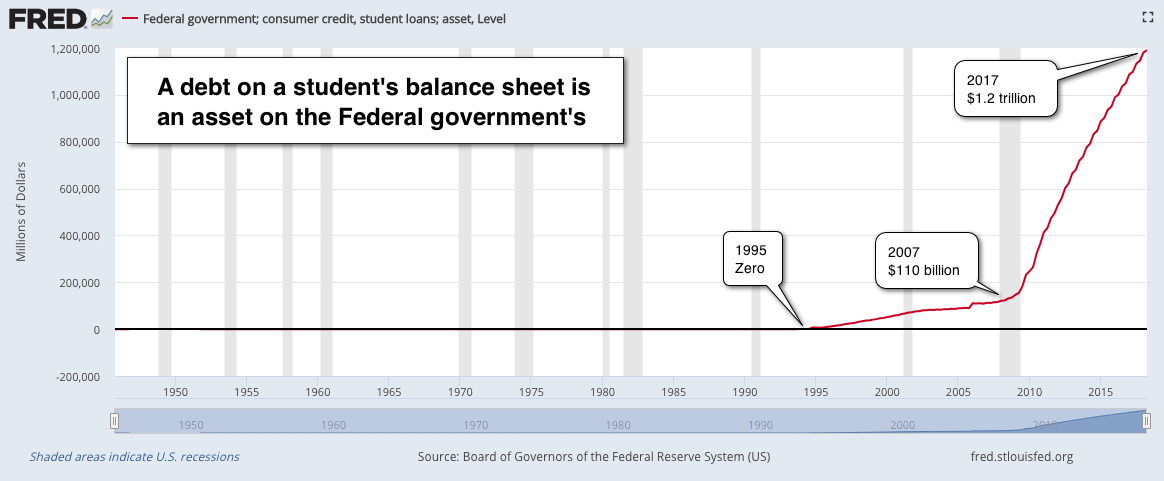
Underlying these asset price inflations is artificially low interest rates and excess liquidity created by large-scale asset purchases (LSAP) by the Fed intended to keep the U.S. economy from falling into a liquidity trap, a condition of an economy in a low interest rate environment that makes Fed rate policy ineffective to increase liquidity. US policy makers are determined to avoid a liquidity trap at all costs. The cost that was incurred to avoid a liquidity trap following the 2008 crisis are the side-effects of the elimination of a market rate of interest across the yield curve.
Starting from the condition of credit, property, and equity markets inflated for a decade by an extended period of artificially low interest rates and Fed asset purchases, this analysis points to a near-term pause in rate hikes or a resurgence of Asset Price Inflation to the Asset Price Inflation growth rate established in 2015, or possibly both. In that case, the cheap credit fueled economic expansion that began in mid-2009 at the end of The Great Recession will continue, albeit at a slower rate. Going forward from this analysis, we will track our API Index and other indicators to confirm or modify the forecast.
Before diving into the analysis, a few definitions and a brief iTulip review for the benefit of new readers before picking up where we left off January 2014.
Definitions:
Asset Price Inflation used as a verb refers to the process of financial asset prices rising due to non-market pricing inputs.
Asset Price Inflation used as a noun refers to the condition of asset prices inflated by non-market pricing inputs.
Passive Asset Price Inflation is Asset Price Inflation that results as a side-effect of monetary polices like low interest rates intended to meet macro-economic objectives, specifically stimulating the economy out of recession. The tech stock and mortgage credit bubbles were passive asset price inflations.
Passive Asset Price Inflation is Asset Price Inflation that results as a side-effect of monetary polices like low interest rates intended to meet macro-economic objectives, specifically stimulating the economy out of recession. The tech stock and mortgage credit bubbles were passive asset price inflations.
Active Asset Price Inflation is Asset Price Inflation that is produced intentionally by the Fed via Large-Scale Asset Purchases to meet financial market objectives. Large-scale asset purchases (LSAP) from 2013 - 2015 appears to be the first active Asset Price Inflation.
iTulip Review
Exactly two iTulip.com market peak, crash, and recession forecasts have been made since iTulip site launch in 1998, the first in April 2000 at the peak of the Tech Stocks Bubble and the second in December 2007 at the peak of the Mortgage Credit Bubble. The last update January 2014 noted a top a year into a two-year Asset Price Inflation over the course of that year.
The first two asset bubble peaks in 2000 and 2007 were identified here as harbingers of a market crash followed by recession, the first in technology stocks and the second in credit markets generally, led by mortgage credit. The third peak identified in 2014, however, noted that Asset Price Inflation peak as a pause in a long-term Asset Price Inflation process, with reflation of asset prices propelling renewed market growth in 2015 and beyond.
iTulip has successfully identified two Asset Price Inflation peaks with no false negatives since 1998 when the site was launched. The analysis is based on an understanding of the inherent contradiction of the objectives of the Fed’s counter-cyclical macro-economic policy framework and the asset bubbles that result as a side-effect of policy: counter-cyclical economic stimulus at the beginning of an economic cycle after a recession reflates the macro-economy, while counter-cyclical inflation mitigation collapses the asset bubbles that formed in parallel with economic growth over the expansion period, which asset bubbles are an integral part of the expansion via positive wealth effects and excess liquidity. Counter-cyclical policy applied to manage wage price inflation at the end of a cycle in the absence of asset bubbles may produce a "soft landing" for the economy as intended, to allow the expansion to continue without exceeding inflation targets. However, in the presence of asset bubbles the result consistently in the past two cycles has been to collapse the asset bubbles that were present at the end of the cycle, precipitating a hard landing when asset bubbles collapsed in response to tightening measures. A new policy framework that combines late cycle counter-cyclical policy to manage wage price inflation and application of active Asset Price Inflation via large-scale asset purchases to prevent sudden asset price deflation may explain the duration of the current expansion and also presage a continuation of it.
The Fed's Counter-Cyclical Policy Framework
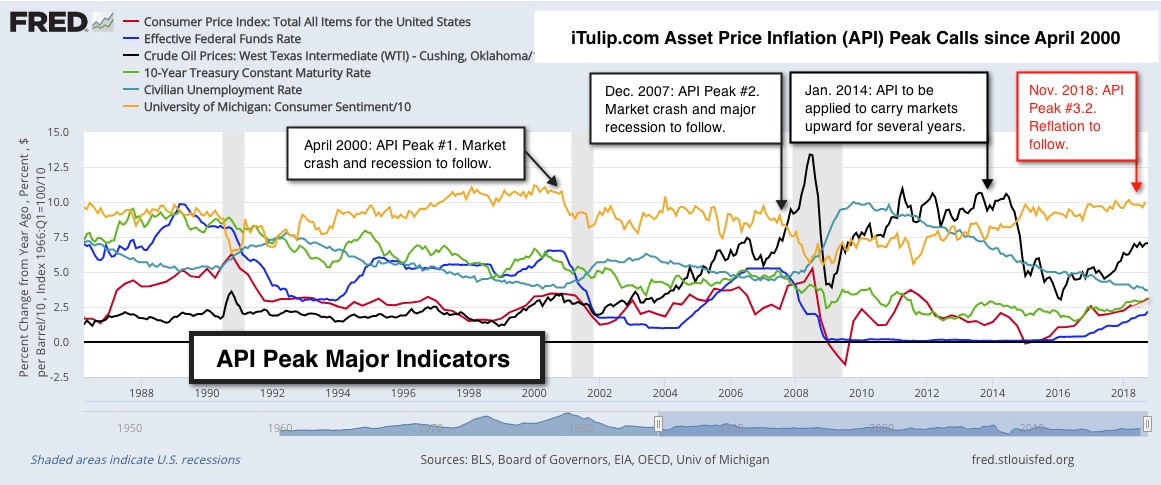
Referring to the Asset Price Inflation Peak major indicators chart above, to simplify the explanation of the method used to make the previous two crash and recession forecasts we focus on six of 23 used:
1. CPI – Consumer price inflation measure used among others in policy decisions.
2. Fed Funds Rate – Measure of effectiveness of Fed manipulation of interest rates.
3. Oil price – Primary future inflation expectations input for both consumers and producers.
4. 10-Year Treasury Rate – Global interest rate “sea level” that previously grounded global markets in economic reality.
5. Civilian Unemployment Rate – One of many labor market measures used in policy decisions.
6. Consumer Confidence – Lagging indicator of consumer confidence in the economy used in policy decisions.
Since The Great Inflation of the 1970s, the Fed has sought to prevent a recurrence of a wage-price spiral. There are several ways to end a wage-price inflation spiral once established. The means that the Volker Fed chose was to lower the availability of credit to induce enough unemployment to both lower labor pricing power and demand across the economy, inducing producers to lower prices to meet lower demand and wage rates in response to weaker labor markets.
Counter-cyclical policy applied since the 1980s is intended to head off a wage-price inflation process and produce a soft landing for the economy at the end of an economic cycle. Operating within this policy framework, the Fed is especially sensitive to rising employment costs at the end of the cycle because, according to this formula, it is through wages that the transmission of price signals back into all-goods prices hap ends, and where a wage-price spiral needs to be cut short. However, Asset Price Inflation that creates asset bubbles, initially as an unintended consequence of stimulus applied to reflate the economy following recession, appeared immediately after the first implementation of counter-cyclical policy at the end of the Volker era and complicated execution on the anti-inflation prescription. As explained in The repetition compulsion of central bankers in 2010, each time a post-1980s styled tightening program was executed in the presence of an asset bubble that developed as a side effect of reflation policy it precipitated a market crash and recession. This cycle has repeated twice since iTulip was established in 1998 and is on the verge of being repeated again, albeit with a major modifier.
Referring back to the Asset Price Inflation Peaks chart, today all the antecedents of the past two such events are present in extremis. But as in the case of my warning in 2014, there are two reasons to expect that this cycle will continue to be unlike the previous two: 1) today the Fed still lacks the tools to manage a major recession without resorting to cures that are worse than the disease and will seek to avoid a crash-induced recession until such time that the fall-out is manageable, and 2) I argue here that the Fed has the means to at least forestall an untimely crash, perhaps indefinitely, and has used it in the past, which explains the unusual durability of both the expansion and the length of financial market performance.
To understand why this asset price inflation period is unlike the previous two covered by iTulip since 1998 we review major new developments in the policy framework.
We’re Not in Kansas Anymore
[Fed Chairman] Greenspan assured the congressional Joint Economic Committee that even with the Fed’s key economic policy lever, the federal funds rate, at a 41-year low of 1.25 percent, the central bank has other resources to influence interest rates to jump-start economic growth. He said that in addition to pushing the funds rate, the interest that banks charge each other on overnight loans, closer to zero, the Fed can simply begin buying longer-term Treasury securities to drive longer-term interest rates lower.
—Associated Press Newswires, May 21, 2003
Philosophically the Fed decided years before the Great Recession that price fixing of long-term government bonds was justifiable as a means to an end, to prevent a debt deflation and the recurrence of a 1930s style deflationary depression.
The result of the application of long-bond price fixing is a global economy cut loose from its moorings, operating for the first time in history without a market rate of interest that can be confirmed by market participants at any point in time. One cannot apply pre-2008 market forecasting methods in this new environment. Forecasts need to take into account the implications of fundamental changes both in the structure of financial markets that result from these changes, and more importantly in Fed policy imperatives that follow logically from them. These explain the longer than usual duration and of the current expansion and inform the expectation that the expansion may continue for some time as these methods continue to be applied. Note that we make no ideological or other judgements on these developments. We're in the "what's going to happen" not the "what should happen" business.
My 2014 asset price re-inflation forecast was predicated on the notion that Asset Price Inflation is applied with other stimulus measures, such as fiscal stimulus, for the purpose of stimulating economic growth by inflating asset prices. From that notion it follows that active measures to prevent runaway asset price deflation – aka a market crashes – will be pursued via active Asset Price Inflation measures at times when a market crash is likely to cause a macro-economic crisis that cannot be effectively managed with policy tools available at the time under existing market and economic conditions.
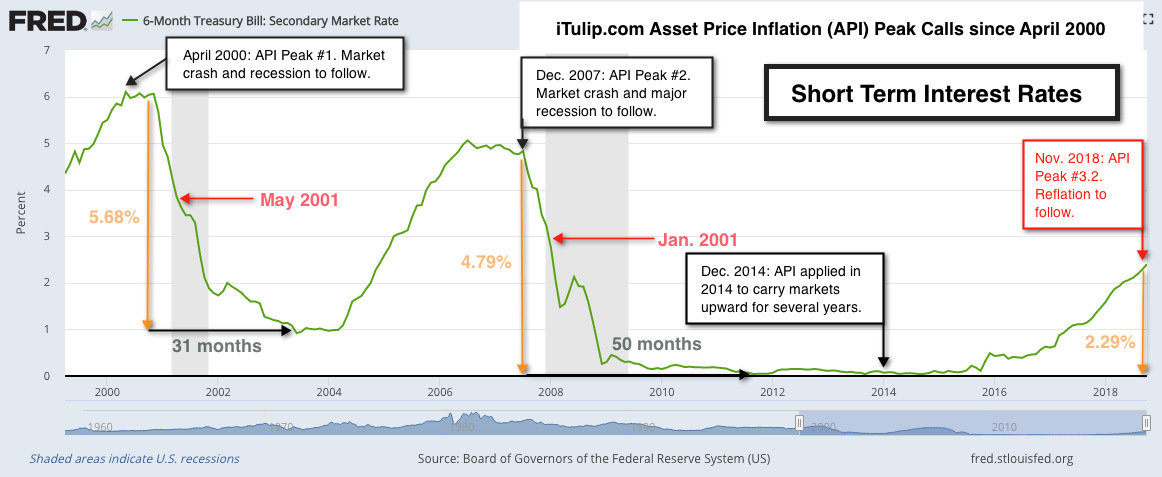
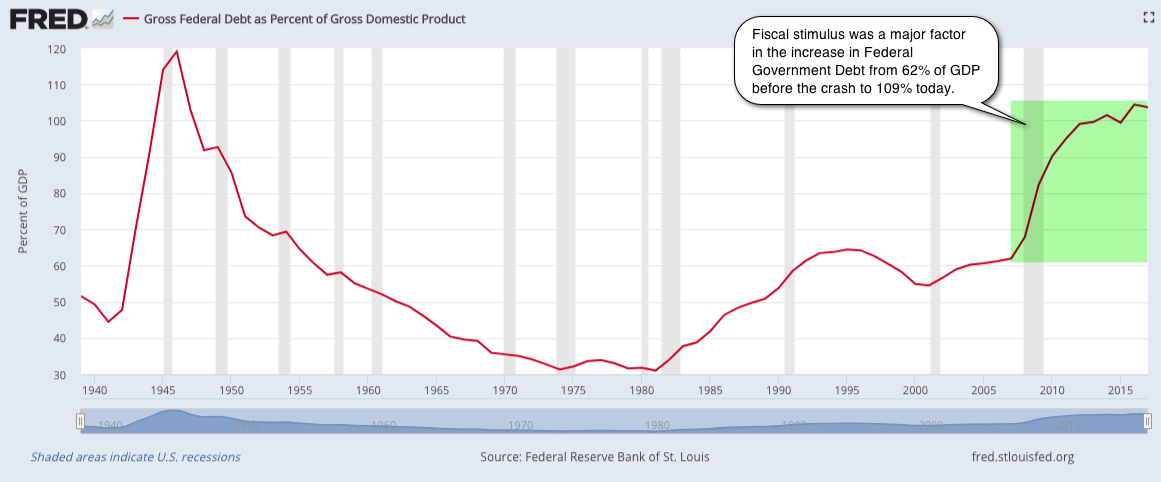
My argument in 2014 for a continuation of Asset Price Inflation versus a 2015 crash was that the Fed had been motivated to employ active Asset Price Inflation because the alternative was to subject the economy to a recession when effective reflation policy tools were unavailable. The two main tools are short-term interest rate cuts and fiscal stimulus.
1) Historically ultra-low short term rates, 0.07% at the time.
2) High levels of Federal debt at 109% of GDP then as compared to 61% before the Great Recession.
Taken together it was apparent then that the tools needed to effectively manage a major recession precipitated by a market crash were not available in 2014. Given that the Fed can and has intentionally inflated asset prices to meet both short-term and long-term policy objectives, I concluded that the Fed induced Asset Price Inflation in 2013-2015 to prevent a crash.
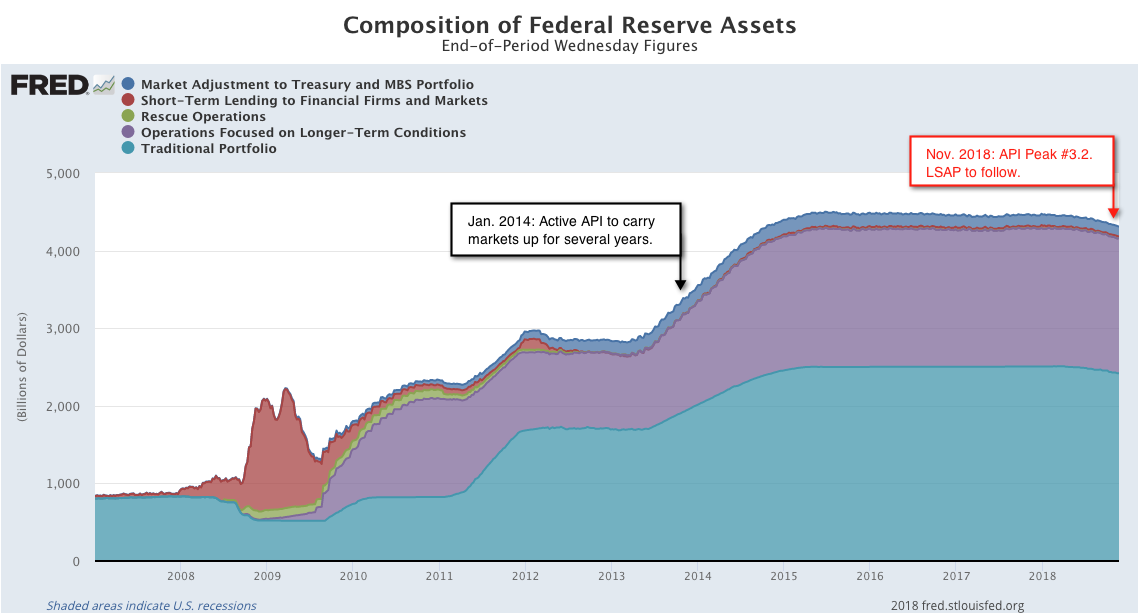
Asset Price Inflation applied throughout 2014 carried markets upward until recently.
History of Asset Price Inflation and Fed Policy
Active Asset Price Inflation has evolved into a tool of economic policy since iTulip launched in 1998 but it did not start out that way.
The first passive Asset Price Inflation episode occurred in the 1990s during the Greenspan Fed era, when the macro-economic benefits of Asset Price Inflation as a side effect of monetary policy were pronounced. Greenspan reveled in the popularity that the tech stock bubble produced for the booming economy and was genuinely surprised when the collapse of the tech stock bubble delivered a recession via negative wealth effects on his watch. A man of contradictions, in public when asked about the existence of a bubble, even as late as early 2000 before the crash, he asserted that no bubble existed. Yet the record of Fed meeting minutes released ten years later quote him as stating in 1994, “When we moved on February 4th, I think our expectation was that we would prick the bubble in the equity markets."
It is possible that privately he knew how effective passive Asset Price Inflation is as a tool of economic stimulus, delivering economic growth without fueling consumer price inflation, but neither he nor any Fed official has ever suggested in public that Asset Price Inflation is pursued actively as policy.
I first noted passive Asset Price Inflation as a feature of economic policy 13 years ago in an article written for AlwaysOn Network in March 2005: The Bubble Cycle is Replacing the Business Cycle. Updated versions of that concept are available today at sites like TheBubbleBubble.com.
I believe active Asset Price Inflation is an integral albeit unstated tool of policy. I posed the question to Yellen in a conversation I had with her in June 2012 at a Boston Economics Club meeting in a one-on-one conversation that followed her public speech and Q&A. That was a month after publication of Carlo Rosa's paper "How 'Unconventional' Are Large-Scale Asset Purchases?, The Impact of Monetary Policy on Asset Prices" (footnote, below). In Part II we review circumstantial evidence and review an API Index akin to the CPI developed to track the level of and changes in Asset Price Inflation.
Four years have passed since the last iTulip update when I expected the Fed to continue to deploy LSAP to prevent a crash and extend the expansion in order to prevent the still fragile economy from experiencing a major market event. Today as financial markets and the economy are beginning to react visibly to counter-cyclical policy applied since 2016 in the presence of extreme asset valuations. The question arises: Is the economy in a better place to weather a crisis than it was in January 2014, the time of our last update?
Can The US Afford a Recession Today?
The assertion that interest rates are still too low to provide significant stimulus in a near term future recession is clear. A minimum of 5% in short-term interest rate reductions over two years or more was needed to stimulate the economy out of recession during the past two recessions, and the next recession is likely to be considerably more severe than the last one, given accumulated imbalances.

Using the current 2.29% 6-month rate as a starting point, if stimulus from interest rate reductions during the 2001 recession was applied Nov. 2000 when the Fed began to cut interest rates to stimulate the economy out of the 2001 recession, by May 2001 interest rates are zero, one month into the recession. For the 2008 – 2009 recession, the run from 2.29% to zero is also about one month from recession onset, leaving the Fed out of rate cut ammo after nine months that in the event was needed for 50 months in total to help reflate the economy.
Lacking short-term interest rates as a meaningful tool for economic stimulus if a recession occurs in the near term leaves fiscal stimulus as the primary tool available. However, both Greenspan and Yellen have recently issued public warnings about the Federal government balance sheet as it is. In Part II we review the implications of potentially growing Federal government debt significantly beyond the 109% of GDP level it is at today, up from 62% before the 2008 crisis. In short, if the Fed as I assert has the means to extend Asset Price Inflation the motivation to do so is there today. The alternative is an economic reflation challenge that policy makers are not in a position to meet at this time.
Conclusion
If we accept the notion that the Fed has in active Asset Price Inflation the opportunity to avoid a macro-economic crisis precipitated by a market crash and deployed it previously, from 2013 to 2015, and can by application of active Asset Price Inflation continue the already lengthy expansion without interfering with counter-cyclical policy objectives, we are still left with the question: How long can this go on?
Longer than you think.
The duration of the current expansion can be explained by the integration of active Asset Price Inflation into the Fed’s counter-cyclical policy framework to resolve the inherent conflict between the execution of counter-cyclical monetary policy and the fact of Asset Price Inflation as an inevitable result of post recession stimulus measures. Further, market crashes when these present major macro-economic risks can be avoided by application of Asset Price Inflation by intention. If this formulation is correct, we can expect the Fed to end rate hikes shortly or begin a new LSAP program, or possibly both, if ending rate hikes in and of itself is not sufficiently simulative to financial markets to prevent a crash that could lead to an new unmanageable economic crisis. We model this in a Best Case Scenario model discussed in Part II.
Alternatively, if this formulation is incorrect and counter-cyclical Fed policy continues unabated, with additional rate hikes in December and beyond, and perhaps even if not, sans active Asset Price Inflation a Worst Case Scenario is possible.
In Part II we examine Best Case and Worst Case scenarios. The coming weeks and months will be crucial. We will watch our API index and other indicators closely.
__________________________________________________ _______________________
Economic Crisis Avoidance Deus ex Machina - Part II: Inside the Machine
- How Active Asset Price Inflation Works
- Will the Fed Continue Counter-Cyclical Policy Until the Today’s Asset Bubbles Pop?
- Best Case and Worst Case Scenarios
- Tracking Asset Price Inflation and crash risk going forward
Asset Price Inflation delivers economic stimulus without producing wage inflation or boosting the CPI. As a stimulus tool Asset Price Inflation is nirvana for central bankers, resulting extremes of wealth distribution aside. The duration of the current expansion can be explained by the integration of active Asset Price Inflation into the Fed’s counter-cyclical policy framework to resolve the inherent conflict between the execution of counter-cyclical monetary policy at the end of of any economic cycle to prevent "overheating" and rising wage and all-goods inflation and the effect of the same policy on financial markets that were inflated by the previous round of post-recession stimulus measures over the duration of the expansion.
What if Asset Price Inflation can be applied actively through large scale asset purchases (LDAP) to stimulate financial markets to prevent asset prices from sudden declines while at the same time interest rates are cut to affect wage rates and all-goods inflation to target levels? In theory an economy could be operated this way for quite a long time, with "good inflation" in assets maintained or rising and "bad inflation" in wages and CPI kept in check.
Next we look for evidence of active Asset Price Inflation has been applied in the past and perhaps helps explain the durability of the current expansion and financial market performance. We model a Best Case scenario that has the Fed halting rate hikes at or near the current wage cost level and the includes application of active Asset Price Inflation in the near future to support financial markets or and a Worst Case scenario that models continued rate hikes and no active Asset Price Inflation.
If you are already an iTulip Select subscriber, click here for Part II.
To subscribe, please review the two options, below.
__________________________________________________ __________________________________________________ _______________
This article is the re-launch of iTulip to track developments leading up to the next major market event, as from November 1998 to April 2000 and again June 2006 to December 2007, depends on the response.
Today I'm occupied with running a virtual reality technology company based on an idea that I have had since the early 1980s, to use VR to bring the outdoors indoors to give millions of consumers an exciting new way to get the cardio they need, and discussed here on the iTulip forums starting in December 2013. I was encouraged by iTulip members to launch a company to execute on this idea a year later.
The timing was propitious both with respect to VR market development and my projection at the time for the economic expansion and asset price inflation to continue for some years by virtue of new tools of economic and market management that were put in place by policy makers after the 2008 crisis. The prospect of delivering monotonous and repetitive descriptions to readers here on the workings of this new system for years on end while the expansion went on and on was unappealing, while the prospect of building an exciting new technology company that can change the world was exciting. Since then my co-founder and I have built an amazing VR technology company VirZOOM that leads the VR Fitness space.
A re-launch of iTulip to cover the period ahead is a major time commitment. As a practical matter we need to conclude a crowd funding campaign on WeFunder. To that end, we are offering iTulip Select subscriptions as a perk to VirZOOM WeFunder investors. Not only do you get an iTulip Select subscription, you'll own a security Note called a SAFE in VirZOOM, too.
iTulip Select Perks Offering -
$375 Investment in VirZOOM for 1-Year FREE iTulip Select Subscription
$600 Investment in VirZOOM for 2-Year FREE iTulip Select Subscription
$1,000 Investment in VirZOOM for 5-Year FREE iTulip Select Subscription
Option 1:
To subscribe to iTulip Select and receive a VirZOOM SAFE investment security -
Click here -> Invest in VirZOOM or go to -> www.Wefunder.com/VirZOOM
*Offer extended to 02/28/2019 @11:59 pm EDT. Act NOW!
Option 2:
To subscribe directly click: iTulip Select: The Investment Thesis for the Next Cycle™
_________________________________________________
Footnotes:
Using a Long-Term Interest Rate as the Monetary Policy Instrument
FEDERAL RESERVE BANK OF SAN FRANCISCO WORKING PAPER SERIES - December 2004
Federal Reserve Bank of New York Staff Reports
How “Unconventional” Are Large-Scale Asset Purchases?
The Impact of Monetary Policy on Asset Prices
Carlo Rosa, Staff Report No. 560 May 2012
The Liquidity Trap: An Alternative Explanation for Today's Low Inflation
Maria A. Arias , Yi Wen
Federal Reserve Bank of St. Louis
The Risk of Yield Curve Inversion—and How to Avoid It
__________________________________________________
To receive the iTulip Newsletter or iTulip Alerts, Join our FREE Email Mailing List
Copyright © iTulip, Inc. 1998 - 2018 All Rights Reserved
All information provided "as is" for informational purposes only, not intended for trading purposes or advice. Nothing appearing on this website should be considered a recommendation to buy or to sell any security or related financial instrument. iTulip, Inc. is not liable for any informational errors, incompleteness, or delays, or for any actions taken in reliance on information contained herein. Full Disclaimer
 .
.


Comment