Re: 2013 Review and 2014 Forecast - Part I: The Last Bubble - Eric Janszen
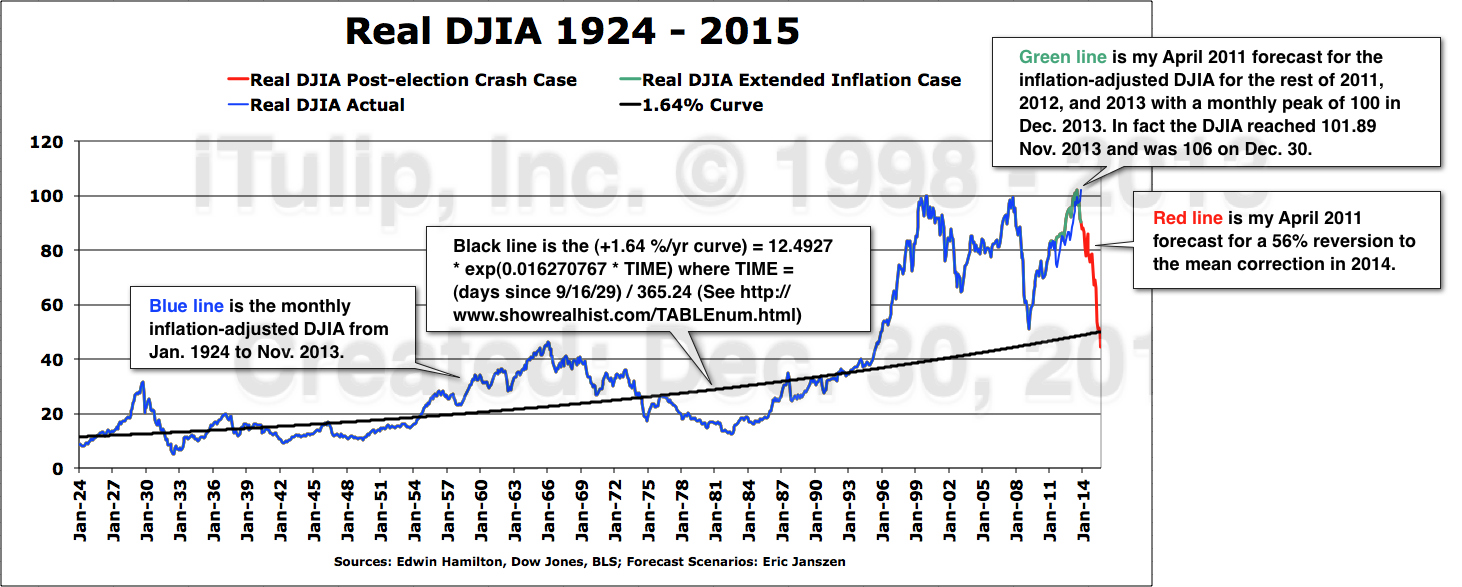
Funny you drop in now, EJ, right as I was reviewing your last report. Only at the time you were forecasting a 56% drop in the DJIA:
A Dec. 30, 2013 update to the April 2011 chart, below.

The Real DJIA reached just over 100 before starting to correct in Jan. 2014.
CI: This may be more than a correction, then? I mean, really? A 56% decline?
EJ: In mid-2011 I projected what I called the Extended Asset Price Inflation Case. That's the green line. The Real DJIA was to climb from 83 at the time to just over 100 by the end of 2013. Early in 2014 it begins to price-in a mid-gap recession later in the year. The first chart was published April 2011 as the watermark indicates. The update was generated from the same excel file. The DJIA data are from the Dow Jones & Co. and the inflation adjustments updated using the latest data from the Real DJIA web site that we've been using since 2006.
CI: So the crash you forecast in mid-2011 for early 2014 is happening? Wish you'd reminded me of this chart sooner!
EJ: That would appear to be the case. However, a crash of the full extent of 56% shown spells complete disaster for the U.S. economy. I seriously doubt that the Yellen Fed will stand by, or at least I hope they understand the danger. The correction is a delayed reaction to the beginning of the end of the Fed's bond price fixing operation, which ending I have warned for years was to produce chaos in the bond market as market participants thrashed around trying to figure out what the market price of a long bond is without the Fed's interference in the market.
So I'm a little unclear about the "fake markets, fake crash" aphorism. The last report didn't characterize it as a fake out:
CI: Have you tried to build the case for that, for the market to correct, the "healthy correction" that everyone has been hoping for, followed by more gains as the economy picks up?
EJ: Yes but it's just not credible. The markets are far more precarious now than at any time since I started iTulip in 1998. At time of the peaks of the two speculative bubbles in 2000 and 2007, the over-priced assets at risk were confined to narrow classes of assets, the macro-economy was less fragile, inflation was higher, and so on, as I cover in the next part. Additionally the Fed has already used up interest rate policy as a anti-deflation policy tool. The Fed is now limited Zero Interest Rate Policy (ZIRP) options, namely, loading securities onto its balance sheet.
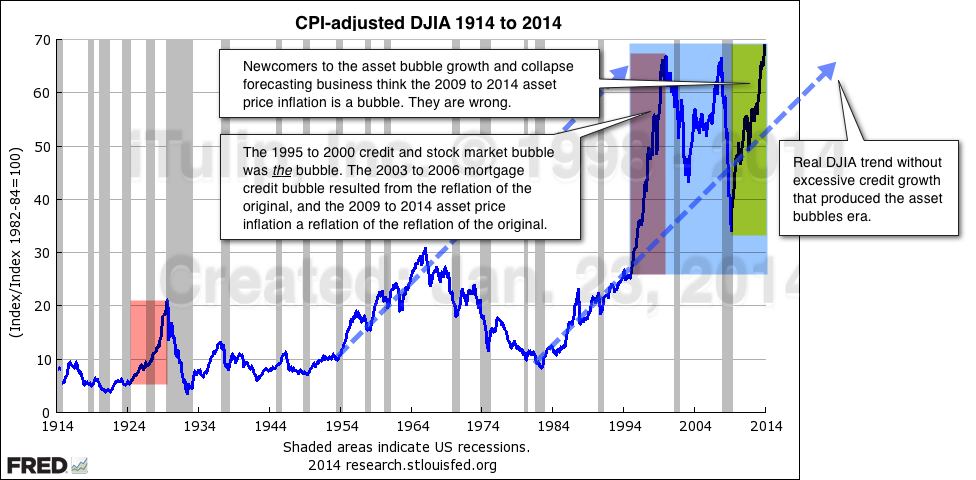
 You referenced the "Real DJIA" data. Look how close it lines up with your chart at the time:

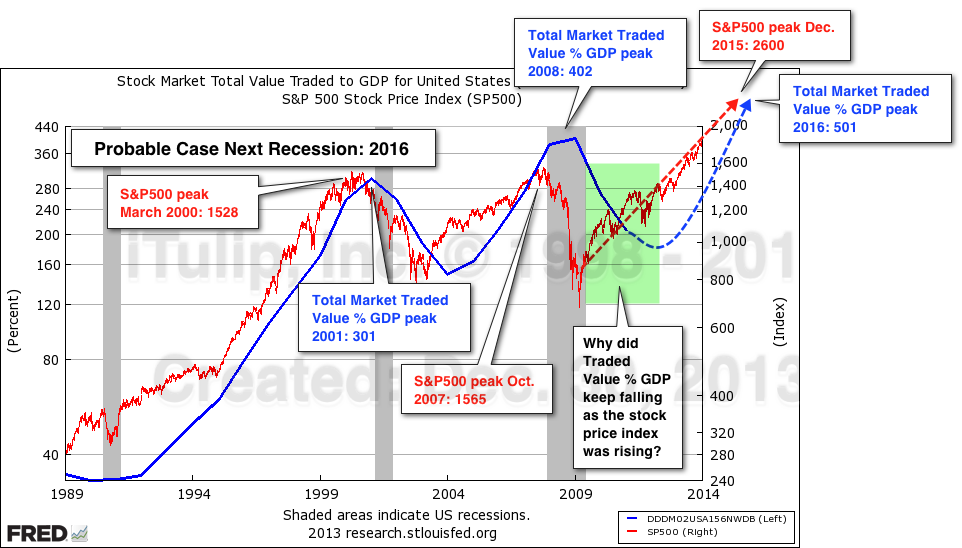
It's popped way over 110. If 100 was toppy in 2014 why is 112 not in 2016? Compare and contrast.


You had mentioned Yellen raising rates, China weakness, as potential triggers:
CI: You think we're at a market top and a crash process is underway that you forecast last year. You think the global economy is too iffy to take another hit because the starting point is too low. The Fed doesn't have enough juice to keep this post-bubble economy afloat.
EJ: I did a careful comparison of crash preconditions in 2014 at the current market top versus the preconditions I saw in March 2000 and November 2007. Yes, the picture this paints is alarming.
CI: Why do markets crash?
EJ: They crash after a threshold of accumulated market risk is exceeded while simultaneously the central bank is putting pressure on markets via rate hikes are being executed for macro-economic reasons not to slow the market, and then a trigger strips the wire the crash process begins. We saw this happen in equity markets from 1992 to 2000, then in mortgage credit market from 2003 to 2007. In each case the Fed applied the pressure and an external event supplied the trigger. In the case of the NASDAQ bubble the Fed's rate hikes in 1999 supplied the pressure and tax loss selling in April 2000 was the trigger. Rate hikes from 2004 to 2007 supplied the pressure for the 2008 crash and the Q1 2008 oil price spike was the trigger. This time I see the Fed's taper as supplying the pressure and a financial crisis in China providing the trigger.
And when you wrote this, you pointed to a credit balance/margin debt ratio of just under 5 as "fearless" with one just under 3.5 as "almost fearless."

And where are we now? Looks like it's tracking pretty close, in terms of fearlessness and getting deja vu all over again.
It's great to hear from you, but not so fast! How is it a fake if it seems like the data are lining up with the views you say have remained unchanged since early 2013?
Originally posted by EJ
View Post
Funny you drop in now, EJ, right as I was reviewing your last report. Only at the time you were forecasting a 56% drop in the DJIA:
Forecast is for the inflation-adjusted Real DJIA to rise to slightly over 100 until the end of 2013.
A Dec. 30, 2013 update to the April 2011 chart, below.

The Real DJIA reached just over 100 before starting to correct in Jan. 2014.
CI: This may be more than a correction, then? I mean, really? A 56% decline?
EJ: In mid-2011 I projected what I called the Extended Asset Price Inflation Case. That's the green line. The Real DJIA was to climb from 83 at the time to just over 100 by the end of 2013. Early in 2014 it begins to price-in a mid-gap recession later in the year. The first chart was published April 2011 as the watermark indicates. The update was generated from the same excel file. The DJIA data are from the Dow Jones & Co. and the inflation adjustments updated using the latest data from the Real DJIA web site that we've been using since 2006.
CI: So the crash you forecast in mid-2011 for early 2014 is happening? Wish you'd reminded me of this chart sooner!
EJ: That would appear to be the case. However, a crash of the full extent of 56% shown spells complete disaster for the U.S. economy. I seriously doubt that the Yellen Fed will stand by, or at least I hope they understand the danger. The correction is a delayed reaction to the beginning of the end of the Fed's bond price fixing operation, which ending I have warned for years was to produce chaos in the bond market as market participants thrashed around trying to figure out what the market price of a long bond is without the Fed's interference in the market.
CI: Have you tried to build the case for that, for the market to correct, the "healthy correction" that everyone has been hoping for, followed by more gains as the economy picks up?
EJ: Yes but it's just not credible. The markets are far more precarious now than at any time since I started iTulip in 1998. At time of the peaks of the two speculative bubbles in 2000 and 2007, the over-priced assets at risk were confined to narrow classes of assets, the macro-economy was less fragile, inflation was higher, and so on, as I cover in the next part. Additionally the Fed has already used up interest rate policy as a anti-deflation policy tool. The Fed is now limited Zero Interest Rate Policy (ZIRP) options, namely, loading securities onto its balance sheet.


The Real DJIA was to climb from 83 at the time to just over 100 by the end of 2013. Early in 2014 it begins to price-in a mid-gap recession later in the year.


CI: You think we're at a market top and a crash process is underway that you forecast last year. You think the global economy is too iffy to take another hit because the starting point is too low. The Fed doesn't have enough juice to keep this post-bubble economy afloat.
EJ: I did a careful comparison of crash preconditions in 2014 at the current market top versus the preconditions I saw in March 2000 and November 2007. Yes, the picture this paints is alarming.
CI: Why do markets crash?
EJ: They crash after a threshold of accumulated market risk is exceeded while simultaneously the central bank is putting pressure on markets via rate hikes are being executed for macro-economic reasons not to slow the market, and then a trigger strips the wire the crash process begins. We saw this happen in equity markets from 1992 to 2000, then in mortgage credit market from 2003 to 2007. In each case the Fed applied the pressure and an external event supplied the trigger. In the case of the NASDAQ bubble the Fed's rate hikes in 1999 supplied the pressure and tax loss selling in April 2000 was the trigger. Rate hikes from 2004 to 2007 supplied the pressure for the 2008 crash and the Q1 2008 oil price spike was the trigger. This time I see the Fed's taper as supplying the pressure and a financial crisis in China providing the trigger.
In this re-re-reflation of the original 1995 to 2000 bubble we have had two anxiety induced corrections followed by
a year-long period of complacency when margin debt has reached near fearless levels.
Margin debt bravery peaks before crashes. Margin debt de-leveraging propels the crash.

And where are we now? Looks like it's tracking pretty close, in terms of fearlessness and getting deja vu all over again.
It's great to hear from you, but not so fast! How is it a fake if it seems like the data are lining up with the views you say have remained unchanged since early 2013?


Comment