Announcement

Collapse
No announcement yet.

2013 Review and 2014 Forecast - Part I: The Last Bubble - Eric Janszen

Collapse
X
 
  • Filter
  • Time
  • Show
Clear All
new posts

  • Re: bond run confusion

    Originally posted by Polish_Silver View Post
    I don't understand the difference. The fed is worry about bond funds having a redemption run. Isn't that caused by individuals selling bonds?

    Is the problem that the funds are obligated to return a certain nominal value to the customers, even though the invested in bonds may have gone below that value?
    the problem is liquidity. if the bond funds have a run, they have to sell in size into a declining market, pushing the market down further, and raising the possibility of a real bond crash, which would skyrocket intermediate and long term interest rates. but the fed wants to control the whole rate curve these days, not just the rates on t-bills. so the choice would be for the fed to step in and buy [or do repos] on all those bonds, or to put in an emergency brake on the ability of bond fund holders to cash in their chips.

    bond funds are NOT obligated to maintain a certain nominal value- you are confusing them with money market funds [which hold t-bills or short dated commercial paper], which do all they can not to "break the buck."

    Comment


    • Re: 2013 Review and 2014 Forecast - Part I: The Last Bubble - Eric Janszen

      Five months. Any updates forthcoming?
      Outside of a dog, a book is man's best friend. Inside of a dog, it's too dark to read. -Groucho

      Comment


      • Re: 2013 Review and 2014 Forecast - Part I: The Last Bubble - Eric Janszen

        The markets have been beyond boring to follow these days. Just watching the bubble go higher and higher and higher


        Comment


        • Re: What is a "debt deflation"

          Bond-run fears are back in the financial news again (excerpts):


          All it takes is a few mouse clicks to buy shares in the Scout Unconstrained Bond Fund (SUBFX), an exchange-traded fund that tracks a concoction of debt tied to the government, financial firms, mortgage pools, and other entities.

          And all it takes is a few mouse clicks to sell—something that has begun to worry Wall Street. Since the financial crisis, $900 billion has flowed into bond mutual funds and ETFs such as Scout Unconstrained, bringing the industry’s total holdings to $3 trillion. Fund investors who sell shares get their money back almost immediately, as if they were making a withdrawal from a money-market fund. The bonds that the funds own are far less liquid, often trading in telephone conversations or e-mails between brokers, away from exchanges. If too many people decide to get out of bond funds at the same time, the wave of selling could lead buyers to sit on their hands, bringing the system to a halt.

          The worry isn’t only that investors’ bottom lines would take a hit. It’s that a mass selloff could swamp the market, with demands for redemptions forcing fund managers to unload their bonds at rock-bottom prices. The ensuing losses would encourage even more investors to redeem, perpetuating the downward spiral.

          Some market analysts say the fears are overblown. “Many funds already carry a fair amount of cash” to meet redemptions, Ira Jersey, director of U.S. rates strategy at Credit Suisse, wrote to clients on June 24. Taxable bond funds have 9.5 percent of their portfolios in liquid assets such as cash and U.S. Treasuries, according to Credit Suisse, more “than most would assume.”

          Brian Reid, chief economist at the Investment Company Institute, says interest rate shocks are nothing new, and the system has held before—as in 1994, when the Fed doubled its benchmark rate to 6 percent over 12 months, catching many investors unprepared. “Markets aren’t nearly as fragile as people worry about,” Reid says. “I would put ‘massive outflows from bond funds’ at such a low level of probability—even during the financial crisis we didn’t have that—it doesn’t rise to the level of systemic risk that has been portrayed.” Regulators and market commentators who warn about systemic risk too often could numb investors to actual problems, he says—the Chicken Little syndrome.

          Eric Jacobson, co-head of fixed income at Morningstar, also contends that the peril has been overstated. “It would be an act of hubris to say there’s no risk,” he says. “But I would posit that whatever the next crisis is, is likely not to be the one that everyone’s worried about today.” A surprising 1.4 percentage point surge in the 10-year Treasury yield over the last eight months of 2013 led to outflows of $77 billion, or 2.7 percent of industry assets, according to ICI. Inflows resumed in 2014. “To the extent that people might act on it, it’s already begun,” Jacobson says. “By the time we may get to anything that resembles a scary outcome, a lot of the fearful money will have already moved.”


          http://www.businessweek.com/articles...scenario#r=rss


          This article from 7/3 also includes some of the 'commentary' on this issue from BlackRock and JPM that was previously mentioned.

          For those that missed the initial story, there are credible rumors of controls being bandied about: http://www.itulip.com/forums/showthr...460#post282460

          Comment


          • Re: 2013 Review and 2014 Forecast - Part I: The Last Bubble - Eric Janszen

            Regarding GAGFO, the gold/oil ratio turning point often appears coincident with risk on/risk off points in the market where the SPX sells off. I'm not sure how useful this ratio is because on its own it doesn't give insight into the magnitude of the correction but rather that some correction is expected as investors shift preferences into various assets. And it is hard to tell if the gold ratio is driving SPX or if some other variable is driving both the SPX and Gold/Oil. That said, the gold/oil ratio relationship works better (or is coincident with market turns) over smaller intervals as in the long time frames other factors are dominating the relationship (perhaps EJ theory on triffin/deficits and gold/dollar reserve currency relationship).


            The following is a bit dated, but incidentally, the Gold Oil (Gasoline in this case) Ratio tend to move with the VIX as well. I wonder if the "fear" that the gold ratio implies can be argued as a measure of currency risk fear by US dollar currency users. That is, as the price of oil rises because of price demand inflation or supply disruptions, this implies larger trade deficit imbalances and hence a weaker dollar.


            Finally gld etf net flows vs risk may again be measuring currency crisis fears (this time by investors) ?


            Currently with the increase in domestic production of oil, both the need for oil imports and the trade deficit is decreasing, and so the USD and economy is supported with cheap stable oil prices. The persistent low VIX and stable USD currency (and stable Gold/Oil ratio)reflect this situation of a weakly growing economy as evidenced with high corporate profits and rising GDP ("subsized" with cheap domestic oil, government spending outlays and ZIRP). There is certainly a growing imbalance of wealth in the economy as the rich get richer and wages have not kept up with the corporate profit increase and asset inflation. And it appears that not enough of this asset inflated "wealth" (of which corporate profits (supported buy low yields and high corporate debt is part of), has leaked into the real main street economy to benefit the majority of consumers.

            The big picture appears to be one of a cyclical bull market in side larger secular bear market from the 2000 real peak. That is, on a real adjusted basis the DJIA has not made new highs but there has been some small economic growth since the 2009 bottom. At some point, the economy slows down and VIX and the gold/oil ratio will reflect the slowdown but likely in a co-incident rather then "leading" manner. If markets somehow breakout to all time highs on a "real" basis then we either have real sustainable growth in the economy or a mighty fine bubble. I'm just strawmanning here by trying to marry technical analysis with macro events.

            Comment


            • Re: 2013 Review and 2014 Forecast - Part I: The Last Bubble - Eric Janszen

              I came across this chart of the gold oil ratio today and it made me think of GAGFO. The gold/oil ratio turning point often appears coincident with risk on/risk off points in the market where the SPX sells off. I'm not sure how useful this ratio is because on its own it doesn't give insight into the magnitude of the correction but rather that some correction is expected as investors shift preferences into various assets. And it is hard to tell if the gold ratio is driving SPX or if some other variable is driving both the SPX and Gold/Oil. That said, the gold/oil ratio relationship works better (or is coincident with market turns) over smaller intervals as in the long time frames other factors are dominating the relationship (perhaps EJ theory on triffin/deficits and gold/dollar reserve currency relationship).


              The following is a bit dated, but incidentally, the Gold Oil (Gasoline in this case) Ratio tend to move with the VIX as well. I wonder if the "fear" that the gold ratio implies can be argued as a measure of currency risk fear by US dollar currency users. That is, as the price of oil rises because of price demand inflation or supply disruptions, this implies larger trade deficit imbalances and hence a weaker dollar.


              Finally gld etf net flows vs risk may again be measuring currency crisis fears (this time by investors) ?


              Currently with the increase in domestic production of oil, both the need for oil imports and the trade deficit is decreasing, and so the USD and economy is supported with cheap stable oil prices. The persistent low VIX and stable USD currency (and stable Gold/Oil ratio)reflect this situation of a weakly growing economy as evidenced with high corporate profits and rising GDP ("subsized" with cheap domestic oil, government spending outlays and ZIRP). There is certainly a growing imbalance of wealth in the economy as the rich get richer and wages have not kept up with the corporate profit increase and asset inflation. And it appears that not enough of this asset inflated "wealth" (of which corporate profits (supported buy low yields and high corporate debt is part of), has leaked into the real main street economy to benefit the majority of consumers.

              The big picture appears to be one of a cyclical bull market in side larger secular bear market from the 2000 real peak. That is, on a real adjusted basis the DJIA has not made new highs but there has been some small economic growth since the 2009 bottom. At some point, the economy slows down and VIX and the gold/oil ratio will reflect the slowdown but likely in a co-incident rather then "leading" manner. If markets somehow breakout to all time highs on a "real" basis then we either have real sustainable growth in the economy or a mighty fine bubble. I'm just strawmanning here by trying to marry technical analysis with macro event and am probably way off.

              Comment


              • Re: 2013 Review and 2014 Forecast - Part I: The Last Bubble - Eric Janszen

                EJ --

                It's now August 2014 and a bit more than 6 months since this last piece of analysis. Just wondering what your thoughts are on a major stock market correction sometime in 2014. Thanks!

                Comment


                • Re: 2013 Review and 2014 Forecast - Part I: The Last Bubble - Eric Janszen

                  This question was recently answered in the ask EJ part of the forum:

                  http://www.itulip.com/forums/showthr...129#post284129
                  Last edited by vt; August 08, 2014, 12:57 PM.

                  Comment


                  • x

                    Duplicate post. Deleted.
                    Last edited by dcallaghan89; August 26, 2014, 05:54 PM. Reason: Duplicate post - deleted.

                    Comment


                    • Re: 2013 Review and 2014 Forecast - Part I: The Last Bubble - Eric Janszen


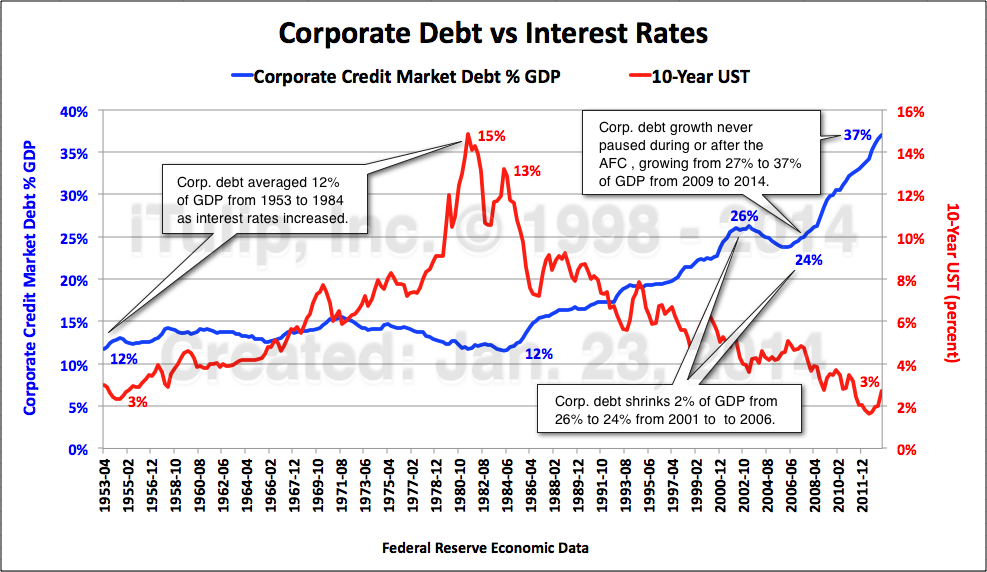
                      EJ - I am hoping you can clarify how to interpret this graph in light of a de-leverd corporate balance sheet (other data I look at). When I dug into the source behind this graph, I believe data selected is "domestic corporate bonds held by non-financial institutions". Is this essentially any regular corporation, excluding banks & insurance comanies, that have been investing in corporate bonds? And is the reason for this that these corporations used to be owners of treasuries but have now moved on to corporate bonds for a higher yield...

                      I am just trying to get my head around who the "non-financial institution is" and why they would own corporate bonds?

                      Comment


                      • Re: 2013 Review and 2014 Forecast - Part I: The Last Bubble - Eric Janszen

                        Originally posted by dcallaghan89 View Post


                        EJ - I am hoping you can clarify how to interpret this graph in light of a de-leverd corporate balance sheet (other data I look at). When I dug into the source behind this graph, I believe data selected is "domestic corporate bonds held by non-financial institutions". Is this essentially any regular corporation, excluding banks & insurance comanies, that have been investing in corporate bonds? And is the reason for this that these corporations used to be owners of treasuries but have now moved on to corporate bonds for a higher yield...

                        I am just trying to get my head around who the "non-financial institution is" and why they would own corporate bonds?
                        Non-financial corporations have been borrowing from the credit markets more heavily than ever, by every measure, since the end of the last recession. The willingness of fixed income investors to accept higher risk for higher yield in a ZIRP world has been driving a trend of rising corporate indebtedness at at stage of the credit cycle, after a recovery, when normally corporate indebtedness is declining.


                        Non-financial Corporations carried debt liabilities in the form of issued bonds of 19% of assets in Q1 2014, up from
                        12% before the recession, and three times the pre-FIRE Economy level of 6.5%.


                        During the last recession, corporate assets declined $4 trillion (< 10%) from $31 trillion to $27 trillion, which caused the ratio of
                        corporate bond debt to assets to rise from 12% to 16% over two years between Q4 2007 and Q3 2009.

                        What happens to this ratio and default rates when interest rates rise, or asset levels fall, or both?

                        Comment


                        • Re: 2013 Review and 2014 Forecast - Part I: The Last Bubble - Eric Janszen

                          Originally posted by dcallaghan89 View Post


                          EJ - I am hoping you can clarify how to interpret this graph in light of a de-leverd corporate balance sheet (other data I look at). When I dug into the source behind this graph, I believe data selected is "domestic corporate bonds held by non-financial institutions". Is this essentially any regular corporation, excluding banks & insurance comanies, that have been investing in corporate bonds? And is the reason for this that these corporations used to be owners of treasuries but have now moved on to corporate bonds for a higher yield...

                          I am just trying to get my head around who the "non-financial institution is" and why they would own corporate bonds?
                          According to the Fed Flow of Funds, corporate debt liabilities resulting from bond issuance reveal a spike in liabilities by every measure, such as a percent of assets as shown below.


                          The ratio of debt to assets grew from 12% before the recession to 16% after as asset levels fell nearly 10% from $31T to $27T over two years from 2007 to 2009.

                          Normally at this point in the credit cycle the ratio of debt to assets is falling due to a leveling off of bond issuance and arising asset levels. However, in a ZIRP world fixed income investors continue to buy higher risk, higher yielding corporate bonds in place of Treasuries, and this shows up as a rising debt to assets ratio.


                          The corporate bond bubble is the most distinct feature of the post-AFC ZIRP era.

                          Comment


                          • Re: 2013 Review and 2014 Forecast - Part I: The Last Bubble - Eric Janszen

                            Originally posted by EJ View Post
                            The corporate bond bubble is the most distinct feature of the post-AFC ZIRP era.
                            So indeed "bubbles" are back and the Fed et al have been successful in reflation efforts. IIRC, you mentioned a long while back the bubble machine was broken and would not be able to be restarted. Obviously it has.
                            In ZIRP/NIRP and QE environment, capital flows become enhanced and "misallocated" causing "bubbles" in a variety of assets. Predicting when it will end w/o inside knowledge of what the CBs and sovereigns are doing is a fools errand IMO as the last 5 years clearly evidence.

                            Who, other than the talking heads on CNBC and Jim Kramer predicted SPX=2000 in 2014? The cheerleaders were right after all ... at least until now ... and maybe till 2016 or 17 or 32, as long as they can keep the CONfidence going. The lies can continue longer than one can remain alive.
                            Last edited by vinoveri; August 26, 2014, 01:03 PM.

                            Comment


                            • Re: 2013 Review and 2014 Forecast - Part I: The Last Bubble - Eric Janszen

                              Originally posted by vinoveri View Post
                              So indeed "bubbles" are back and the Fed et al have been successful in reflation efforts. IIRC, you mentioned a long while back the bubble machine was broken and would not be able to be restarted. Obviously it has.
                              In ZIRP/NIRP and QE environment, capital flows become enhanced and "misallocated" causing "bubbles" in a variety of assets. Predicting when it will end w/o inside knowledge of what the CBs and sovereigns are doing is a fools errand IMO as the last 5 years clearly evidence.

                              Who, other than the talking heads on CNBC and Jim Kramer predicted SPX=2000 in 2014? The cheerleaders were right after all ... at least until now ... and maybe till 2016 or 17 or 32, as long as they can keep the CONfidence going. The lies can continue longer than one can remain alive.
                              The principle followed here since 1998 is that starting at the beginning of the asset price inflation cycle era in 1995 an asset price inflation can only be followed by an asset price collapse, and the macro-economic fallout of an asset price collapse can only be countered by another asset price inflation. This theory was explained to a broader audience in my Harper's article in 2008.

                              Equity Bubble -> Home Mortgage Securities Bubble* -> Corp. Bond Bubble -> ???

                              This asset price inflation -> deflation -> reflation process goes on and on until it can't.

                              The source of asset price inflation and reflation capacity is the unique ability of the U.S. to borrow from its trade partners for free, which trade partners are obligated to continue to lend to the U.S. or suffer catastrophic economic and political consequences at home.

                              The article of this thread proposes that the current asset price inflation may be the last, or maybe not. My upcoming update suggests that the U.S. has a long way to go, owing to isolationist Fortress America energy and geopolitical policy.

                              * Readers may be familiar with the term "toxic asset" but may not know that my April 2006 article on credit risk pollution was the origin of the term, at least so far as I conceived of the idea in March of that year and there are no other references to the concept that precede it.

                              Comment


                              • Re: 2013 Review and 2014 Forecast - Part I: The Last Bubble - Eric Janszen

                                Net Det and Equity composition of the aggregate S&P500...


                                EJ - The confusion I have with this is outlined in my chart above... Net Debt has been consistently declining across all listed S&P500 stocks since the financial crisis.

                                Your explanation sounds to me as if there is rapid growth in bond market credit. The only way I can reconcile such growth, alongside corporate balance sheet de-leveraging (as shown by my chart above), is that not only are balance sheets of listed corporates getting better, but the debt mix is also shifting - from bank debt, to bonds. This is what I am also seeing in Australian listed corporates, especially REITs. The motivation is to move away from bank debt where companies can at best get 3-5 year debt, and increase avg debt tenor by moving in to bond markets. This was a lesson learned the crisis from not having long-term debt to match long-term assets.

                                So in summary, your chart explains how more corporate credit is being issued - but when combined with my chart, it shows that it's a "mix of debt" shift away from bank debt, as opposed to a re-leveraging of the corporate sector.

                                EJ, would you agree/disagree with this explanation? I am really keen to understand where I might be wrong.

                                Your thoughts are much appreciated,
                                Damon
                                Last edited by dcallaghan89; August 26, 2014, 06:52 PM. Reason: Chart fix

                                Comment

                                Working...
                                X