Announcement

Collapse
No announcement yet.

Hope and Fear – Part I: Year of Promise - Eric Janszen

Collapse
X
 
  • Filter
  • Time
  • Show
Clear All
new posts

  • #16
    Re: Income taxes, Opportunity, and Laffer

    Taxes on things that do not benefit society...

    FIRE: Tax the crap out of it and income from it.
    Income Inequality: Tax the crap out of those at the top. Hudson's ideas are fine... a hefty property tax on ALL property, not just land. Tax on stocks, bonds, etc.
    Sugar tax
    Liquor Tax
    Gas Tax
    Junk food tax.
    Inheritance tax
    Luxury goods tax.
    Drug taxes (marijuana, etc)
    Beer tax.
    HFC tax.
    If you are going to address unemployment, you do not tax income. If you want to provide health care, you need to tax unhealthy things.

    We have it ass-backwards. We tax people who work. We do not tax people who push FIRE paper around. Capital gains should be taxed at the highest rates, not the lowest. Interest expenses should never be tax-deductible. Interest income should be taxed high.

    Do you want the population working to survive or borrowing to survive?

    The system is corrupt to the bone. It cannot be tweaked. it must crash and burn.

    Comment


    • #17
      Re: Income taxes, Opportunity, and Laffer

      Your ideas will collapse an economy faster than the mess we are already in. Communism was tried and failed.

      We do need to reform the system, and this starts with removing subsidies to FIRE and other industries that don't work. Smaller more efficient government and less taxation will free up job creation and growth to provide real jobs and increase the middle class. We don't need to subsidize the rich with huge mortgage deductions. $500k or even $300K limits on the size of the mortgage would make this fairer.

      We don't have free market capitalism, we have oligarchic, protected markets for political friends. This is evident in BOTH political parties. Democrats are just as bad as Republicans.
      Clinton and Gore made $100 million after they left office. Obama will probably make more. They're all culpable.

      Comment


      • #18
        Re: Income taxes, Opportunity, and Laffer

        Your ideas will collapse an economy faster than the mess we are already in. Communism was tried and failed.
        OK. Taxes = communism. I get it. You have a pretty broad definition of communism.

        There should be NO mortgage deductions. That only puts money into bankers hands.
        Less taxation? You do realize taxes have gone down for decades, at least for the super rich. These so-called "job creators" have certainly improved conditions for millions of Chinese, but hey, I am not a Chinese peasant. I care about my own.
        Yes, all subsidies should be removed, except where needed to improve the country over the long term.

        But, yes, i would like it all to crash.

        Comment


        • #19
          Re: Stable credit and money supply vs 12%/year

          1) Why couldn't the money supply/credit level be stable, that is neither increasing or decreasing?
          Originally posted by FRED View Post
          FREDs will respond to questions that FREDs can answer.

          Because credit demand is a function of demand.
          Is the idea that credit creation or destruction is self reinforcing, that the system is a positive feedback loop?

          If so, couldn't the interest rates be used as a stabilizing mechism: credit growing too fast, raise the rates, credit decreasing lower the rate?

          The idea behind "the chicago plan revisited" was a different banking system, without leverage, that would stabilize the money supply.

          Comment


          • #20
            Re: debt graph legend needs fixing!

            Originally posted by ProdigyofZen View Post
            No the purple line is Financial Sector debt like it says and the blue line (which is at the bottom and curves up) is Fed Gov debt.

            It just doesnt look purple because you have green, red and blue shades on top of it. I can clearly see through the Red shade and tell the line underneath is purple.
            Exactly. The purple line is financial sector debt. The legend at the TOP of the page says it is government debt.

            Comment


            • #21
              Re: debt graph legend needs fixing!

              Originally posted by Polish_Silver View Post
              Exactly. The purple line is financial sector debt. The legend at the TOP of the page says it is government debt.
              No, it doesn't. Believe me, the purple line at the top of the chart is next to "Financial Sector Debt Outstanding Percent GDP."

              Are you sure you don't have a color blindness of some sort? That's a sincere question. It can happen and make differentiating some colors quite difficult, if not impossible.

              Comment


              • #22
                Re: debt graph legend needs fixing!

                or a web browser that displays colors differently or an old monitor or a non-standard color scheme on your OS

                Comment


                • #23
                  Re: debt graph legend needs fixing!

                  Originally posted by aaron View Post
                  or a web browser that displays colors differently or an old monitor or a non-standard color scheme on your OS
                  Good point. Something's amiss, apparently.

                  Comment


                  • #24
                    Re: Stable credit and money supply vs 12%/year

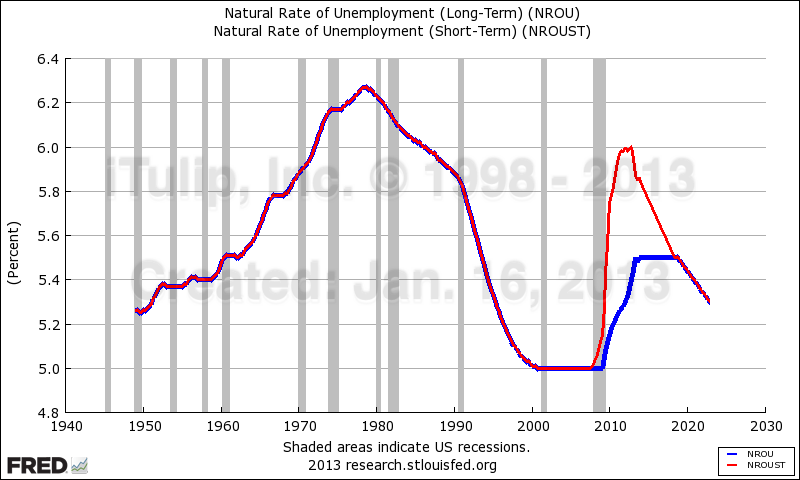
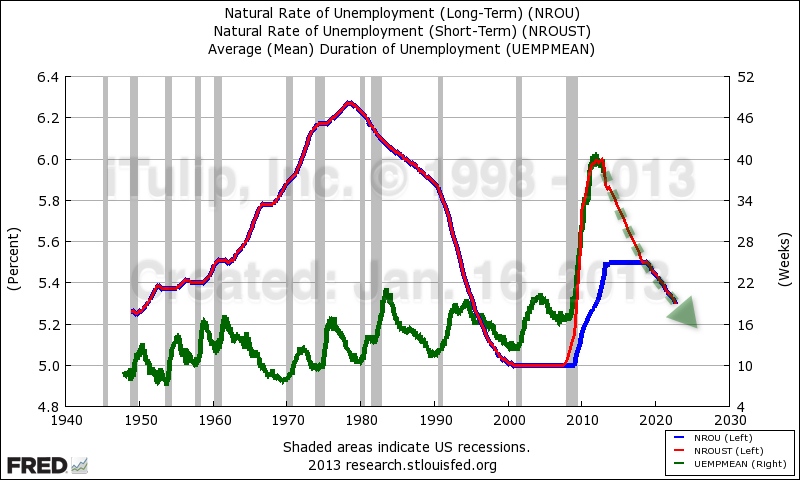
                    If you want to know where the Fed's head is at on policy timing, get a load of the latest NAIRU or Natural Inflation Rate of Unemployment projections.


                    If you are wondering how they arrived at 6% for long-term NAIRU we fit Mean Duration of Unemployment on the right hand scale and add a dashed green arrow to indicate the Fed's implied projection for a decline in Mean Duration of Unemployment.


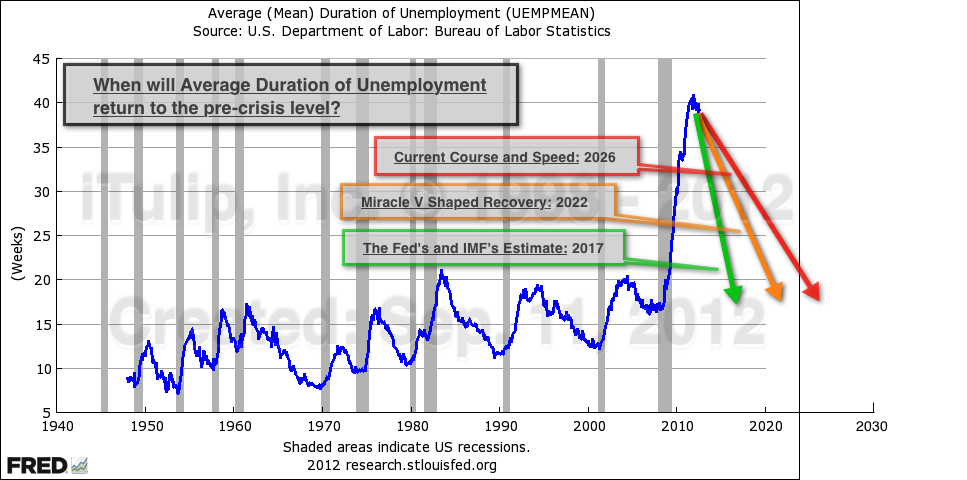
                    The Fed expects a return to a healthy, pre-crisis level by, say, the year 2022. Eagle eyed readers will recall a similar projection made by us last September based on other Fed and also IMF data.


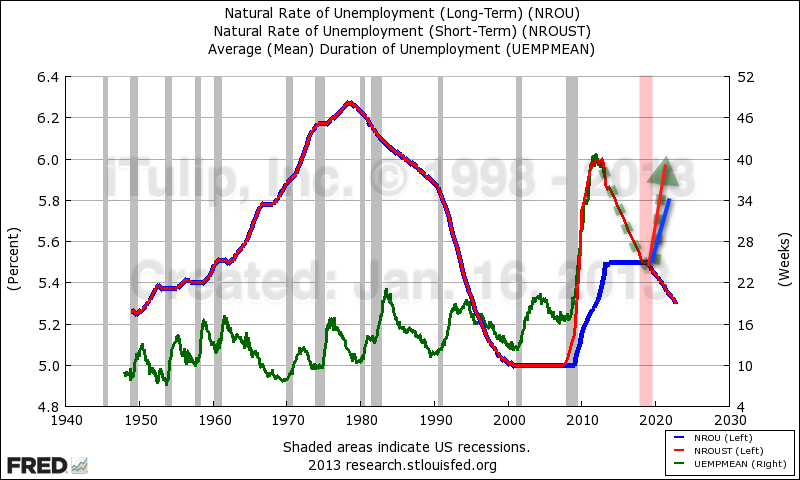
                    I don't think any of these projections will come to pass. The NAIRU-based projection for a return to pre-crisis unemployment by 2022 assumes that the U.S. economy will grow continuously without another recession for 13 years from 2009. The longest stretch of recession-free growth that the U.S. has experienced was between 1990 and 2001, and as I've argued that boom was considerably extended by a stock market bubble. In the unlikely event that the next recession can be put off until 2018, NAIRU will make a U-turn as Median Duration of Unemployment rises anew.


                    With interest rates already at zero the Fed will have few options for monetary stimulus, leaving fiscal stimulus to the work of cushioning the blow to the economy. Along with rising unemployment comes rising budget deficits as tax revenues fall and outlays to cover unemployment insurance, food stamps, and other social supports expands.

                    This has always been my beef with the Fed for allowing the stock and housing bubbles to occur in the first place. The Fed's deflation fighting papers laid out a clear plan for dealing with the immediate crisis but they didn't think through the long-term implications. Once an economy is this damaged it effectively needs a complete reset to get it back on track again. The U.S. economy got a reset in the form of WWII last time it got stuck in an output gap this way. It's not at all obvious how we're going to get out of it this time.


                    Do I understand correctly that their estimate of NAIRU does not take cyclical labor force dropouts in account? In other words, when they say 6%, NAIRU might be reached when unemployment is 6% and there are 4% discouraged workers?

                    My understanding has been that when discouraged workers are accounted for, there has been virtually no improvement in labor market conditions. Is this in line with itulip's views?

                    Is it possible to produce a graph that accounts for discouraged workers (using pre-crisis forecasts of the future labor force participation rate as an estimate of how many dropouts are due to the recession and output gap)?
                    "It's not the end of the world, but you can see it from here." - Deus Ex HR

                    Comment


                    • #25
                      Re: Stable credit and money supply vs 12%/year

                      Originally posted by NCR85 View Post


                      Do I understand correctly that their estimate of NAIRU does not take cyclical labor force dropouts in account? In other words, when they say 6%, NAIRU might be reached when unemployment is 6% and there are 4% discouraged workers?

                      My understanding has been that when discouraged workers are accounted for, there has been virtually no improvement in labor market conditions. Is this in line with itulip's views?

                      Is it possible to produce a graph that accounts for discouraged workers (using pre-crisis forecasts of the future labor force participation rate as an estimate of how many dropouts are due to the recession and output gap)?

                      http://danielamerman.com/resources/SumDepress.html

                      Comment


                      • #26
                        Re: Stable credit and money supply vs 12%/year

                        Originally posted by Chris Coles View Post
                        I have a few more analyses of it, most of which come to the conclusion that when cyclical* labor force dropouts are accounted for, the unemployment situation has gotten worse, not better, since 2009:

                        http://www.epi.org/publication/ib333...eat-recession/

                        http://globaleconomicanalysis.blogsp...icipation.html

                        Lesson learned: U-3 unemployment is junk. Even U-6 ignores a lot of unemployed.

                        Itulip often refers to "mean duration of unemployment" and "the long term unemployed", but I assume these statistics also treat discouraged workers as not unemployed? How can "mean duration of unemployment" have stalled when the unemployment conditions as a whole are not improving? You'd expect to see that line go straight up along it's 2009-2011 trend line.

                        * in the sense of "caused by the recession and output gap"
                        "It's not the end of the world, but you can see it from here." - Deus Ex HR

                        Comment


                        • #27
                          Weird--now colors are correct!

                          Today the colors jibe. I don't know what changed, but now the graph looks correct.

                          Comment


                          • #28
                            Re: Income taxes, Opportunity, and Laffer

                            beer tax .... now you've gone too far mr aaron

                            Comment


                            • #29
                              Re: Stable credit and money supply vs 12%/year

                              Originally posted by NCR85 View Post

                              Itulip often refers to "mean duration of unemployment" and "the long term unemployed", but I assume these statistics also treat discouraged workers as not unemployed? How can "mean duration of unemployment" have stalled when the unemployment conditions as a whole are not improving? You'd expect to see that line go straight up along it's 2009-2011 trend line.

                              * in the sense of "caused by the recession and output gap"
                              I wonder how many have turned to the underground economy. There's tons of work that goes undocumented out there. And it can be very profitable.

                              Comment


                              • #30
                                Re: Stable credit and money supply vs 12%/year

                                Originally posted by Polish_Silver View Post
                                Is the idea that credit creation or destruction is self reinforcing, that the system is a positive feedback loop?

                                If so, couldn't the interest rates be used as a stabilizing mechism: credit growing too fast, raise the rates, credit decreasing lower the rate?

                                The idea behind "the chicago plan revisited" was a different banking system, without leverage, that would stabilize the money supply.
                                You are talking about this http://www.imf.org/external/pubs/ft/wp/2012/wp12202.pdf

                                I have yet to read through it but I can say I have met Michael Kumhoff personally. I was with him at an event for 2 days last year where he gave a speech etc etc.

                                He did mention that his Chicago Plan Revisited was a better way to go.

                                I had time to chat with him at some length privately.

                                Comment

                                Working...
                                X