 |
by Eric Janszen
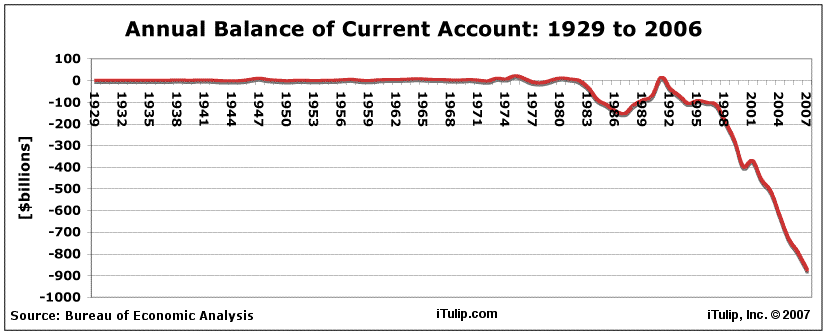
In my last comment on the sliding U.S. dollar, we compared the U.S. current account deficit to deficits and surpluses of other countries. The U.S. has by far the largest current account deficit, and this is putting pressure on the dollar. This time we look at U.S. current account balance over time. We see that the balance underwent a fundamental change around 1970 after forty years of stability, experienced turbulence in the 1980s, and went into steep decline starting in 1991.
Balance of Current Account
The current account has three main components. Trade in goods and services is the largest. The other two components–net investment income and net unilateral transfers–have a much smaller effect on the overall balance in the account. The balance of trade (exports minus imports) accounts for virtually all of the current-account balance.
The chart below shows the balance on the U.S. current account, National Income and Product Accounts (NIPA): net lending or net borrowing (-), NIPAs: Foreign Transactions in the National Income and Product Accounts: Billions of dollars (annual) since 1929. A major trend change occurred after the U.S. went off the gold standard on onto the treasury dollar standard in 1971. As you can see, the U.S. current account balance had been close to zero from 1929 until the early 1970s, fell and rose in the 1980s, then turned increasingly negative since 1991.

Meaning of Divergence from Historical Trend in 1980
The current-account balance measures the difference between what residents of the U.S. collectively earn and what they spend.
If a nation's income is greater than its spending, the nation has produced more goods, services, and construction than its residents have purchased. The current-account balance is in surplus and foreigners purchased the difference. This is the case, for example, for Germany, which had a current account surplus of $148 billion in 2006 with a GDP of $2.9 trillion.
When spending exceeds income, the nation purchases more than its residents have produced. The difference is purchased from foreigners, and the current-account balance is in deficit. This has been the case for the U.S. since 1991, but the trend change started in 1980. The U.S. had a current account balance of negative $794 billion in 2006 against a GDP of $13 trillion.
The falling trend in the current-account balance of the U.S. since 1980 reflects the fact that U.S. residents collectively spent increasingly more than income.
Income is either consumed or saved, and spending is either for consumption or investment. The current-account balance therefor measures the extent to which the U.S. residents together save more than they invest. The fall in the current-account balance since 1980 has occurred because saving fell increasingly short of the amount necessary to finance domestic investment. The difference has to be borrowed from foreigners.
How the Savings Deficit is Financed
According to the Congressional Budget Office:
Current-account imbalances require financing. To pay for the extra spending, the nation must borrow from foreigners or sell them some assets. In other words, a current-account deficit requires a net inflow of capital from abroad; a surplus requires an outflow of capital to foreigners. Between 1991 and 2003, cumulative net borrowing from abroad raised the nation's net obligations to the rest of the world by $2.1 trillion, to a record $2.4 trillion, or 22 percent of gross domestic product (GDP).
How does this affect the dollar?The exchange rate of the dollar–the price of the dollar in terms of other currencies–both reflects and influences trade flows and capital flows. The dollar exchange rate directly affects trade flows by affecting the dollar price of foreign goods and services and the foreign price of U.S. goods and services. When the dollar exchange rate appreciates, the dollar buys more units of foreign currency, which lowers the prices of foreign goods and services in dollar terms and encourages imports. At the same time, a higher dollar exchange rate raises the prices of U.S. goods and services in terms of foreign currencies and discourages exports.
The dollar exchange rate influences capital flows by affecting foreigners' expected rate of return on dollar assets. When the dollar exchange rate has appreciated to a high level, it becomes more likely to fall than to continue rising, and the value of dollar assets in terms of foreign currencies becomes more likely to fall than to rise. Consequently, once the dollar has appreciated for a sustained period, dollar assets could be less attractive to foreign investors, which would reduce capital inflows to the United States. Of course, the opposite happens when the dollar exchange rate has fallen for a sustained period.
The dollar exchange rate adjusts in response to changes in foreign investors' demand for dollar assets and in trade flows, helping to keep the two consistent. For example, when the demand for goods and services in the United States rises above national income–that is, when the nation is running a current-account deficit and requires foreign financing–the dollar generally has to fall to persuade foreign investors to hold more dollar assets. On the other hand, when foreign demand for dollar assets falls, the dollar exchange rate generally falls, discouraging U.S. demand for imports and stimulating foreign demand for exports.
What are the implications for the dollar?The dollar exchange rate influences capital flows by affecting foreigners' expected rate of return on dollar assets. When the dollar exchange rate has appreciated to a high level, it becomes more likely to fall than to continue rising, and the value of dollar assets in terms of foreign currencies becomes more likely to fall than to rise. Consequently, once the dollar has appreciated for a sustained period, dollar assets could be less attractive to foreign investors, which would reduce capital inflows to the United States. Of course, the opposite happens when the dollar exchange rate has fallen for a sustained period.
The dollar exchange rate adjusts in response to changes in foreign investors' demand for dollar assets and in trade flows, helping to keep the two consistent. For example, when the demand for goods and services in the United States rises above national income–that is, when the nation is running a current-account deficit and requires foreign financing–the dollar generally has to fall to persuade foreign investors to hold more dollar assets. On the other hand, when foreign demand for dollar assets falls, the dollar exchange rate generally falls, discouraging U.S. demand for imports and stimulating foreign demand for exports.
The negative and declining U.S. current account balance results from both positive and negative factors, some persistent and other non-repeatable. Optimists focus on the positive factors, such as higher productivity growth and relatively rapid growth of income in the U.S. compared to other major industrial countries, which is causing foreign investors to purchase U.S. financial assets (e.g., stocks and bonds) over other nations'. Pessimists note that much of the recent growth in demand for U.S. financial assets was due to one-off events, such as emerging Asian countries, especially China, increasing their foreign exchange reserves and increasing the demand for dollars as a result following the 1997-1998 Asian currency crisis.
My view is that the dollar's recent decline, and the corresponding rise in the price of gold, is due to two factors. One, the period of build-up of foreign reserves by Asian countries has ended; that key source of demand for U.S. financial assets and dollars has dried up. Two, the U.S. Weak Dollar policy is raising inflation to unacceptable levels and hurting export income growth among U.S. trade partners. In response, these nations cannot take actions to depreciate their currencies, such as by lowering interest rates, as they did in the previous cycle starting in 2004 because that will cause domestic inflation to rise further. Instead, the trend of increased trade among nations (multilateral growth) versus between nations and the U.S. (U.S.-centric growth), using the euro as the currency of international exchange, will accelerate. That trend, already in place before the unofficial Weak Dollar Policy of the Paulson Treasury and Bernanke Fed was implemented earlier this year, will accelerate under the unofficial Weak Dollar policy.
What's been happening to the dollar recently?
As the housing bubble correction proceeds, the U.S. has little choice but to continue to use currency depreciation to stimulate the economy, that is, follow an unofficial Weak Dollar Policy. In fact, the primary challenge for the Paulson/Bernanke team is not try to make the lack of options not so obvious. The impact has been moderately inflationary so far, as evidenced by rising oil and gold prices, but not as inflationary as alternative approaches would be, such as lowering the Fed funds rate.
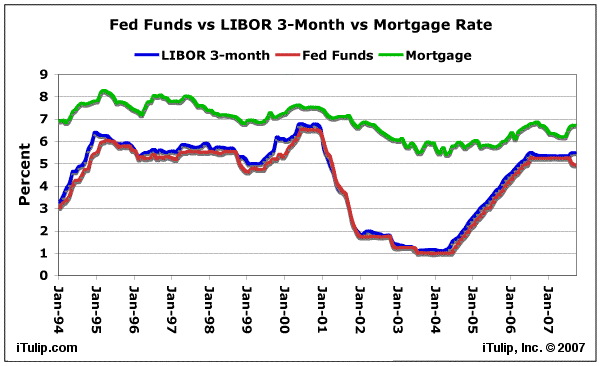
Both LIBOR, on which adjustable rate mortgages are based, and the effective fixed mortgage rate increased after the Fed's September 2007 cut in the Fed funds rate. They have moderated somewhat since then, but it appears that the bond markets as well as commodity markets are tending to price in the inflationary impact of rate cuts. This suggests that cutting short term interest rates will not spur the housing market by lowering bond yields and thus borrowing costs but make have the opposite effect. This divergence between the Fed Funds rate and long term rates is unusual, as the chart below going back to 1994 shows, reflecting unusual inflationary biases in the markets.

Recently, foreigners have been selling dollars by selling U.S. treasury bonds.
Japan and China flee from U.S. dollars (Oct. 18, 2007)
Data from the U.S. Treasury showed outflows of $163bn from all forms of U.S. investments. "These numbers are absolutely stunning," said Marc Ostwald, an economist at Insinger de Beaufort.
Asian investors dumped $52bn worth of U.S. Treasury bonds alone, led by Japan ($23bn), China ($14.2bn) and Taiwan ($5bn). It is the first time since 1998 that foreigners have, on balance, sold Treasuries.
Mr Ostwald warned that U.S. bond yields could start to rise again unless the outflows reverse quickly. "Woe betide U.S. Treasuries if inflation does not remain benign," he said.
Rates for conventional mortgages are tied to longer term Treasury bonds, so either way–whether the Fed lowers short term interest rates or the Treasury continues to use the Weak Dollar Policy to stimulate the economy, both polcies are inflationary. It appears that an already struggling housing market faces rising mortgage rates over the period of increasing housing market weakness. This will tend to accelerate the economic slowdown in the U.S., which to the extent that it is U.S.-centric, will remove one of the key incentives for foreign investors to fund the U.S. savings shortfall and put further pressure on the dollar.Data from the U.S. Treasury showed outflows of $163bn from all forms of U.S. investments. "These numbers are absolutely stunning," said Marc Ostwald, an economist at Insinger de Beaufort.
Asian investors dumped $52bn worth of U.S. Treasury bonds alone, led by Japan ($23bn), China ($14.2bn) and Taiwan ($5bn). It is the first time since 1998 that foreigners have, on balance, sold Treasuries.
Mr Ostwald warned that U.S. bond yields could start to rise again unless the outflows reverse quickly. "Woe betide U.S. Treasuries if inflation does not remain benign," he said.
Any way you look at it, the dollar is going to continue to decline long term until a major structural re-adjustment to the U.S. economy and global economy occur. The Weak Dollar policy can only delay the inevitable: the U.S. must close the savings gap by increasing its savings rate. It is not clear how this can be accomplished now that we are passed the top of a credit and economic cycle; the best time to work on making that adjustment was during the recovery since 2004.
Such adjustments if made by markets versus by policy are rarely benign events. Hedging the continued decline of the dollar with gold and/or a basket of sovereign foreign bonds as we have recommended since August 2001 still makes sense.
Next we discuss another additional factor contributing to dollar weakness: the U.S. fiscal deficits and unfunded liabilities.
iTulip Select: The Investment Thesis for the Next Cycle™
__________________________________________________
For a book that explains iTulip concepts in simple terms see americasbubbleeconomy
For the safest, lowest cost way to buy and trade gold, see The Bullionvault
To receive the iTulip Newsletter or iTulip Alerts, Join our FREE Email Mailing List
Copyright © iTulip, Inc. 1998 - 2007 All Rights Reserved
All information provided "as is" for informational purposes only, not intended for trading purposes or advice. Nothing appearing on this website should be considered a recommendation to buy or to sell any security or related financial instrument. iTulip, Inc. is not liable for any informational errors, incompleteness, or delays, or for any actions taken in reliance on information contained herein. Full Disclaimer


Comment