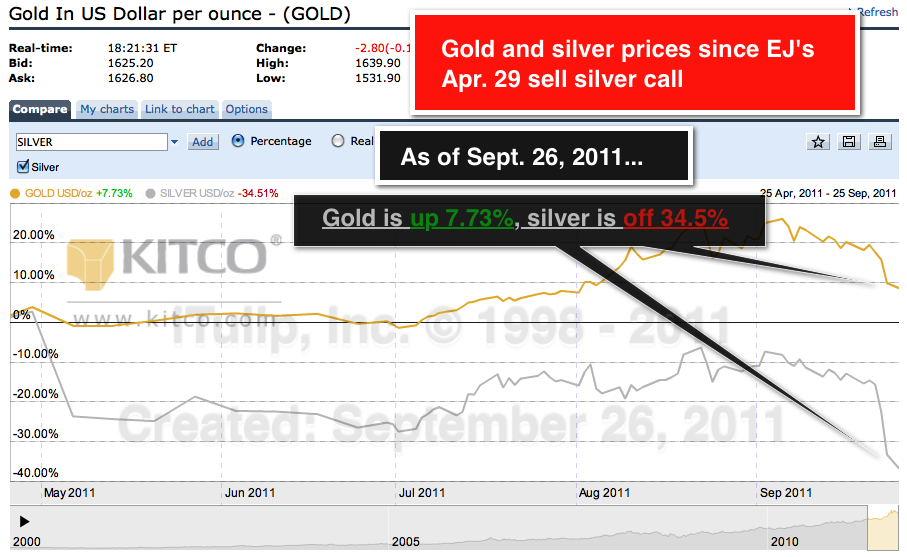
Re: Catch a falling silver knife - Notes on EJ's April 29 silver sell call
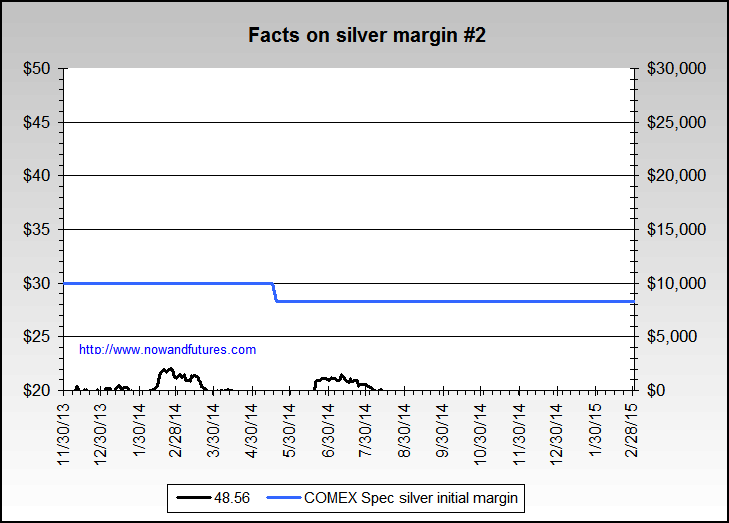
Yes, thank you! And if I may ask, any chance you can show a graph showing the price of silver in USD overlayed with the Margin Hikes? The idea is to get a clear picture of what IS actually crashing the price of silver.
Feel free to overlay other inputs if you suspect there's other major factors at play (i.e. USD index, Silver Options Expiration dates, silver supply/demand, Timing of Fed/Gov Stimulus plans (risk on/risk off). It would also be interesting to see a similar chart for gold, because the initial theory was (paraphrase) "gold will not be affected by margin hikes nearly as much as silver, because gold is in 'strong & lard hands' aka: central banks".
I could see these type of charts potentially translating into a significant trading methodology into the next year or two. While it may be extremely difficult to project timing and size of future margin hikes, one thing is clear: There's some 80% left until margin = 100%, and there is no more leverage in the system. So if to get to ~17% margin we passed through 2 major margin hikes that crashed silver ~25 to 40%, then perhaps we can extrapolate that we are 1/5th of the way until we see 100% margin. In other words, at least several more major margin hikes are left. So perhaps silver ON AVERAGE until Q4 2013 may end up at below $30 as per iTulip, but a zoom in of what may happen may look something like the below (red line) which can offer additional trading opportunities. And if margin hikes are discovered to be the major catalyst pushing silver down, once we run out of margin hikes (i.e. margin = 100% = 1:1 silver price:contract), then why wouldn't price rocket up based on supply/demand or other fundamentals?

NOTE: My red line in the top/right chart with 'real silver price' was hand drawn, and is not based on any real data... just trying to show very roughly how I suspect margin hikes will impact the price of silver going forward.
CME isn't necessarily just playing catch-up. Margin hikes are being justified based on excessive speculation that seem to be occuring over recent short periods of time, not from 2001 to 2008.
Originally posted by rogermexico
View Post
Feel free to overlay other inputs if you suspect there's other major factors at play (i.e. USD index, Silver Options Expiration dates, silver supply/demand, Timing of Fed/Gov Stimulus plans (risk on/risk off). It would also be interesting to see a similar chart for gold, because the initial theory was (paraphrase) "gold will not be affected by margin hikes nearly as much as silver, because gold is in 'strong & lard hands' aka: central banks".
I could see these type of charts potentially translating into a significant trading methodology into the next year or two. While it may be extremely difficult to project timing and size of future margin hikes, one thing is clear: There's some 80% left until margin = 100%, and there is no more leverage in the system. So if to get to ~17% margin we passed through 2 major margin hikes that crashed silver ~25 to 40%, then perhaps we can extrapolate that we are 1/5th of the way until we see 100% margin. In other words, at least several more major margin hikes are left. So perhaps silver ON AVERAGE until Q4 2013 may end up at below $30 as per iTulip, but a zoom in of what may happen may look something like the below (red line) which can offer additional trading opportunities. And if margin hikes are discovered to be the major catalyst pushing silver down, once we run out of margin hikes (i.e. margin = 100% = 1:1 silver price:contract), then why wouldn't price rocket up based on supply/demand or other fundamentals?

NOTE: My red line in the top/right chart with 'real silver price' was hand drawn, and is not based on any real data... just trying to show very roughly how I suspect margin hikes will impact the price of silver going forward.
Maybe that would tell us something, as it seems to me this jsut shows the CME playing catch-up to the 200% price rise.


Comment