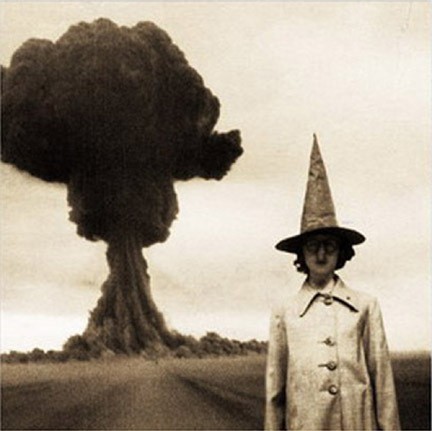
Inflation versus Deflation Tournament Game 3 - Part I: The endless saga continues
"Those who cannot remember the past are condemned to repeat it." - George Santayana
Deflation is back in the headlines. Quantitative easing (QE) is the call.
- Can the government and the Fed keep the money supply growing and prevent deflation?
- Is the deflation a real threat?
- How much QE is required?
- Or is QE irrelevant?
- Double-dip recession or staggering recovery?
- Gee, can’t we just depreciate the dollar again?
- From the Complaints bin: Hey, where’s the inflation you forecast?
- Stealth inflation. Deal with it.
Will the Fed hit the QE launch button soon to head off impending deflation? The question makes two assumptions. One, that the Fed faces a clear and present deflation threat. Two, that QE is an important policy tool to fight deflation. We find clues to the answers in the outcome of the previous two games of the now 12-year-old deflation versus disinflation tournament.
Inflation versus Deflation: Game 1 (1998 to 2001)
Newcomers to the deflation versus inflation debate tournament may be unaware that Game 1 of the debate occurred in the late 1990s. Many economic forecasters were convinced that the collapse of the NASDAQ market bubble was certain to produce a 1930s runaway debt deflation, as first described after the fact by Irving Fisher in his DEBT-DEFLATION THEORY OF GREAT DEPRESSIONS, 1934 appeared to be in full swing in the closing quarter of the year 2000:
Starting from a condition of over-indebtedness, once the process of debt liquidation gets underway after a private credit market shock such as occurred in 1930, “…each dollar of debt still unpaid becomes a bigger dollar, and if the over-indebtedness with which we started was great enough, the liquidation of debts cannot keep up with the fall of prices which it causes. In that case, the liquidation defeats itself. While it diminishes the total number of dollars owed, it may not do so as fast as it increases the value of each dollar owed. “Then, the very effort of individuals to lessen their burden of debts increases it, because of the mass effect of the stampede to liquidate in swelling each dollar owed. Then we have the great paradox which, I submit, is the chief secret of most, if not all, great depressions: The more the debtors pay, the more they owe. The more the economic boat tips, the more it tends to tip. It is not tending to right itself, but is capsizing.
Pierre L. Siklos of Wilfrid Laurier University in What is Deflation? offers a modern definition, improving on the inventor:Deflation is a persistent fall in some generally followed aggregate indicator of price movements, such as the consumer price index or the GDP deflator. Generally, a one-time fall in the price level does not constitute a deflation. Instead, one has to see continuously falling prices for well over a year before concluding that the economy suffers from deflation.
I argued starting in 1998 that the risk of “a persistent fall in some generally followed aggregate indicator of price movements” was well understood by the Greenspan Fed. The central bank planned radical reflation measures to prevent it. As a result, we’d get a brief period of deflation known as disinflation in the economics literature. The debate is over four possible short-term and long-term outcomes of asset bubbles and reflations:
- Deflation (reflation fails and disinflation turns into runaway deflation ala Fisher’s definition)
- Disinflation (reflation succeeds after a brief period of deflation)
- High inflation (reflation succeeds too well and leads to high inflation but not hyperinflation)
- Hyperinflation (reflation succeeds too well and leads to runaway inflation)
My short-term forecast for each post-bubble period has been for disinflation with a long-term forecast of high inflation after the economic conditions that created the asset bubbles comes to a head.
My 1998 short-term post tech bubble disinflation forecast was mostly but not entirely correct.
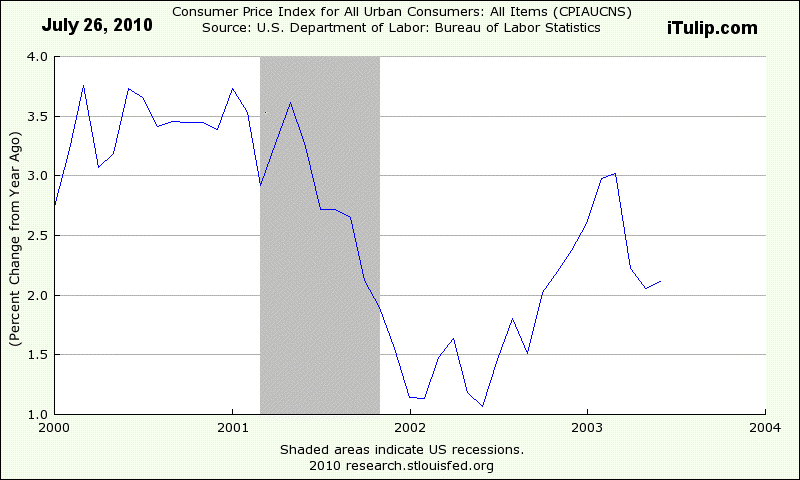
As it turned out, we didn’t get any deflation at all, brief or otherwise. The disinflation was of the falling inflation variety rather than a period of negative inflation.
For Game 1, score one for the believers in the power of an aggressive central bank operating without the constraints that existed during the 1930s in the U.S. Not only did the Greenspan Fed halt the debt deflation process but maintained low rates and loose lending standards so as to give rise to the housing, commercial real estate, and private equity bubbles.
The economics blogging community has expanded vastly since Game 1 of the inflation versus deflation debate tournament began in 1998. The outcome and lessons of the first debate are either unknown to newcomers or has been largely been forgotten. Too bad because that experience taught us that in the absence of the 1930s circumstance of fixed exchange rates and a philosophy of allowing debt deflation to run its natural course, central banks can and will create sufficient liquidity to prevent a disinflation from turning into deflation. The lesson applied to Game 2.
Inflation versus Deflation: Game 2 (2005 to 2009)
The inflation versus deflation debate re-appeared three years into the housing bubble that started in 2002 as observers began to worry about the aftermath. In 2005 I wrote “Debtor Nations Dream of Deflation” for AlwaysOn and made a presentation to Trident Capital that forecast a large-scale credit and financial crisis resulting from mortgage credit risk to arrive “within two to three years.”
As late as early 2008, the assertion that a massive recession was certain to follow from the aftermath of the housing bubble was still debated by mainstream economists. Here I am in January 2008 debating a Chicago School economist on the coming recession that began the month before but was not officially announced until a year alter, after the Presidential elections.
Anticipating a recession so severe as to require New Deal type stimulus programs to pull the economy out of a death spiral, I hopefully suggested energy infrastructure development programs that promised a return on investment rather than one-off jobs programs that add to the already untenable liabilities on the national balance sheet. The economist debating me held the view that bubbles are good. You don’t hear that much anymore.
Yet even though I forecast an ugly recession I expected only a brief period of deflation between the time the panic started and the time Fed and fiscal reflation kicked in. The long-term forecast remains stagflation with episodes of disinflation until, eventually, the tools used to prevent disinflations from turning into deflation lead to a debt and dollar crisis.
I argued that reflation was going to put a floor on commodity and wage prices while demand continued to stagnate due to persistent high unemployment. The result: relatively high input costs, especially energy, for producers that they cannot pass on the consumers. I understand the skepticism about my long-term forecast, that inflation should be showing up in the aggregate data by now, and we’ll get to that question shortly in this analysis, but the fact is that disinflation not deflation occurred and for the reasons I explained.
The U.S. economy never experienced deflation during The Great Recession. The peak of deleveraging in early 2009 was the moment when the deflation forecasters were most certain that they’d gotten it right and I’d gotten it wrong. The charts below settle the argument once and for all.
The chart below shows CPI inflation for two periods, from January 1929, about a year before the start of The Great Depression, and January 2006, about a year before the start of The Great Recession.
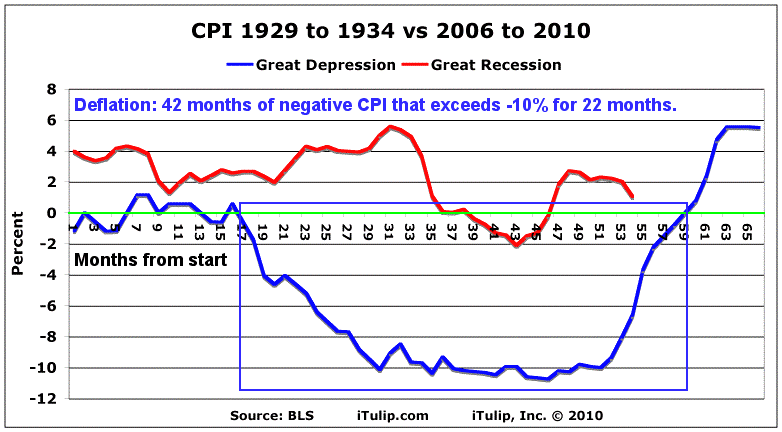
As you can see, in the early 1930s deflation far exceeded the one-year period of negative inflation that meets the definition of deflation. Note that consumer prices fell for nearly four years at the start of The Great Depression, with deflation reaching -10% and staying there for close to two years.
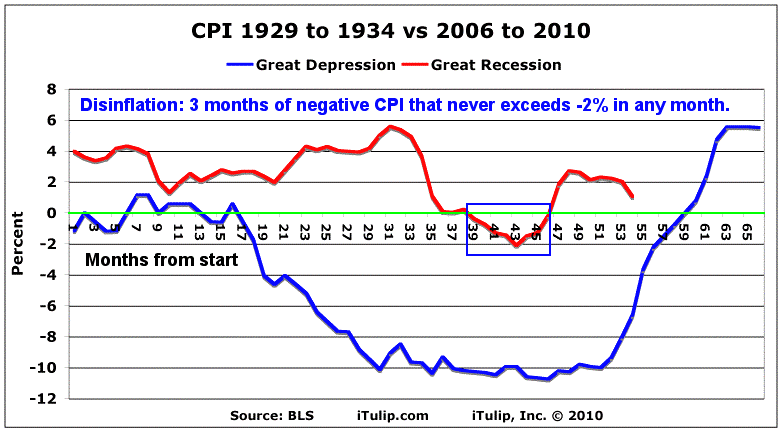
The disinflation of The Great Recession as we forecast here in 2006, by contrast, lasted only three months and did not exceed -2% in any month.
The analysts who predicted deflation were wrong, but oddly the argument over the outcome of the debate persists. A thunderstorm is not a hurricane. The the score after 10 years of bubble booms and busts is: disinflation 2, deflation 0.
Of course, the Great Depression didn’t stop when deflation ended in 1933 three and a half years into the decade-long depression that most historians will tell you didn’t end until the start of WWII in 1940.
Japan’s economy continues to drift in and out of periods of disinflation and inflation 15 years after its stock and housing bubbles collapsed.
From my perspective, writing on this topic since 1998, the financial crisis of 2008 was a continuation of the financial and economic crisis of 2001 and 2002 that was cut short by aggressive monetary policy and lax lending standards that created the housing, private equity, and other asset bubbles.
If you buy into my theory, the implication of the “recovery” we are enjoying today, such as it is, should be obvious: once this period of reflation fails, an even greater crisis awaits as the combined effect of the 2001 to 2003 and 2008 to 2010 reflations creates a public credit and money crisis.
I’m frequently asked by the media if I think there will be another bubble. At this point I don’t think so. In any case, our economy can’t survive another bubble, crash, and bailout that ratchets public debt to $2 trillion or more per year.
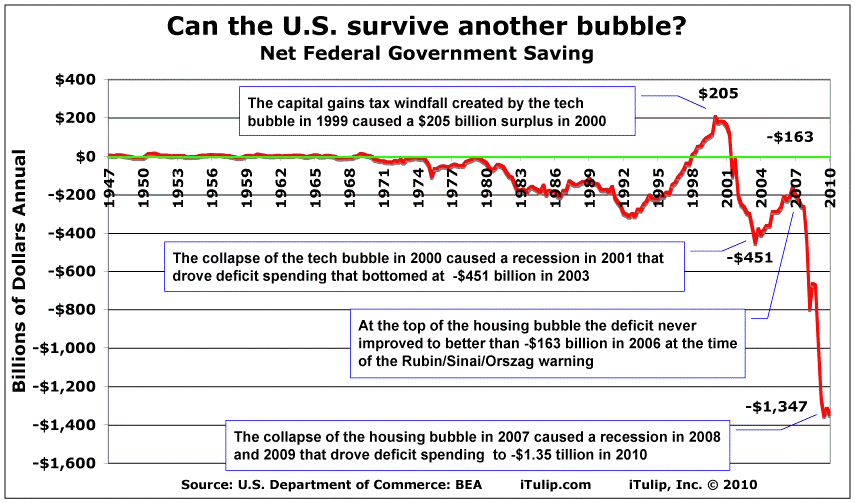
Policy can halt a deflation process but not magically return the economy to sustainable growth. This is extremely important to keep in mind as we put Games 1 and 2 of the inflation debate behind us and move on to Game 3.
Inflation versus Deflation: Game 3 (2010 to ???)
Those of us who understood what the Fed was capable of expanding its balance sheet "infinitely" as Greenpan liked to say won the first two games, but is the tournament over? Might Game 3 go differently?
To begin to answer this question, let’s compare the three key periods of economic periods crisis to get our heads around the time scale.
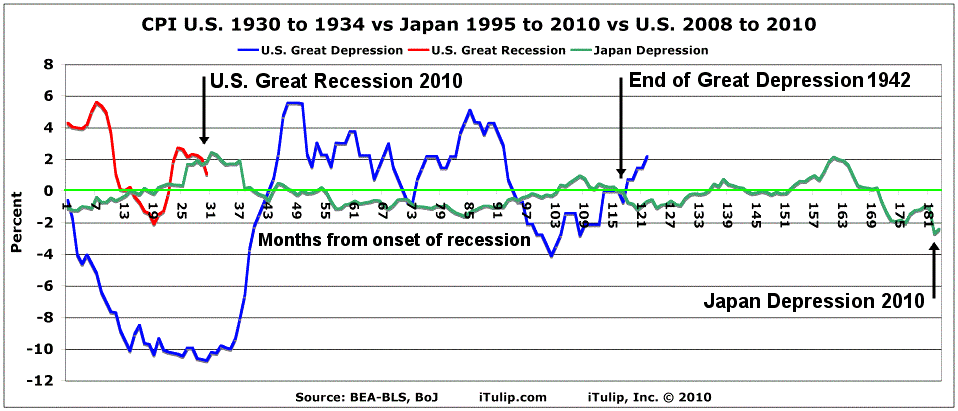
The Great Depression lasted about ten years. A massive, one time depreciation of the dollar against gold in 1933 followed by modest fiscal stimulus ended the deflation for four and a half years until politically motivated austerity measures brought deflation and recession back in 1938. The Depression as measured by persistent deflation didn’t end for good until a year into WWII. The massive government works program called war ended The Great Depression by permitting deficit and inflation levels that at the time could only be politically justified in time of war.
Starting from 1995, Japan’s Depression has lasted five years longer but never produced an extended period of deep deflation. With no period of deflation exceeding -2%, Japan’s “deflation” is in fact a series of alternating periods of disinflation and mild inflation.
Japan has recently taken a turn for the worse. Stuck between dependence on fiscal stimulus for growth and a shrinking tax base due demographics, matters will come to a head there within a few years. A friend who runs a hedge fund in NYC is worried “Japan lights up like a roman candle” within three years when I spoke to him last week. In a global economy as tightly coupled through trade and financial markets, the potential impact of a crisis among U.S. creditors Japan and China may be a sudden withdrawal of lending that produces a fiscal crisis here at home.
If you take away nothing else from the chart above it’s that we in the U.S. are clearly in the early years of a long and difficult period. After a successful reflation in 2009, the early stages of a broad-based inflationary process are in train, punctuated by periods of disinflation.
Inflation, you say? Even our astute readers are having trouble seeing the early signs.
From the Complaints bin: Hey, where’s the inflation you forecast?
Readers are going to need to pay extra close attention to this section because the inflation that we forecast has arrived right on schedule. However, the transition from a low inflation to a high inflation environment does not arrive like a bolt of lightening but rather slowly and subtly.
Here is our inflation forecast from the end of 2008:
Advice to readers: take advantage of the early 2009 Great American Fire Sale and go out and buy all the generators, chain saws, washing machines, fine linens, and other durable goods you’re going to need for the next few years because by the end of 2009 most of the inventory may be sold through, many retailers will be shut down, and replenishment of stocks of the survivors will likely be meager...
- Fed cuts dollar, Fire sales vs FIRE sales, Duh-flation, and Bezzle shrinks again
- Fed cuts dollar, Fire sales vs FIRE sales, Duh-flation, and Bezzle shrinks again
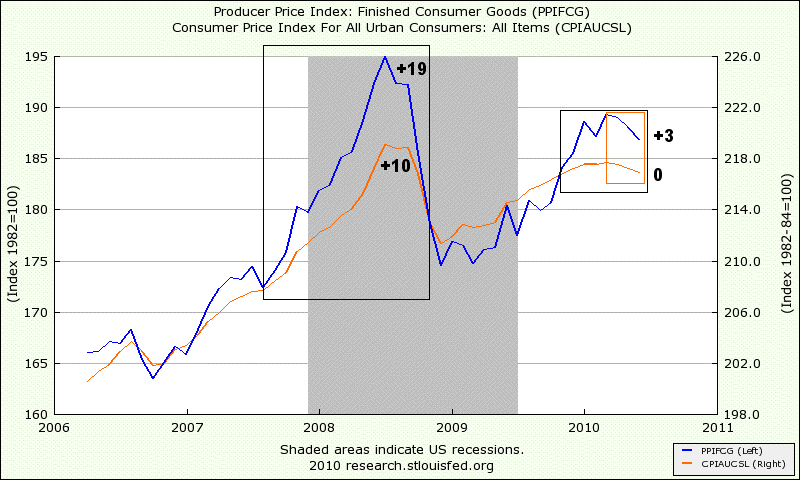
Producer prices rise faster than consumer prices
For lack of a better term, we’re calling the gradual loss of purchasing power that does not show up in the money aggregates a Stealth Inflation. To track the stealth inflation phenomenon we’ve developed the iTulip Consumer Purchasing Power Index.
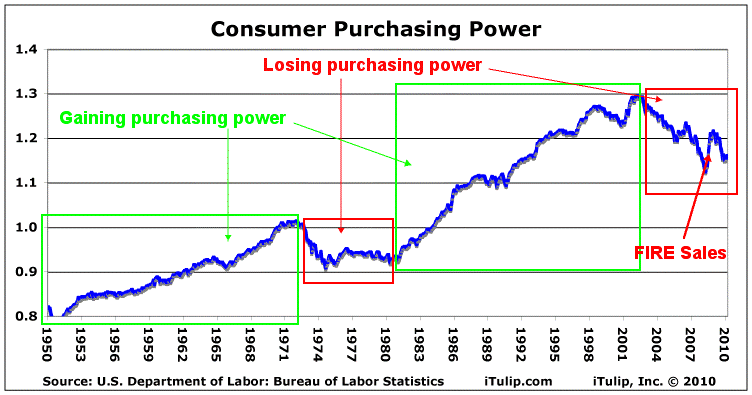
Our Consumer Purchasing Power graph shows a ratio of finished goods producer prices to consumer prices. The absolute ratio is not important but the trends are. Note that periods when producers are able to pass on rising producer costs to consumers are periods of rising consumer purchasing power and living standards, such as from after WWII until the early 1970s, and from the start of the FIRE Economy in 1980 to the beginning of the end of it in 2001.
The erosion of consumer purchasing power from 1971 to 1974 did appear as high wage and price inflation starting in the mid 1970s, when both producer and consumer prices were rising; consumer purchasing power declined more slowly as inflation worked its way into wage rates through employment contracts. But from 1971 to 1974, before the memorable inflation of the late 1970s showed up in the aggregates, consumer purchasing power fell hard. Those of us old enough to remember the era recall that packaging got smaller and lower quality ingredients were substituted for higher quality ingredients. Starting in 2001, consumer purchasing power began to fall again except for the short FIRE Sales period we expected in early 2009.
From a consumer perspective, the process looks like this:
They are both rolls of Northern bathroom tissue. "Big rolls." The one on the left came from a package I bought last month. The one on the right I purchased this month.
From: The Incredible Shrinking Toilet Paper Roll Rip-Off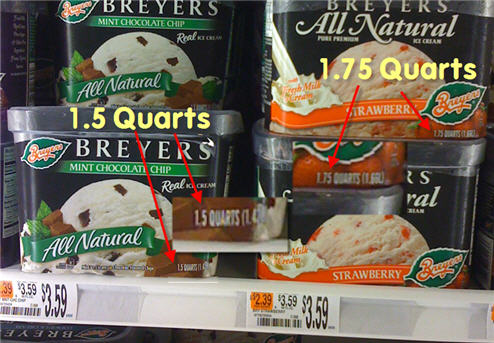
Here’s a photo of the downsized Breyers cartons posted at consumerist.com
For as long as this ice cream lover can remember, Breyers Ice Cream was sold in half-gallon (64 ounce) cartons. First, Unilever downsized the half-gallon carton to 1.75 quarts (56 ounces), which was a 12.5% reduction. Now, they have downsized the 1.75 quart carton to 1.5 quarts (48 ounces). This means the original half-gallon carton of Breyers is now 25% smaller at 1.5 quarts. The 1.25 quart carton of Breyers Ice Cream can’t be too far away.
To make things worse, unless we’re mistaken, the price of a carton of Breyers Ice Cream has gone up while the size has shrunk. But even at the same price per carton, a 25% decrease in product equals a 33% increase in price-per-ounce. For instance, even if the cost of a carton of Breyers held steady at a hypothetical price of $4.00, you used to get 64 ounces for that $4.00. But now, you will pay $5.33 for 64 ounces (one-and-a-third cartons), a 33% price increase. Factor in the increase in the price of a carton, and you’re probably paying 40% or 50% more than you did, say, a year ago.
From: Unilever Shrinks Its Products Again: Breyers Ice Cream Now 25% Smaller!For as long as this ice cream lover can remember, Breyers Ice Cream was sold in half-gallon (64 ounce) cartons. First, Unilever downsized the half-gallon carton to 1.75 quarts (56 ounces), which was a 12.5% reduction. Now, they have downsized the 1.75 quart carton to 1.5 quarts (48 ounces). This means the original half-gallon carton of Breyers is now 25% smaller at 1.5 quarts. The 1.25 quart carton of Breyers Ice Cream can’t be too far away.
To make things worse, unless we’re mistaken, the price of a carton of Breyers Ice Cream has gone up while the size has shrunk. But even at the same price per carton, a 25% decrease in product equals a 33% increase in price-per-ounce. For instance, even if the cost of a carton of Breyers held steady at a hypothetical price of $4.00, you used to get 64 ounces for that $4.00. But now, you will pay $5.33 for 64 ounces (one-and-a-third cartons), a 33% price increase. Factor in the increase in the price of a carton, and you’re probably paying 40% or 50% more than you did, say, a year ago.
The maker of Mars and Snickers has shrunk the size of the bestselling chocolate bars in what amounts to an under the counter price rise.
While the bars have been reduced by 7.2 per cent from 62.5g to 58g, their prices have remained the same.
From: Shrinking Mars bar: Size cut by 7.2% but price stays the sameWhile the bars have been reduced by 7.2 per cent from 62.5g to 58g, their prices have remained the same.
Once upon a time “bath size” bars of soap were all five ounces. Most have now been downsized to 4.5 ounces.
The latest move, however, is to go even smaller. Dial for Men is a prime example.
*MOUSE PRINT: The 4.5 ounce bar is now 4.0 ounces — over 10% smaller
The latest move, however, is to go even smaller. Dial for Men is a prime example.
*MOUSE PRINT: The 4.5 ounce bar is now 4.0 ounces — over 10% smaller
OLD NEW
So these three packs are 12 ounces instead of the old 13.5 ounces, but still priced the same.
From: Dial Soap: The Incredible Shrinking Bar From a consumer products complaint management perspective, the stealth inflation looks like this.
Remember, these letters were written at the depth of the recession when purchasing power of cash holders is supposed to be rising:
SMALLER PACKAGING FOR SAME PRICE
From: "kellogg@casupport.com"
Sent: Tuesday, September 23, 2008 7:30:58 PM
Subject: Re: Consumer Affairs 013649751A
Mr. X,
Thank you for contacting us regarding our recent reduction of our carton sizes on select Kellogg's cereal. We appreciate the opportunity to respond. The Kellogg Company remains committed to providing consumers with healthy and nutritious foods at a fair price. As you know, recent economic pressures have affected all of us as we see higher prices on goods and services we purchase for our families and homes. As a company, we also face significantly higher prices for ingredients, energy, packaging materials, labor, equipment, freight and warehousing. To help offset those increased costs, Kellogg is reducing the size of some of our products to help consumers. We hope we may count you among our valued family of consumers in the years ahead as we continue to offer you delicious and nutritious products at an affordable price.
Sincerely,
Consumer Affairs Department
013649751A
Kellogg North America
PO Box CAMB
Battle Creek, MI 49016-1986
Posted Thu September 25, 2008 12:00 pm, by DEBORAH B. written to Kellogg CompanyFrom: "kellogg@casupport.com"
Sent: Tuesday, September 23, 2008 7:30:58 PM
Subject: Re: Consumer Affairs 013649751A
Mr. X,
Thank you for contacting us regarding our recent reduction of our carton sizes on select Kellogg's cereal. We appreciate the opportunity to respond. The Kellogg Company remains committed to providing consumers with healthy and nutritious foods at a fair price. As you know, recent economic pressures have affected all of us as we see higher prices on goods and services we purchase for our families and homes. As a company, we also face significantly higher prices for ingredients, energy, packaging materials, labor, equipment, freight and warehousing. To help offset those increased costs, Kellogg is reducing the size of some of our products to help consumers. We hope we may count you among our valued family of consumers in the years ahead as we continue to offer you delicious and nutritious products at an affordable price.
Sincerely,
Consumer Affairs Department
013649751A
Kellogg North America
PO Box CAMB
Battle Creek, MI 49016-1986
From: Deborah
To: kellogg@casupport.com
Cc: Clark
Sent: Thursday, September 25, 2008 7:29 AM
Subject: Fw: Consumer Affairs 013649751A
Consumer Affairs Department
Per your email above: “As you know, recent economic pressures have affected all of us as we see higher prices on goods and services we purchase for our families and homes. As a company, we also face significantly higher prices for ingredients, energy, packaging materials, labor, equipment, freight and warehousing.”
It is interesting that the response by Kellogg to the economic situation is to reduce package size while maintaining cost. As a family, we also face the same higher prices - and paying the higher cost of gas to commute to work and school is significant. Our response is somewhat different however. Since it is not possible for us to reduce the hours that we work and still get paid the same amount of money (which would allow us time to go out and get a second job (Wow, I wonder if my boss would go for that), we are forced to reduce our spending. That means finding the best deals we can on all goods that we buy, and purchasing smaller quantities for the same price we paid for larger packages is NOT an option. I will look for product that is on sale, less expensive, and not repackaged in smaller quantities just so that YOU can continue making the same amount of money, paying C Level staff a ridiculous salary and annual bonuses.
Shame on Kellogg.
Deborah
There’s a member thread here that documents the stealth inflation phenomenon. To: kellogg@casupport.com
Cc: Clark
Sent: Thursday, September 25, 2008 7:29 AM
Subject: Fw: Consumer Affairs 013649751A
Consumer Affairs Department
Per your email above: “As you know, recent economic pressures have affected all of us as we see higher prices on goods and services we purchase for our families and homes. As a company, we also face significantly higher prices for ingredients, energy, packaging materials, labor, equipment, freight and warehousing.”
It is interesting that the response by Kellogg to the economic situation is to reduce package size while maintaining cost. As a family, we also face the same higher prices - and paying the higher cost of gas to commute to work and school is significant. Our response is somewhat different however. Since it is not possible for us to reduce the hours that we work and still get paid the same amount of money (which would allow us time to go out and get a second job (Wow, I wonder if my boss would go for that), we are forced to reduce our spending. That means finding the best deals we can on all goods that we buy, and purchasing smaller quantities for the same price we paid for larger packages is NOT an option. I will look for product that is on sale, less expensive, and not repackaged in smaller quantities just so that YOU can continue making the same amount of money, paying C Level staff a ridiculous salary and annual bonuses.
Shame on Kellogg.
Deborah
We hope readers took advantage of our late 2008 recommendation and bought the good stuff in 2009 at the prices that junk is being sold at today, and good luck finding high quality products at any price. Inexpensive low quality clothes can still be found, in fact in some cases cheaper than having them dry cleaned. In case you hadn’t noticed, dry cleaning prices are up. Here’s how consumers have responded:
Operators in other regions haven’t been so lucky. The Midwest suffered the worst, with June sales down 3.0% and the second quarter off 4.9%. Also seeing a substantial decline were operators in the South, where June sales fell 3.1%, and second-quarter sales dropped 3.0%.
Southern drycleaners reported continued pricing pressure as a factor in the poor results. “We haven’t increased prices since May 2008 [and] are doing promotions to increase piece counts,” one operator says. “Thus, the average revenue per piece is down a bit from a year ago. Maybe — just maybe — we are near the bottom of the decline, but the chance for recovery seems fragile or even unlikely.”
The West saw mixed results, with sales for June 2010 up 1.5%, and totals for the quarter slipping a slight 0.6%. “These increases came only after much time, effort and money were spent on marketing,” one operator says. “We have been working very hard to increase sales.”
“Business is terrible,” another Western operator says. “Having to offer so many coupons and specials, my margins are deteriorating. And the economy has driven so many consumers to wash-and-wear — especially in the summer.”
Northeast Shows Signs of Growth; Others Struggling
Ian P. Murphy, Editor , American Drycleaner
Published 07/28/2010
If the forecast is stealth inflation -- formerly known as stagflation -- punctuated by periods of disinflation until a final debt and currency crisis, what of the recent disinflation sightings? Southern drycleaners reported continued pricing pressure as a factor in the poor results. “We haven’t increased prices since May 2008 [and] are doing promotions to increase piece counts,” one operator says. “Thus, the average revenue per piece is down a bit from a year ago. Maybe — just maybe — we are near the bottom of the decline, but the chance for recovery seems fragile or even unlikely.”
The West saw mixed results, with sales for June 2010 up 1.5%, and totals for the quarter slipping a slight 0.6%. “These increases came only after much time, effort and money were spent on marketing,” one operator says. “We have been working very hard to increase sales.”
“Business is terrible,” another Western operator says. “Having to offer so many coupons and specials, my margins are deteriorating. And the economy has driven so many consumers to wash-and-wear — especially in the summer.”
Northeast Shows Signs of Growth; Others Struggling
Ian P. Murphy, Editor , American Drycleaner
Published 07/28/2010

Inflation versus Deflation Tournament Game 3 - Part II: Will history repeat?
- Is the deflation a real threat?
- How much QE is required?
- Or is QE irrelevant?
- Double-dip recession or staggering recovery?
- Gee, can’t we just depreciate the dollar again?
- The coming deficit “surprise”
Even though the long-term economic picture depicts stealth inflation followed by rising aggregate price levels, the short-term picture is disinflation. To understand why, readers have to remember the primary tool of deflation fighting: depreciation of the dollar against oil and the currencies of U.S. trade partners.
Depreciating the dollar from 84 to 73 between March and October 2009 was primarily responsible for the surge of inflation that pushed the PPI up from -4% to 6% between June 2009 and April 2010.
Remember when Hank Paulson used to incredulously espouse the strong dollar policy even as the dollar plunged in 2007 and 2008? We don’t hear that anymore. Not talking strong dollar policy is as close as U.S. officials can get to conveying a weak dollar policy without being explicit.
As the recovery of our debt-ladened economy stumbles along, the last thing the Fed and Treasury want is a stronger dollar, but for the past several months that’s exactly what they’ve gotten.
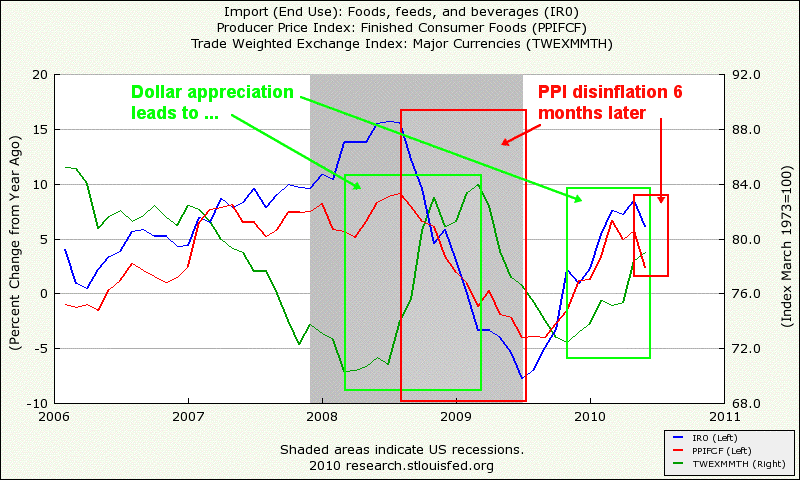
The chart above shows the trade weighted dollar, food import prices, and finished producer food prices to reveal the relationship over time. A falling dollar produces rising import prices that over time show up as rising finished producer prices. Conversely, a stronger dollar leads to falling import prices and a falling PPI later, assuming more or less the same demand over the period.
The euro debt crisis pushed the exchange rate value of the dollar up from 73 to 78 between November 2009 and June 2010. The delay between a rising dollar and PPI inflation or disinflation is approximately six months; by April 2010 the PPI was falling again.
U.S. policy makers have to figure out a way to stop the dollar from continuing to appreciate and soon or disinflation may threaten to develop into full-blown deflation. We believe the chances of that happening are close to zero. The recent lull in the euro debt crisis has helped by allowing the dollar to weaken against at least one major currency, but the U.S. needs more. more... ($ubscription)
__________________________________________________
To receive the iTulip Newsletter or iTulip Alerts, Join our FREE Email Mailing List
Copyright © iTulip, Inc. 1998 - 2010 All Rights Reserved
All information provided "as is" for informational purposes only, not intended for trading purposes or advice. Nothing appearing on this website should be considered a recommendation to buy or to sell any security or related financial instrument. iTulip, Inc. is not liable for any informational errors, incompleteness, or delays, or for any actions taken in reliance on information contained herein. Full Disclaimer


Comment