Since 1998 we have used median and mean duration of unemployment to confirm our economic forecasts, such as our Dec. 2000 forecast for a technology bubble bust recession to begin in Jan, 2001 and our Oct. 2006 forecast for a housing-bust recession to start in the fourth quarter of 2007. Duration of unemployment is also good leading indicator of recovery if used in combination with other tools, although as a recovery indicator its utility has changed since the FIRE Economy developed in the late 1980s. Before the 1990 recession when the Productive economy still dominated, unemployment duration reversed close to the end of the period of economic contraction. But in every recession since 1990, unemployment duration has continued to rise for years after the recession's official end. The phenomenon of recession ending in the Productive Economy when the FIRE Economy was still contracting is commonly misunderstood as a "jobless recovery."
Why are the duration of unemployment numbers more reliable than the unemployment data, both as a leading indicator and a measure of labor market health? No matter how the unemployment data are gamed, such as via the birth/death model in the short-term and by redefinitions of the meaning of “unemployed” over the long-term, the duration numbers assure a consistent measure of labor market health as a ratio of the rate of job creation in the private sector relative to the total number of unemployed.
Duration of unemployment works as a leading indicator of recession because firms stop hiring new employees a quarter or two before they begin layoffs to cut payroll expenses to improve cash flow after a quarter or two of sales declines. This shows up as an increase in duration of unemployment as workers who are already unemployed experience increased competition for fewer jobs. Conversely, several quarters before payroll employment numbers show net job growth, an increase in the number of jobs relative to the total number of unemployed shows up as a decline in the duration of unemployment.
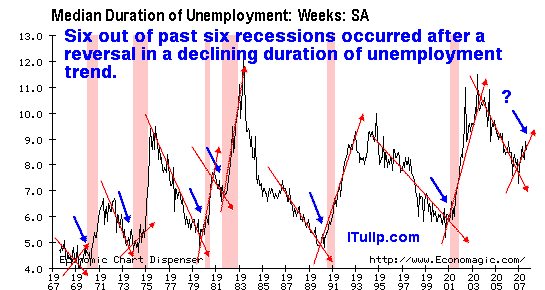
Duration of unemployment chart used in our 2007 forecast of The Great Recession
Friday’s jobs data support our opinion that despite near zero interest rates and the largest fiscal stimulus since WWII, the U.S. economy is still not creating jobs fast enough to allow stimulus to be withdrawn without sending the economy back into recession.
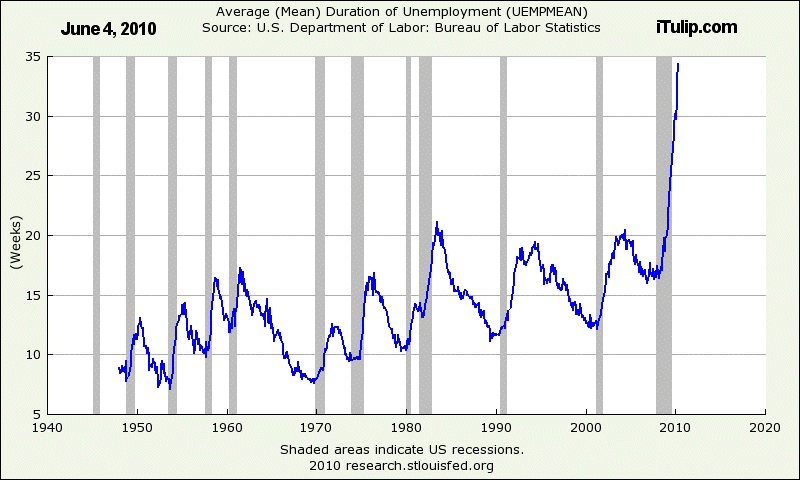
The average length of time that a person out of work has remained unemployed reached a high of 34 weeks in May 2010, exceeding the previous peak of 21 weeks in1983. The average indicates that there are as many unemployed who have been out of work for 34 weeks as have been out for less.
The median duration data are even worse by historical standards. The median is the middle value of the range of duration of unemployment values.

Median duration of unemployment in May approached twice the highest level reached during the severe 1980s recessions, far exceeding the previous 1983 peak.
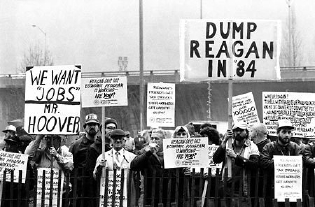
Those of us who lived through that period may recall the economy as being worse off than it is today. Unemployment doesn’t “feel” twice as severe today as in 1983. No one is marching in the streets demanding jobs, and the restaurants and malls are busy, unlike during the 1980s recessions. There are three reasons for this.
First, the level of fiscal stimulus spending is nearly twice as high as a percent of GDP, 9.6% versus 5%.
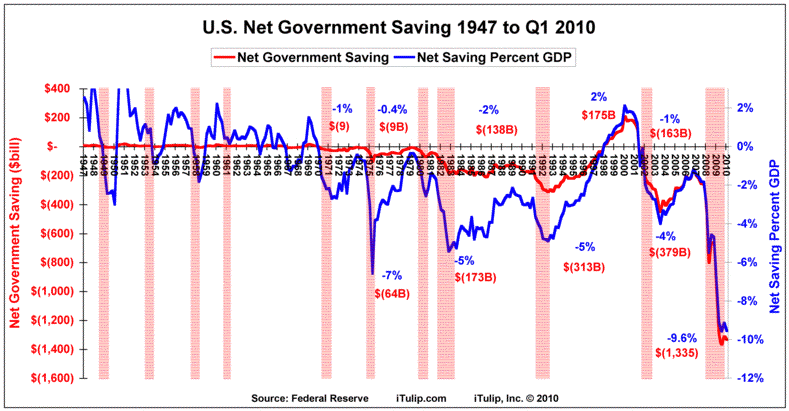
The amount of government spending on military and civilian programs, such as those financed by the American Recovery & Reinvestment Act of 2009, largely compensates for the reduction in private sector spending caused by high levels of unemployment.
Second, short term interest rates are near zero now versus 9.5%.
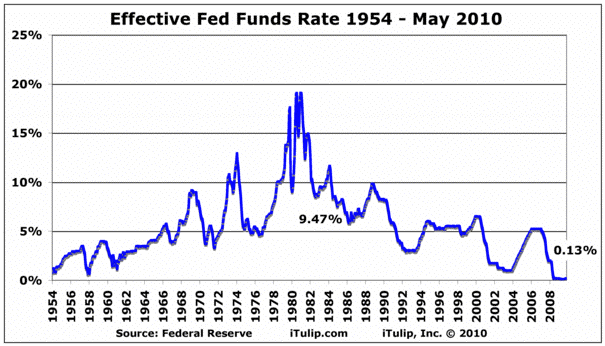
Low interest rates reduce borrowing costs for producers and consumers in the Productive economy, but are baseline requirement for the continued survival of the FIRE Economy, especially the housing sector. Imagine the impact on the struggling nationalized housing market if mortgage rates increase from historic lows to 8% or 9% as will happen if the Fed Funds rate rises to 3% or 4%. This is why even a discussion of the Fed raising interest rates crashes the stock market; the FIRE sector is now as dependent on near zero rates in the United States as the Japanese economy has been for nearly two decades. But the U.S. is not Japan; the U.S. has energy and import price inflation problems that Japan does not.
That leads us to the third and final reason that unemployment at twice the median duration of the 1983 recession does not feel as bad: inflation is lower today than in 1983. In the early years of the 1980s recessions, wages fell more quickly than prices. That, in fact, was the whole point of the recession, induced as it was by austere monetary and fiscal policy, to break an inflation spiral that threatened to run out of control into hyperinflation.
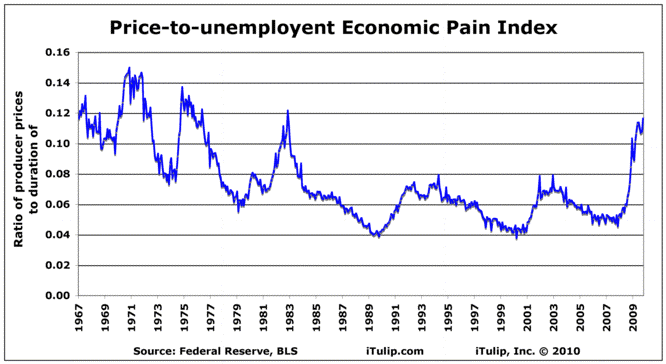
The graph above shows a ratio of producer prices to duration of unemployment. Rising producer prices today are not a function of consumer demand but high energy costs; producers attempt to pass on rising producer prices to consumers who, without pricing power in the labor markets, are less able to afford to pay them. The result is an increase economic pain that is now approaching 1983 recession levels. This is especially relevant for lower income groups. More than 40 million Americans used food stamps in March 2010, a 75% increase from 26 million in the same month in 2006. Food prices are rising but not wages for low skilled workers. This is the legacy of asset bubbles and post-bubble reflation policy, a highly regressive price structure that has the greatest negative impact on those who got the least benefit out of the bubbles themselves.
Emergency economic measures taken in Q1 2009 are becoming structural as consumers and producers come to rely on zero short-term interest rates, subsided mortgages, unemployment insurance, food stamps, and jobs in the military among a plethora of government spending programs. Unlike 1983 when the unemployed took their anger out on the Reagan administration, demanding an end to austerity, today the jobless form political groups that demand reduced government spending and higher interest rates, in other words, austerity. The reflation policies of low interest rates and high deficits are seen as cause of economic stress and joblessness. The root cause is all but forgotten, the asset bubbles that set the stage for the economic crash that the Fed and Congress were then obliged to counter with emergency reflation policies. The framework of political debate is now divorced from the realities of the American economy, both the causes of the crisis and the limited menu of policy options that are available to get the nation out of the corner that it has painted itself into. Look for ongoing market volatility as the confused politics of post-bubble reflation policy play themselves out over the rest of 2010.
__________________________________________________
To receive the iTulip Newsletter or iTulip Alerts, Join our FREE Email Mailing List
Copyright © iTulip, Inc. 1998 - 2010 All Rights Reserved
All information provided "as is" for informational purposes only, not intended for trading purposes or advice. Nothing appearing on this website should be considered a recommendation to buy or to sell any security or related financial instrument. iTulip, Inc. is not liable for any informational errors, incompleteness, or delays, or for any actions taken in reliance on information contained herein. Full Disclaimer


Comment