Re: Debt-deflation Bear Market Update - Part I: First Bounce officially over (really)
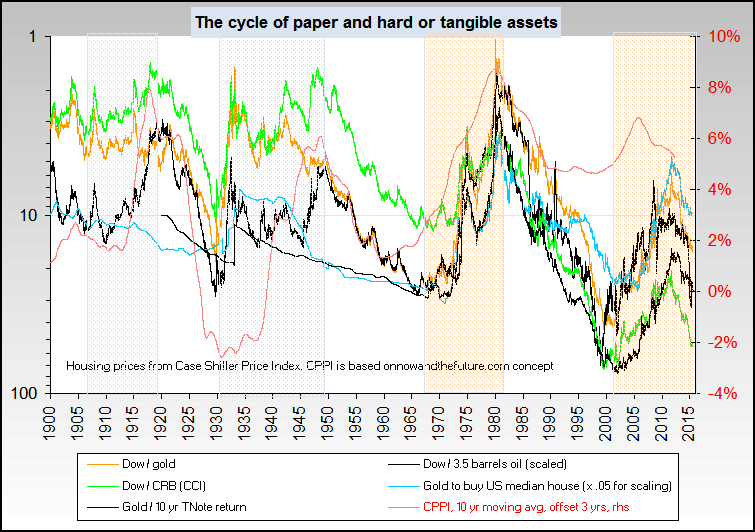
Well, I think you can only use this kind of mean-reversion analysis at extreme points with a longterm time-frame. In 1975 it had only just dipped under, so at that time, you couldn't draw conclusions. After 1985, however, you could think about buying stocks for the long-term. And if you had bought 85-90, you would have been rewarded over the next 10 years.
Now, according to CPI adjusted we are fairly valued, but that's in the context of having over shot to the upside. It's only a buy signal if it dips significantly below.
I'm not sure what to make of the without lies adjustment. It seems to suggest that it will soon be the time to buy. How do you square this with EJ's use of the inflation adjusted dow?
When it comes to this kind of thing, I prefer looking at Shiller's 10 year trailing P/E (http://www.multpl.com/) . On wikipedia you can find the graphs of 10 year trailing P/E vs 10/20 year inflation adjusted annual returns, so you can get an idea yourself of the predictive value. (my take: gives clear signals at extreme points, above 22 is bad, but otherwise, from a 10 year point of view, you can expect positive real returns from stocks most of the time. Now we're at ~20, but that's in the context of coming down from a high, so it's not a clear buy or sell)


Comment