 |
“The job losses over the past three years have been across a wide range of industries and from coast to coast. And if you've lost your job, in all likelihood you will remain unemployed for longer than in any period since the Great Depression.”
- Mark Zandi
“A person's professional and personal identity is linked to what they do for a living. With that sense of self diminished, the unemployed person has the added stress of wondering how to make ends meet financially, especially if they have a family to support.”
- Steve Rogers
“Even a band of angels can turn ugly and start looting if enough angels are unemployed and hanging around the Pearly Gates convinced that all the succubi own all the liquor stores in Heaven.”
- P. J. O'Rourke
“What this country needs are more unemployed politicians.”
- Edward Langley
This article is a follow-up from Housing Bubble Correction Update: Fasten your seat belts, here comes the jobs crash (Part I) July 2, 2008
The U.S. job market bucked and kicked its way through two easy-credit spiked economic booms and busts. We all have friends or family members who were thrown off by the first recession in 2001 or the second that ran for two years until the end of 2009. By 2003 thousands of technology industry workers gave up hope of finding work in their trade and escaped into real estate, only to see that industry implode in 2007 the year after the housing bubble started to collapse. The cumulative and lasting damage caused by two consecutive, predictable and thus preventable asset bubbles is starting to dawn on their victims. Some call it the "new normal." Millions of Americans have not recovered the income or job status they enjoyed a decade ago. But thanks to trillions of dollars of government stimulus, job losses ebb and employment growth is returning to some areas, but not others, and to some industries while others continue to decline.
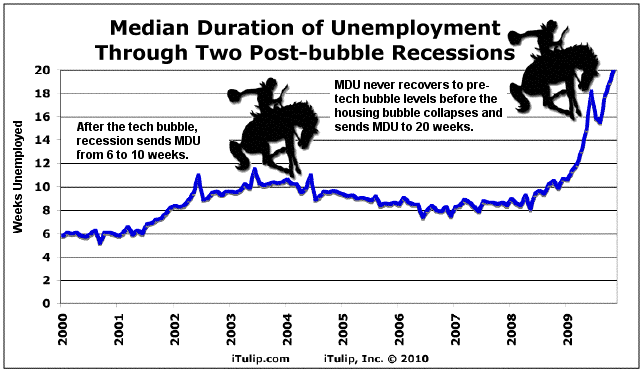
Median Duration of Unemployment reached 20 weeks in Feb. 2010 and continues to rise
Some call the period after the acute crisis, the hangover of the second bubble, a “new normal.” I call it an obviously preventable catastrophe that I and many others warned about years before it happened as the crisis developed step by step before our eyes, in detailed analysis that appeared year after year. The information was there for anyone who wanted to see and act on it.
Over the past few weeks I received a number of calls from the media wanting to talk about the ten-year anniversary of the tech bubble. Maybe you saw Ten Years Later, The Internet Bubble Burst Still Resonates and here. But not everyone wants to hear the story told this way.
They want me to talk about how greedy, stupid investors drove up the prices of tech stocks then houses. They don't think national television audiences are ready to hear the view that the twin bubbles were the result of bad monetary policy, of government subsidies to the politically influential finance, insurance, and real estate industries, and lack of proper regulation thereof.
You’re not supposed to ask why bubbles don’t ever seem to happen in France or Germany or any other country on earth the way they happen here in the United States. Or if you do ask then the acceptable answer is that these booms and busts are a necessary price of economic freedom, that the uniquely creative wild west culture that leads to market excesses also produced iconic American technology giants. Google. Cisco. Microsoft. Intel. We can't have one without the other.
The argument downplays the downside of asset bubbles, too. What did the last two bubbles really cost us, anyway? A couple hundred bankrupt dot coms, excess fiber optic cable that was later absorbed by the market, and few million foreclosed houses. So what?
This popular argument ignores the facts. Most of the great, durable U.S. technology companies grew out of periods of stable economic growth, not during the wild booms. Housing prices are not artificially inflated in countries where the residential real estate market is not crashed up and down. Instead they correlate to the incomes of home buyers. Housing in nearly every important economy in the world costs the average family less than 25% of income rather than more than 40% here in the U.S. Over-priced housing is a major cause of uncompetitive labor costs in the U.S.
But all of these economic distortions caused by asset bubbles pales beside the lasting damage caused to a range of key industries and labor markets. Millions are thrown out of work, or forced to accept lower paying employment, through no fault of their own. They are hapless collateral damage.
Where bubbles fear to tread
Bubble’s are no less interesting for their absence. In the case of France, the government subsidy of housing prices created by the mortgage interest rate deduction, the very the foundation of the U.S. housing bubble, is forbidden by that nation’s constitution. Such back-door wealth redistribution schemes, from renters to property owners, are not allowed. France’s supreme court shot down attempts by French politicians to get a housing price subsidy going through a mortgage interest rate deduction a few years ago.
The French prefer to do their wealth redistribution up front and in full view through the structure of tax law. We prefer the covert tools of risk shifting by banking and finance. But you’ll never know this by reading the dozen articles that recently came out on the ten-year anniversary of the dot com bubble that explain it all away as an unfortunate accident caused by a ghoulish and greedy public.
The U.S. media will never get the correct answers about the origins and nature of our past two bubbles as long as it keeps asking the wrong questions. If the causes of the bubbles are not confronted and dealt with honestly, we can never move forward. We are doomed to repetitions, or at least attempts at recreating asset bubbles, although I seriously doubt we have the credit capacity for another one: we’ve run out of suckers. Witness the difficulty of getting the asset-backed securities market going again.
Maybe by 2016, ten years after the start of the housing bubble collapse, the quality of coverage of the topic will have improved enough that we’ll stop calling the Housing Bubble Recession the “Great Recession” as if scale not origin is the most relevant aspect of the crisis. From now on, we refuse to play along and use that misguided term.
Just as frustrating as the discussion of post-bubble recessions as resulting from accidents and errors, the joblessness that they caused is reported in undifferentiated numbers of civilian unemployed, long-term unemployed, and rising or falling initial jobless claims, as if the United States was one big town full of like-aged workers all employed at the same job.
The political question being dodged are these: Whose recession? Whose recovery? In which industries, states, towns, and nations? For which age and income groups?
These are the important questions. The answers matter. Why? Because as surely as the post-bubble recessions followed from the bubbles, and as surely as post-recession re-inflation policy--consisting of more cheap credit and fiscal stimulus--followed deterministically from the recessions, the massive deficits that the stimulus created foretells austerity programs in our future. They will be necessary to calm our foreign lenders. Of course, these future austerity programs will not be directed at the group that created the mess. That is why the answer to the question, Whose recession today? is key. It is also the answer to question, Whose austerity tomorrow?
The same folks who absorbed the blows of the post-bubble recessions since 2001. The American middle class. Read on and we will show you.
Not one economy
The two post-bubble recessions of the past decade had a complex impact on the U.S. labor market. They set new processes of change in motion and accelerated changes already in progress. Not all of the change is bad, but the most destructive—the rise in default and inflation risk facing U.S. government debt and the dollar—will prove by 2013 to be no easier to contain than the sub-prime mortgage crisis was in 2007. As in 2007, the warning signs are already here, but the process takes longer than you think. More on that in Part II.
To make our case, we go state-by-state, town-by-town, industry-by-industry, and by age group to see how the bubble recessions damaged the U.S. economy.
First we tour the national data on employment by state and by industry. After reviewing hundreds of data series a clear pattern emerged. We did not study all 3,604 local unemployment data series. That’s too large a data cornucopia even for us. We did analyze 250 and snatched a dozen from our sample that are indicative.
Then we look at employment changes in a dozen industries to see which fared better or worse than the nation as a whole.
We analyze the six main age groups which were disproportionately affected, if any.
Finally we review the unemployment that America imposed on other countries when our bubble economy collapsed, comparing joblessness in the U.S. to important economic regions like the euro zone and Japan, and also smaller but no less impacted nations such as Bulgaria, Estonia, and Lithuania.
We’ve been told for years that we’ve got it good here in the U.S. A comparison of unemployment in the United States to other countries confirms the view that they got it good and hard, too.
We use non-seasonally adjusted data only. The graphed results are choppier than the seasonally adjusted data, but are more reliable. Most data series are from January 2000 to February 2010.
No comments made about any borough, community, district, metropolis, precinct, township, village, state, or country is intended to disparage its good citizens. It’s bubble-infested world. We just live in it.
Grab a cup of coffee and sit back as we reveal through 38 graphs the facts about the unemployment rate driven by bubble bust recessions compared to towns, industries, age groups, and countries.
We begin with an update of our animated map of unemployment in the U.S. by state.
State by state
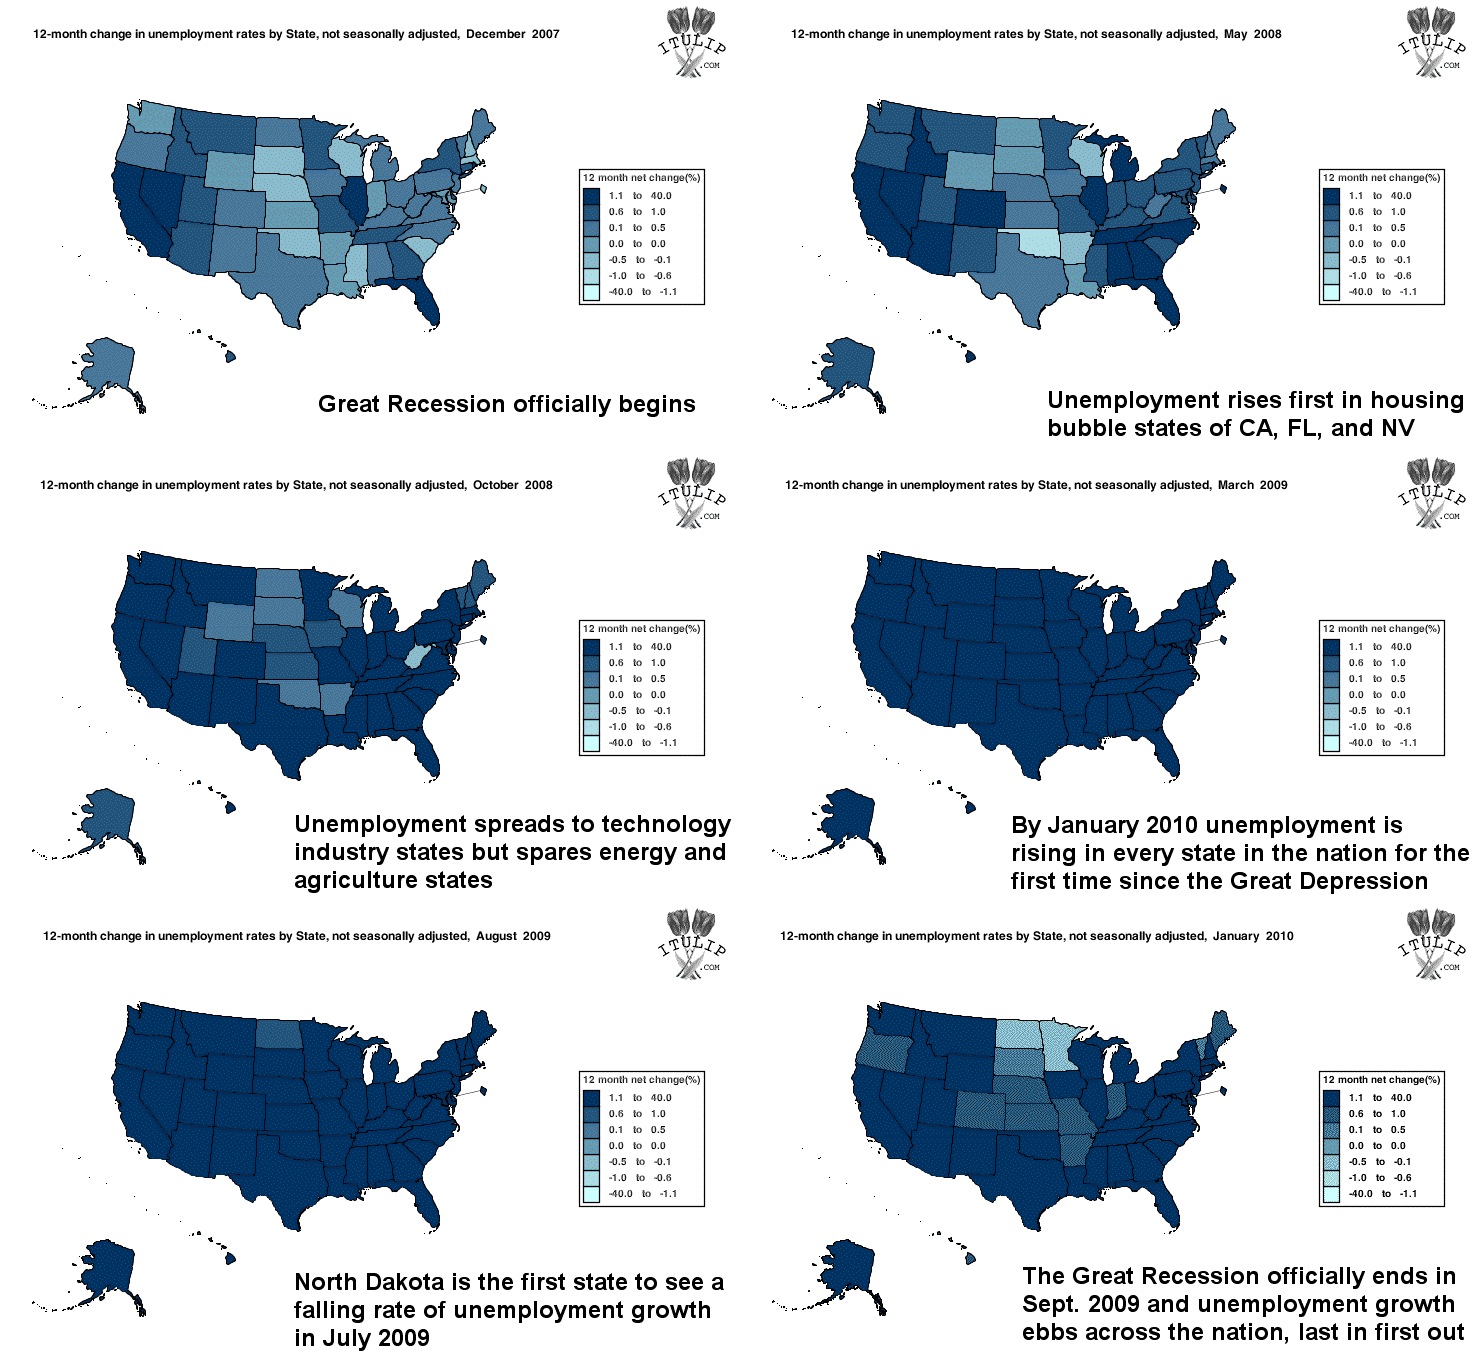
We forecast in October 2006 that a severe housing bust recession, worse than the 1980s recessions, was due to start in Q4 2007. It officially began in December 2007. For political reasons the post housing bust recession was not officially acknowledged until a year later, in January 2009, after the presidential elections. The housing bust recession did not earn the inaccurate label “Great Recession” until a year into the new administration. To this day it is still reported as fallout of a “financial crisis” that resulted from accidents and errors. Readers here should never forget that the Housing Bubble Recession resulted from the collapse of the housing bubble that we began to chronicle here in 2002. The economic catastrophe that followed was no more an accident than the bubble that caused it.
The graph above animates Bureau of Labor Statistics data maps of year-over-year changes in the unemployment rate from the start of the Housing Bubble Recession in December 2007 to six months after its official end through January 2010. The recession moves through groups of states, revealing the impact of the technology and housing bubbles on economic activity and employment: the technology bubble states of California and Massachusetts; the core housing bubble states of California, Florida, and Nevada; the post-industrial states of Michigan and Illinois; the agricultural and energy states such as North Dakota, Montana, and Nebraska.
The collapsing bubbles and recovery acts on these groups of states in a “First in, Last out” or FILO cue basis. The first states to fall into recession will be the last to come out of recession. When you hear the term “recovery” remember that North Dakota will have fully recovered a year before California starts to, and as we see below, certain industries are recovering, others will not for years, and others will never recover.
California is the only state that belongs to both the technology and housing bubble groups. Here on iTulip we refer to California is America’s Argentina: indebted, with gigantic and unaffordable entitlement programs, a bloated public payroll, and enormous disparities of wealth, income, and debt. Unfortunately for the United States and the world, California is the eighth largest country on earth by GDP. Bigger than France. California and its housing bubble partners, including Florida and Nevada, dragged the U.S. into the Housing Bubble Recession. They in turn dragged some, but not all, countries down with it.
States with economies that were too weak to participate in the housing bubble from 2002 to 2006, such as Michigan and Illinois, escaped the direct housing bust wave of contraction in 2007 but were paradoxically the first to be punished in early 2008 for the errors of housing bubble states.
The agriculture and energy states were the last to go into recession, supported as they were until mid 2008 by a spike in commodity prices that investment banks made out of the weak dollar and peak cheap oil energy price trend that began in 2004.
By comparing the unemployment rate of several key industries to the nation as a whole, the impact of the post-bubble recessions on the careers of millions comes into clear focus.
Industry by industry
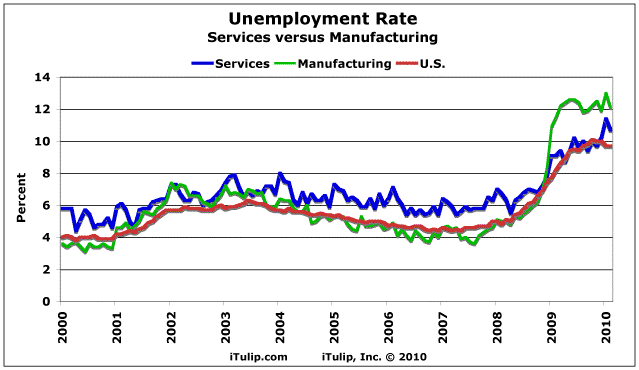
We begin our industry analysis by comparing the unemployment rate in the services and manufacturing sectors to the rate across the United States. Workers in services industries experienced a higher unemployment rate overall before, during, and after the post-bubble recessions but manufacturing sector workers took the brunt of the economic crisis caused by the collapse of the second bubble, in housing.
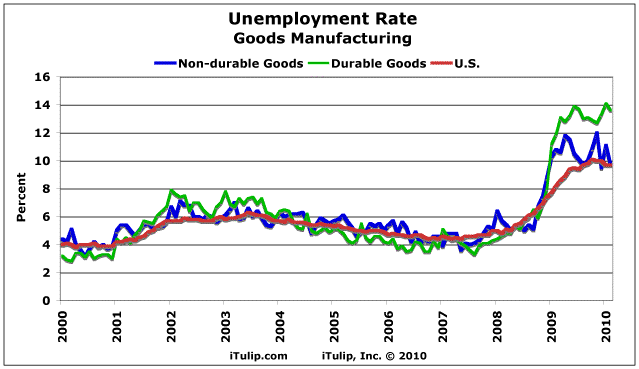
Within the goods manufacturing sector, workers employed at business that make durable goods such as autos saw the worst rise in unemployment.
The unemployment rate in the high technology industry grew rapidly after the collapse of the tech stock bubble.
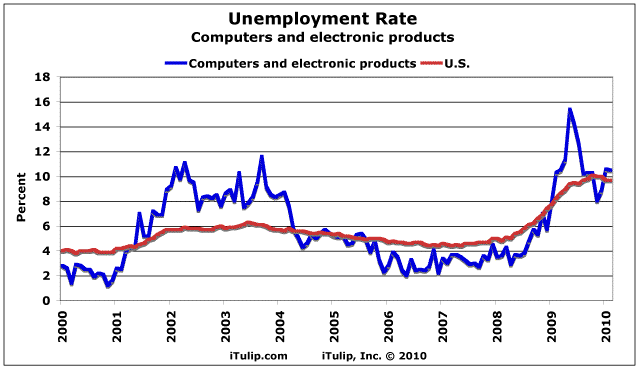
Employment in high tech then recovered as the housing bubble took up the slack, then spiked to nearly 16% during the acute crisis in late 2008 and 2009 that similarly affected other capital-intensive industries before returning to the U.S. trend rate later in 2009. We project a steady decline in unemployment until the next recession that we project to occur around 2013 or sooner if re-inflation policies are cut short.
The one industry that suffered more than any we looked at was the one that relied the most on housing: furniture.
The one industry that suffered more than any we looked at was the one that relied the most on housing: furniture.
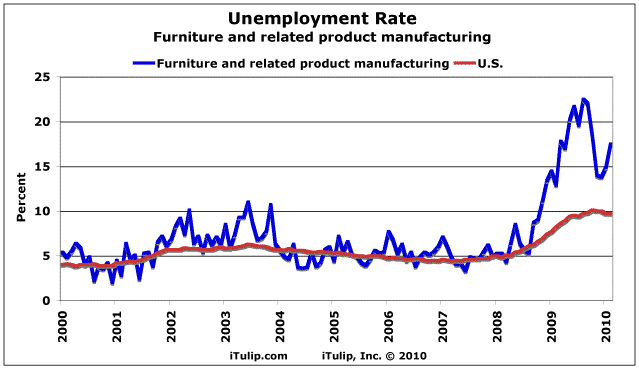
The unemployment rate hit 23% before recovering to 14% in late 2009. The rate began climbing again in the early months of 2010 as hopes of a quick recovery in housing, enabled by government lending programs, fade.

Unemployment in Professional services trended well below the national rate for the duration of the bubble booms and bust except when it synched up briefly in 2002 and 2003 after the collapse of the tech bubble. Professional services benefited from stimulus spending in the latter part of 2009 but has been trending back up again since late 2009.
We wondered how the recession caused by the FIRE Economy affected unemployment in the finance, insurance, and real estate industries.
We wondered how the recession caused by the FIRE Economy affected unemployment in the finance, insurance, and real estate industries.
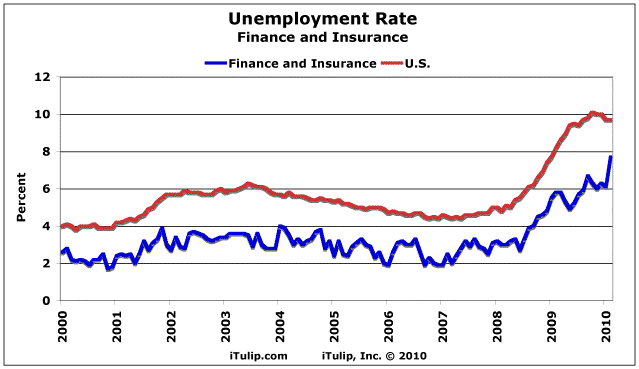
While the unemployment rate in the finance and insurance industries mirrored the national rate, it did so from a significantly lower level. The rate has continued on a jagged upward slope since mid 2008.
The real estate industry held up surprisingly well considering the fact that it was the focal point of the Housing Bubble Recession.
The real estate industry held up surprisingly well considering the fact that it was the focal point of the Housing Bubble Recession.
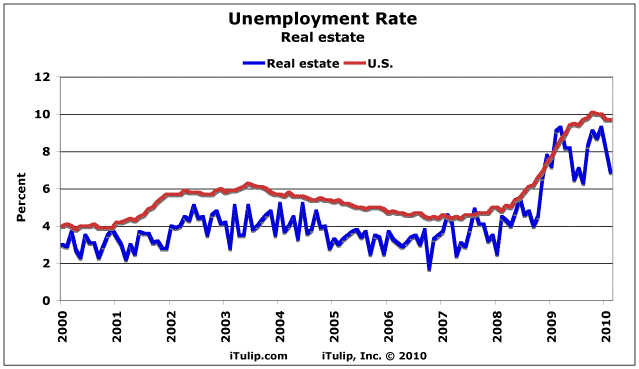
Unlike the high tech industry that saw unemployment explode after the tech bubble, paradoxically the housing bubble collapse itself kept workers in that industry busy renting previously owned property and refinancing mortgages. Someone has to administrate all of the government lending programs that were created to help the victims of Housing Bubble Recession. As a result, unemployment continues to fall in the real estate industry.
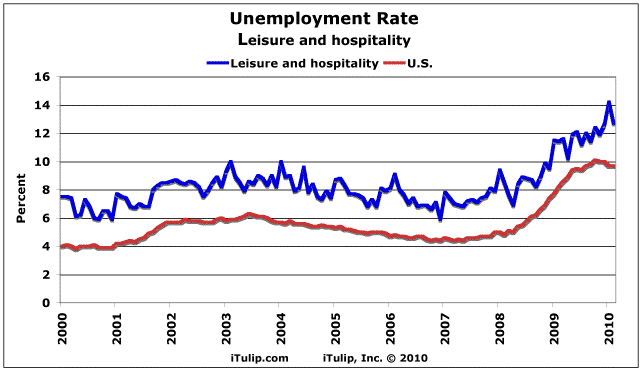
While unemployment in the hotel industry trends above the rate in the economy overall, changes in the rate tend to track the economy and are a good proxy for the business environment generally.
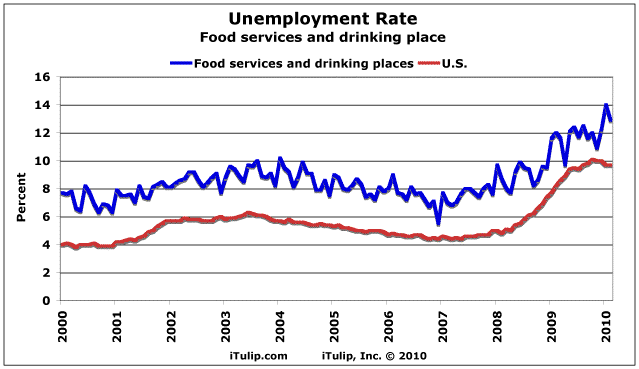
The unemployment rate in the restaurant business also tends to track the national rate but at as much as twice the rate in good times with a smaller spread in bad times.
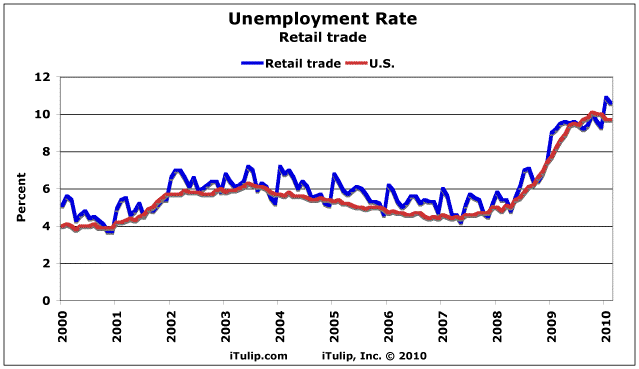
The Retail trade sector is as near an exact proxy for the economy overall as you can get. When we looked at the local data it was clear why: Retail trade was often the largest or second largest contributor to payroll at the town and city level.
The wood industry serves housing and construction, and as a result saw the most extreme reversal of fortune of any industry we looked at.
The wood industry serves housing and construction, and as a result saw the most extreme reversal of fortune of any industry we looked at.

The unemployment rate in Wood products during the tech bubble boom reached a low of 1.5%, spiked to 14.4% during the recession that followed the bust, then leveled off at around 5% starting in 2004 when as the commodities boom took off along side the housing bubble. When the Housing Bubble Recession hit in 2008, unemployment shot up to 20%, fell to under 10% briefly as commodity prices recovered and stimulus programs boosted construction activity, then resumed a rise to over 21% as of February 2010. We do not expect a recovery in this sector for many years.
The largest contributor to payroll on a town and city basis is Healthcare and social services. Not surprisingly, Healthcare was the stalwart industry of both bubble recessions.
The largest contributor to payroll on a town and city basis is Healthcare and social services. Not surprisingly, Healthcare was the stalwart industry of both bubble recessions.
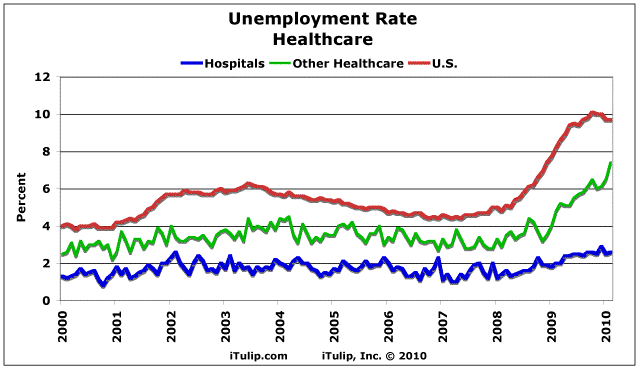
The healthcare industry offered refuge from both economic storms over the past decade, although the Housing Bubble Recession created unemployment even for this sector. The healthcare sub-sector of hospitals remained relatively immune. This industry nearly single-handedly kept many cities and towns from 20% plus unemployment rates as the over 65-age group continued to spend retirement savings.
One and only one industry did better than healthcare through the post-bubble recessions; it was the only one that actually experienced falling unemployment rate during the Housing Bubble Recession.
One and only one industry did better than healthcare through the post-bubble recessions; it was the only one that actually experienced falling unemployment rate during the Housing Bubble Recession.
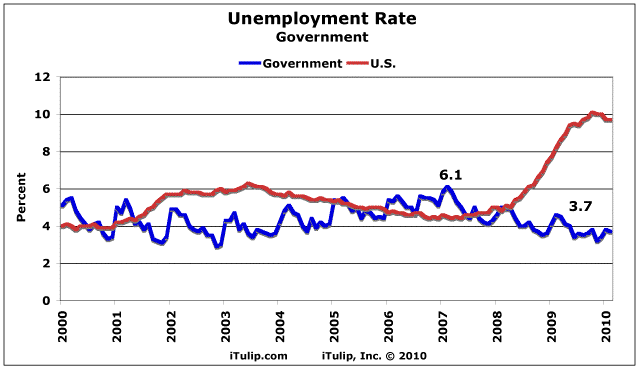
The unemployment rate among government employees fell from 6.1% to 3.7% during the Housing Bubble Recession.
If you work in one of the industries pushed into recession by the tech or housing bust, you have every reason to be furious at those who allowed either one to happen. If you live in a U.S. state or town hit by foreclosures and layoffs, your anger is justified. If you live in a country that was doing well but got the rug pulled out from under you in 2008, there is one and only one reason.
The Bucking Bronco Job Market – Part II: Post-bubble recessions unemployment by city and town $ubscription)
(Photo Credit: Banco Popular, Puerto Rico by Eric Janszen, March 2010)
With this industry analysis as background, we’re ready to look at unemployment at the local level. Every town and city has a dominant industry, and the causal relationship between the collapse of asset bubbles and unemployment in those industries is apparent in the data.
We begin our local tour hopefully with Bountiful, Utah. As the name portends, Bountiful City trailed the U.S. unemployment rate by a wide margin.
 |
(Photo Credit: Banco Popular, Puerto Rico by Eric Janszen, March 2010)
With this industry analysis as background, we’re ready to look at unemployment at the local level. Every town and city has a dominant industry, and the causal relationship between the collapse of asset bubbles and unemployment in those industries is apparent in the data.
We begin our local tour hopefully with Bountiful, Utah. As the name portends, Bountiful City trailed the U.S. unemployment rate by a wide margin.
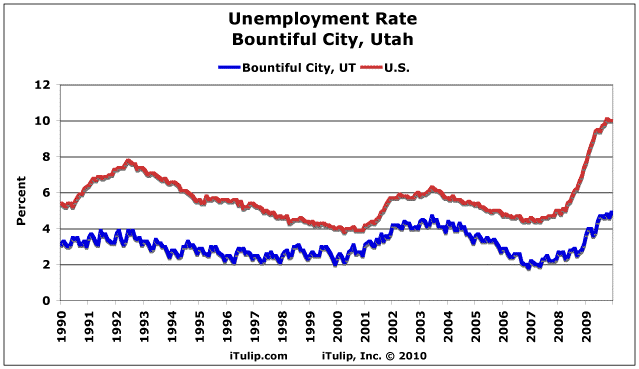
At its worst point in 2009 it barely exceeded the best rate of unemployment nationally. The 2002 economic census shows that Health care & Social assistance and Retail Trade makes up 80% of annual payroll there. As you may have guessed from that, Bountiful City is largely comprised of retirees. “Recession, what recession?” ask the people of Bountiful, Utah.
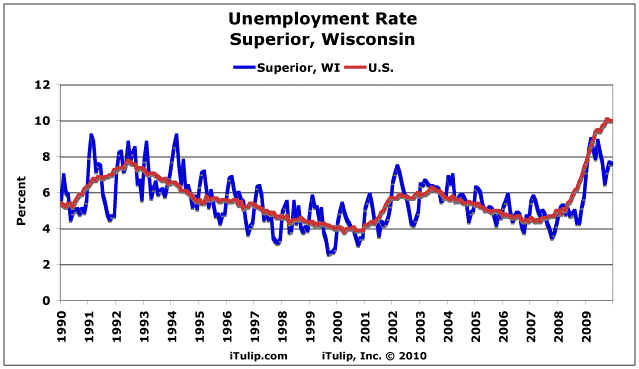
Unemployment in Superior, Wisconsin is not superior to the national rate but closely tracked it. And no wonder, Construction and Retail Trade are the leading industries there. That explains the characteristic annual rise and fall you see in the unemployment data of states that rely on the normally cyclical construction industry. more... $ubscription
The Bucking Bronco Job Market – Part III: Post-bubble recession unemployment by country and age group
(Photo Credit: View from San Felipe del Morro, San Juan, Puerto Rico by Eric Janszen, March 2010)
Next we compare U.S. unemployment rate to unemployment in several countries, starting with Europe.
Europe has long sported a higher unemployment rate than the United States. The graph of European unemployment looks like an inverse of the 20 to 24-year old age group in the U.S. writ large. The disparity is partly statistical. In Europe, discouraged workers who have given up looking for work after six months are still counted as unemployed. The low labor mobility, that is, labor laws that increase the cost of firing off workers and other over-regulation and taxation, along with a cushy social safety net are usually cited as the main sources of the differences in rates.
In any case, for the decade of the bubbles the U.S. could boast half the unemployment rate of the euro zone, until the Housing Bubble Recession, that is. Now the U.S. has the worst of both worlds, high unemployment and tremendously costly extensions of unemployment benefits that are costing the nation tens of billions of dollars per month.
 |
(Photo Credit: View from San Felipe del Morro, San Juan, Puerto Rico by Eric Janszen, March 2010)
Next we compare U.S. unemployment rate to unemployment in several countries, starting with Europe.
Europe has long sported a higher unemployment rate than the United States. The graph of European unemployment looks like an inverse of the 20 to 24-year old age group in the U.S. writ large. The disparity is partly statistical. In Europe, discouraged workers who have given up looking for work after six months are still counted as unemployed. The low labor mobility, that is, labor laws that increase the cost of firing off workers and other over-regulation and taxation, along with a cushy social safety net are usually cited as the main sources of the differences in rates.
In any case, for the decade of the bubbles the U.S. could boast half the unemployment rate of the euro zone, until the Housing Bubble Recession, that is. Now the U.S. has the worst of both worlds, high unemployment and tremendously costly extensions of unemployment benefits that are costing the nation tens of billions of dollars per month.

The U.S. bubble recessions had an inverse relationship to unemployment in the euro zone; unemployment fell in Europe as it increased after the U.S. post-tech bubble recession, picked up as the U.S. recovered during its housing bubble, and fell as unemployment in the U.S. spiked upward. This is not consistent with the story of “global recession” that has been playing on the airwaves in the U.S. for over a year. more... $ubscription
iTulip Select: The Investment Thesis for the Next Cycle™
__________________________________________________
To receive the iTulip Newsletter or iTulip Alerts, Join our FREE Email Mailing List
Copyright © iTulip, Inc. 1998 - 2010 All Rights Reserved
All information provided "as is" for informational purposes only, not intended for trading purposes or advice. Nothing appearing on this website should be considered a recommendation to buy or to sell any security or related financial instrument. iTulip, Inc. is not liable for any informational errors, incompleteness, or delays, or for any actions taken in reliance on information contained herein. Full Disclaimer




Comment