Announcement

Collapse
No announcement yet.

The Fog of Economic Crisis - Part I: Will the real Real Economy please stand up - Eric Janszen

Collapse
X
 
  • Filter
  • Time
  • Show
Clear All
new posts

  • #46
    Re: The Fog of Economic Crisis - Part I: Will the real Real Economy please stand up - Eric Janszen

    Brown confronts Ben about FIRE and how it has dominated our economy leaving a broken manufacturing sector. Bens answer “financial regulation needed”.
    Start 1:06:45

    http://www.c-span.org/Watch/Media/20...itol+Hill.aspx
    Comment


    • #47
      Re: One Explanation for Eric's Graphs

      Bart,

      I linked to this thread in a GDP discussion on the Safehaven longwaves group, and Bud Conrad (economist with Casey) noted:

      " I researched and found the data.
      I said:
      "His Retail sales is presented as a Real (inflation adjusted) time series and the PCE Goods is not."

      When you compare inflation adjusted data to non inflation adjusted data you have garbage.


      Bud"

      He does have a point if this is true, now I can't see whether the PCE is adjusted in some way or not, Eric doesn't seem to mention that detail.
      Justice is the cornerstone of the world

      Comment


      • #48
        Re: One Explanation for Eric's Graphs

        Originally posted by cobben View Post
        Bart,

        I linked to this thread in a GDP discussion on the Safehaven longwaves group, and Bud Conrad (economist with Casey) noted:

        " I researched and found the data.
        I said:
        "His Retail sales is presented as a Real (inflation adjusted) time series and the PCE Goods is not."

        When you compare inflation adjusted data to non inflation adjusted data you have garbage.


        Bud"

        He does have a point if this is true, now I can't see whether the PCE is adjusted in some way or not, Eric doesn't seem to mention that detail.
        Bud's criticism of our graph is valid. The difficulty is that there are no independent Goods PCE and Retail data. The BLS told us they use the Census Bureau data, that is, the Retail Sales and nominal Durable + Non-Durable PCE data look the same because they are the same.


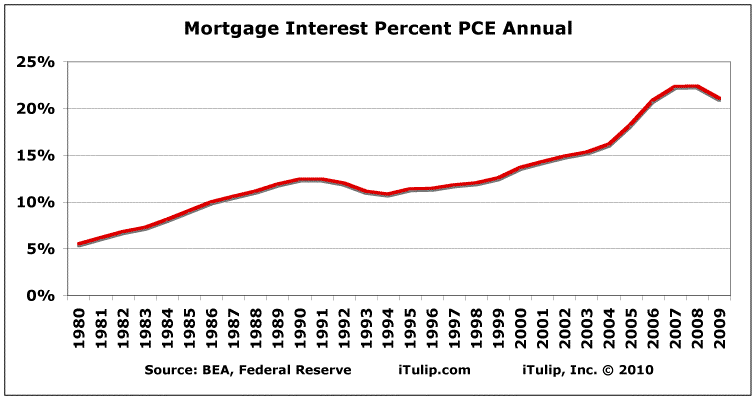
        The data we want that show the monthly growth of debt service as a portion of PCE does not exist. We did pull together an annual comparison of nominal mortgage interest as a percent of nominal goods and services PCE and got this:


        This leaves out revolvoing credit, student loans, and so on. Eventually we'll collect all of the data to build a picture that we have high confidence in.
        Ed.

        Comment


        • #49
          Re: One Explanation for Eric's Graphs

          Originally posted by cobben View Post
          Bart,

          I linked to this thread in a GDP discussion on the Safehaven longwaves group, and Bud Conrad (economist with Casey) noted:

          " I researched and found the data.
          I said:
          "His Retail sales is presented as a Real (inflation adjusted) time series and the PCE Goods is not."

          When you compare inflation adjusted data to non inflation adjusted data you have garbage.


          Bud"

          He does have a point if this is true, now I can't see whether the PCE is adjusted in some way or not, Eric doesn't seem to mention that detail.


          Yep... as Fred notes, it's a b*tch to accurately track a number of the critical stats.

          My best "solution" so far is just to take the non inflation adjusted stats as possible and adjust them with CPI and my own corrected (based on shadowstats work) CPI data... and punt from there. Considering all the uncertainties in data collection and accuracy, even before any manipulation, it seem workable from here.

          I've never invested the quantity of time and effort required to get a "correct" PCE.
          http://www.NowAndTheFuture.com

          Comment

          Working...
          X