 |
It's the FIRE Economy, stupid.
• GDP mystery solved
• Retail's Armageddon-lite
• Productive Economy falters
• The great asset price collapse
• Why stocks are falling
In our analysis Asylum Markets of the post FIRE Economy – Part II: Breaking the Rules we discovered that Personal Consumption Expenditures, the non-government expenditure portion of GDP, had by the end of 2009 recovered to pre-Great Recession levels. How can this be when the recession cost millions their jobs, consumer credit contracted for the first time on record and is still contracting, and depressing signs of consumer retrenchment line the main streets and blights the malls of every town and city in the U.S. with thousands of closed down and boarded up retail stores?
If not from cash income earned on the job or credit tapped from credit card and other revolving credit sources, where is the money coming from to finance the consumer economy recovery? What is “Personal Consumption Expenditures” anyway?
A seemingly simple and innocent question about personal expenditures once again leads us to unexpected places, in this case through the bowels of the U.S. National Income and Product Accounts (NIPA) and Fed Flow of Funds data. There we discovered that approximately half of the Personal Consumption Expenditures (PCE) measure appears to have little to do with consumers spending money on dinners and iPods in the Productive Economy and everything to do with paying interest on mortgages, bank fees, and other economic rents in the FIRE Economy. In the process, we discover just why the economy feels as bad as it does even though the PCE numbers present an economy on a rapid recovery path, and why the latest GDP report is utter nonsense.
We start our journey through the Great Recession fallout with the chart that first raised the question, PCE since 1969.
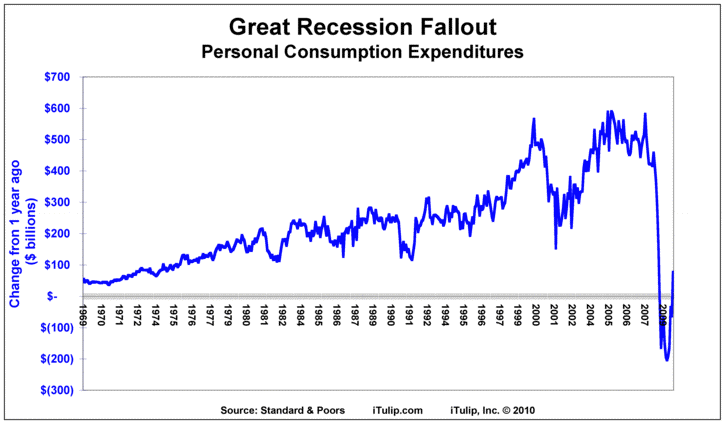
On a year-over-year basis, PCE appears to be recovering powerfully from an economic crisis that took PCE down off the scale. Partly this miracle results from comparing Armageddon to a subsequent period of merely horrid economic performance, but even viewed as level of PCE rather than year over year change, the data present a picture of complete recovery.
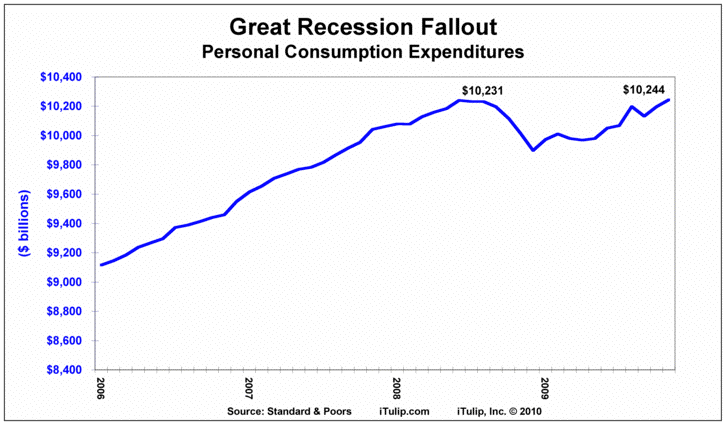
PCE as of Dec. 2009 has not only recovered to pre-crisis levels but is at an all-time high of $10.2 trillion at an annualized rate. The decline on a percentage basis through the recession was a surprisingly modest 3.5% between June 2008 when the drop began and December 2008 when it ended and started to recover. Odd that an economic catastrophe that resulted in more than ten million newly unemployed registers as a small 3.5% dip in PCE. But no matter; the data say Recovery Has Arrived, right?
PCE Mystery
Despite what the term Personal Consumption Expenditures appears to describe, the measure has less to do with individuals consuming goods and services than with debt-related transactions by households in the FIRE Economy.
Three components comprise PCE: Durable Goods, Non-durable Goods, and Services. Durable Goods are things like autos and appliances that you don’t buy often because they last for years. Non-durable Goods are items like food and beer that you buy frequently because you need them but they don’t last long—especially beer. Services is by far the largest part of PCE, and as we shall see includes not only haircuts and auto repairs but interest on debt and other forms of “economic rent.”
“Services” represented $6.9 trillion of the $10.2 trillion PCE total in Dec. 2009 on an annualized basis, while Non-durable Goods represented $2.3 trillion and Durable Goods only $1.0 trillion. The remaining $4 trillion of our $14.2 trillion GDP is public sector spending.
On a percentage basis, the Services component of PCE has grown from 45% to 67% of since 1959 while Non-durable Goods fell from 41% to 22% and Durable Goods from 14% to 11%. We often hear that the U.S. economy has become a “services economy,” because so much of GDP is the Services component of PCE. But calling this gigantic financial area of our economy “Services” is misleading.
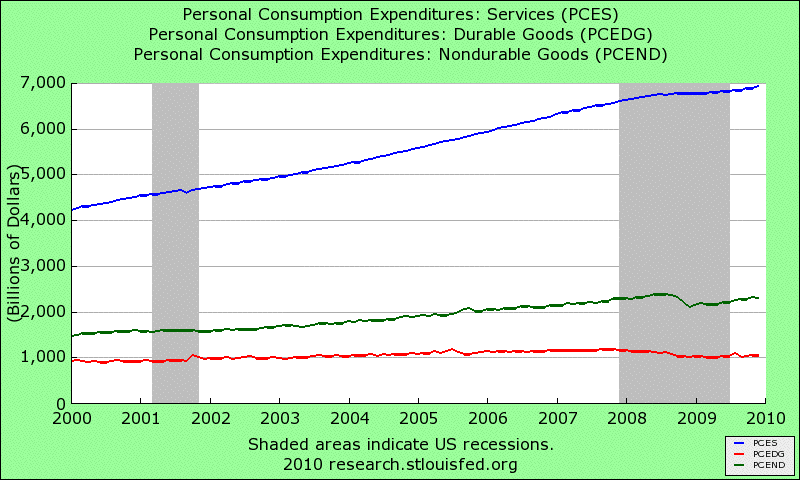
The Durable Goods component of PCE peaked at $1.2 trillion and began to decline at the start of the recession in Q4 2007, and continues to decline. Non-durable Goods peaked in Q3 2008, dipped to $2.1 at the start of 2009, and has since then staged a near full recovery. But Services began The Great Recession at $6.7 trillion and never skipped a beat, rising all through the recession to $6.9 trillion today. How is that possible? What is in this mysterious “Services” component of PCE that makes it immune to the worst recession since The Great Depression? To get to the bottom of the mystery, we start by reviewing the impact of the recession and its residual effects.
Fallout from The Great Recession
The recession officially ended in Q3 2009, but leaves behind high and rising unemployment, persistent unemployment, falling personal income, and negative revolving credit growth. It is unintuitive that the services expenditure in the economy kept growing throughout this.
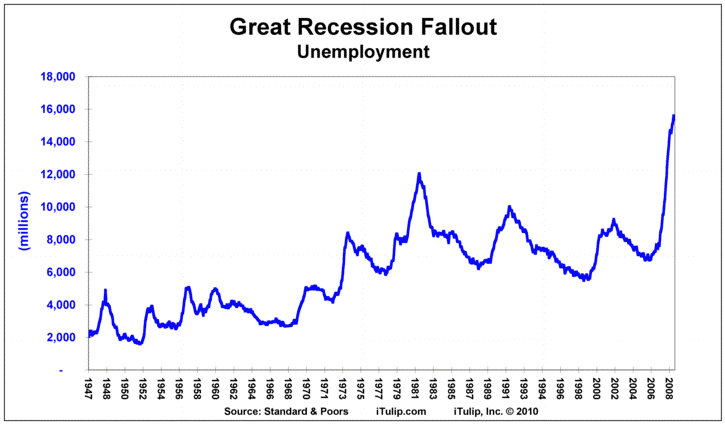
Unemployment grew from six to 16 million during The Great Recession, yet the Services component of PCE continued to grow.
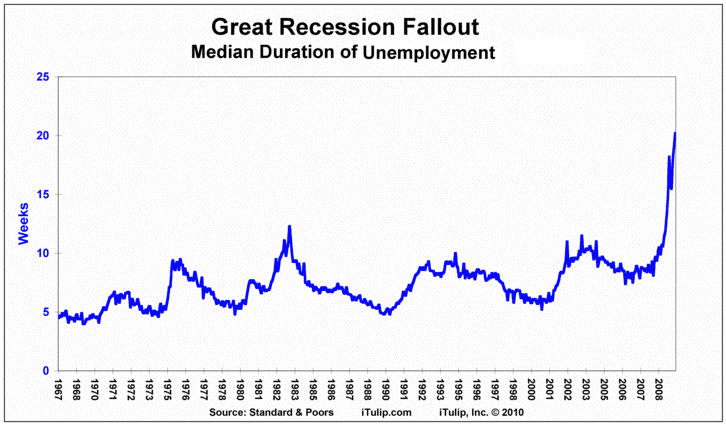
Duration of unemployment, the number of weeks that millions of officially unemployed have been out of work, tripled from seven to 21 weeks during The Great Recession, yet Services kept growing.
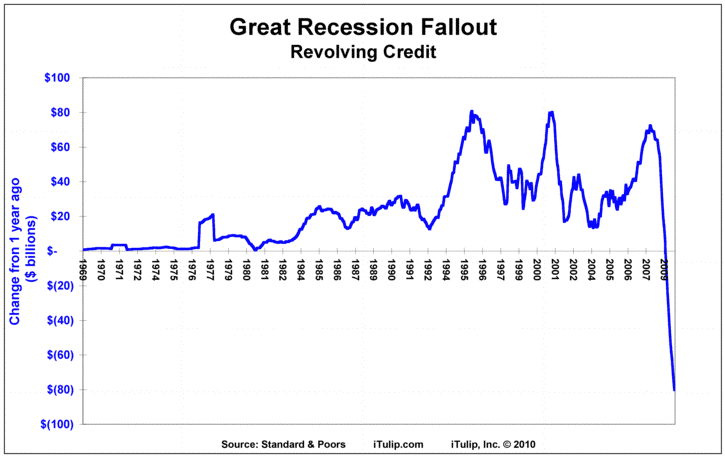
Revolving credit growth, primarily credit cards and auto loans, turned negative for the first time on record during The Great Recession, yet Services personal expenditure kept climbing.
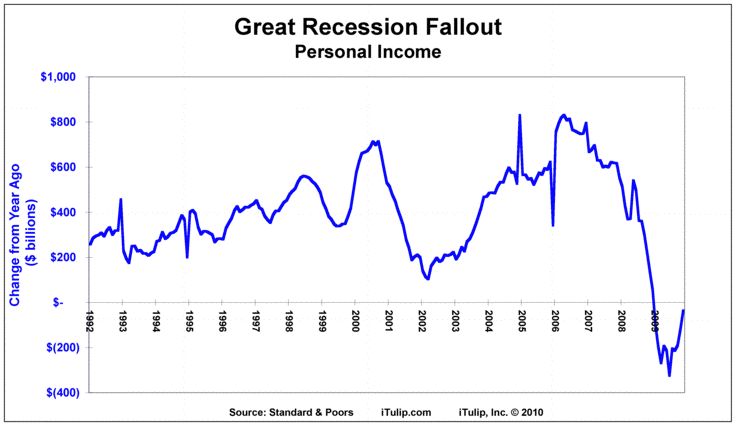
Personal Income fell during The Great Recession, recently rebounding from the Armageddon collapse from 2006 to mid 2009 while the Services component of PCE grew the whole time.
The data in the graphs above accord with the stories we hear and our own observations, of friends out of work or working for far less, of boarded up storefronts and reduced store inventories. Evidence that goods-producers suffered badly is no surprise.
The data in the graphs above accord with the stories we hear and our own observations, of friends out of work or working for far less, of boarded up storefronts and reduced store inventories. Evidence that goods-producers suffered badly is no surprise.
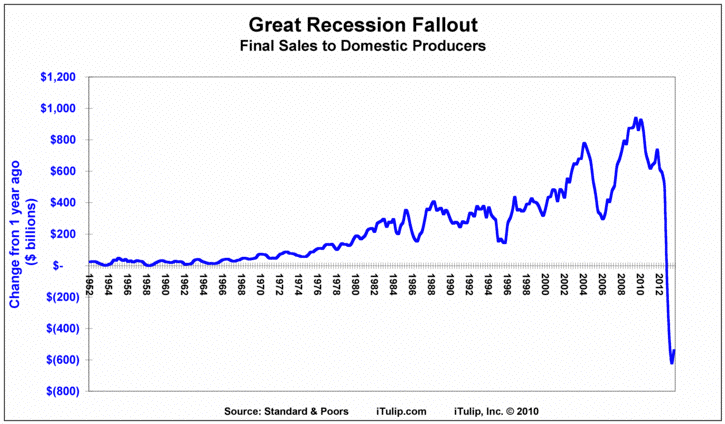
Final sales turned negative for the first time on record.
All this yet PCE shows the economy is back to business as usual. This did not make sense to us, so we started digging.
First we focused on the Durable and Non-durable Goods components of PCE, separate from Services. We’d expect these to be comparable to sales by retailers to consumers. Maybe a comparison will help us understand the disconnect between the Great Recession fallout and the PCE data.
Retail Sales Recovery
Retail sales data, collected by the Census Bureau, measures the aggregate dollar price of merchandise sold for cash or credit by retailers to consumers. Durable goods, such as appliances and autos, make up 40% of Retail Sales. The balance consists of non-durables, such as gasoline, meals at restaurants, and general merchandise. The Retail Sales data report purchases of goods only, not services, and the data are not adjusted for inflation.
Sans the mysterious Services component of PCE, we expected Goods PCE and Retail Sales to be approximately the same, or at least proportionate. They are not.
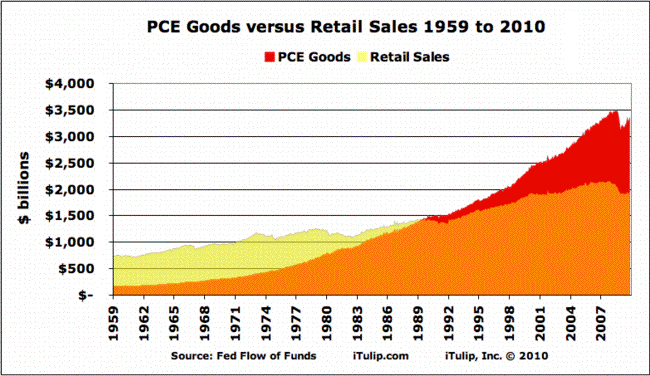
The yellow area in the chart above is Retail Sales. The red area is Durable Goods plus Non-durable Goods PCE added together. The orange area shows the overlap of both the Goods PCE and Retail Sales series.
In 1959 the total amount spent by consumers on goods at retail stores was more than four times Durable Goods plus Non-durable Goods PCE. By the end of 2009 Goods PCE was 40% more than Retail Sales.
How can Goods PCE grow so much faster than the sales revenue of retailers? Retail Sales grows linearly while Goods PCE grows in a non-linear fashion, in the classic manner of compound interest. We put this oddity aside for the moment and focus instead on the sharp decline in Goods PCE and Retail Sales during the recession. The data on store closings reflects what we see in the Retail Sales graph.
Retail's Armageddon-lite
In 2008, 35 retailers closed 4,321 stores. Below we list the number of stores and the retailer name by order of the largest number of store closings.
384 Bombay (all stores)
378 Movie Gallery
371 Linens 'N Things (all stores)
356 KB Toys
184 Sharper Image
181 Rite Aid
173 Steve & Barry's (all stores)
160 Wilson Leather
154 Pacific Sunwear / PacSun
149 Mervyn's (all stores)
140 Dell
140 Footlocker
126 Office Depot
125 Sprint/Nextel
120 Friedmans
117 Ann Taylor
112 Office Depot
105 Zales
103 CompUSA (all stores)
100 Fashion Bug
98 Disney
85 GAP
78 Club Libby Lu Saks (all stores)
78 Talbots Kids/Mens
54 Sigrid Olsen
41 Sergio Rossi
40 Lane Bryant
31 Pep Boys
29 Eddie Bauer
26 Dillards
25 Pier 1
20 Cache
15 Home Depot
12 Ethan Allen
11 Macy's
Bad as 2008 was for retailers, 2009 produced almost four times as many store closings by more than six times as many retailers. A total of 255 retailers closed 16,232 stores, producing the common sight of “For Lease” and “Going Out of Business” signs in every mall and downtown across the US.378 Movie Gallery
371 Linens 'N Things (all stores)
356 KB Toys
184 Sharper Image
181 Rite Aid
173 Steve & Barry's (all stores)
160 Wilson Leather
154 Pacific Sunwear / PacSun
149 Mervyn's (all stores)
140 Dell
140 Footlocker
126 Office Depot
125 Sprint/Nextel
120 Friedmans
117 Ann Taylor
112 Office Depot
105 Zales
103 CompUSA (all stores)
100 Fashion Bug
98 Disney
85 GAP
78 Club Libby Lu Saks (all stores)
78 Talbots Kids/Mens
54 Sigrid Olsen
41 Sergio Rossi
40 Lane Bryant
31 Pep Boys
29 Eddie Bauer
26 Dillards
25 Pier 1
20 Cache
15 Home Depot
12 Ethan Allen
11 Macy's
2,639 General Motors
960 Blockbuster
789 Chrysler
567 Circuit City
461 KB Toys
450 Movie Gallery (Game Crazy, Hollywood Video)
365 Ritz Camera
273 Starbucks
287 Goody's
265 Jones Apparel Group (2009 & 2010)
240 Waldenbooks
224 Foot Locker
191 Zale Corporation
175 Van Heusen
163 Ann Taylor (by 2010)
162 Charming Shoppes
161 InkStop
160 Family Dollar
150 Popeye's (AFC Enterprises)
135 S&K Famous Brands Inc.
130 Advance America
129 Boater's World
125 F.Y.E. (Trans World Entertainment)
121 Eddie Bauer
118 Office Depot
117 Rite Aid
104 Finlay Enterprises
102 Payless Shoes
100 Albertsons
100 Gap, Inc.
98 Club Libby Lu (Saks)
85 NextCen Brands (Great American Cookies, MagieMoo's, Marble Slab Creamery, Pretzelmaker)
84 Payless Shoes
84 Samsonite
81 Saab Dealerships
77 Game Stop
75 J. Jill
75 Signet Jewelers
70 Famous Footwear (Brown Shoe Co.)
60 Arby's
60 Collective Brands
60 Dominos
59 Advance Auto Parts
59 Ruby Tuesday
58 Gottschalks
56 Smith & Hawken
53 Rex Appliance & Electronics
50 B Dalton
50 Pacific Sunwear
50 Select Comfort
50 Supervalu
50 New York & Co. (over the next five years)
48 Home Depot (Expo, YardBIRDS, Design Center, HDBath)
48 Ultra
46 Anchor Blue
45 Cato
44 Check 'n Go
43 Destination Maternity
40 Justice
40 Kirkland's
40 Tween Brands (Limited Two, Justince)
38 Bruno's
34 Bachrach
32 Big 10 Tires
31 Pier One
30 Big Lots
30 Jo-Ann Stores
29 Basha's Supermarket
29 Ruehl (Abercrombie & Fitch)
28 Kmart
28 Yankee Candle
26 Cost Plus
25 Chico's FAS
25 Dress Barn
25 Finish Line
25 Fred's
25 Luby's
24 Blue Tulip Gift Shops
24 Cashland
24 Sears
23 Sportsman's Warehouse
22 AFC Enterprises
21 Papa John's
21 ZGallerie
20 Baja Fresh Mexican Grill
20 Man Alive (Finish Line)
20 Oneida Ltd.
20 Pumpkin Patch
20 Wendy's
20 Wet Seal
19 Snyder's Drug Stores, Inc.
18 Black Angus
18 O'Reilly Automotive
16 Filene's Basement
16 Iridesse (Tiffany & Co.)
16 Men's Wearhouse
16 Shoe Carnival
16 Talbot's
16 Williams-Sonoma
15 Tim Horton's
15 West Marine
14 Whataburger
13 OfficeMax
13 Stein Mart
12 Bealls
12 Kira Plastinina
11 99 Cent Only Stores
11 Better Bedding Shops, Inc.
11 Jimmy'Z (Aeropostale)
11 Macy's
11 Pamida
10 Casual Male
10 Holcomb's Education Resource
10 Bassett Home Furnishings
10 Dollar General
10 E&J's Shoes
10 P.F. Chang's Pei Wei Restaurants
10 U.S. Cellular
9 American Eagle
9 California Herbal Relief Center
9 Rally's
8 Active Ride Shop
8 Dillard's
7 Auto Nation
7 Damon's
7 Flying J's
8 MarineMax
7 Penn Traffic (P&C Foods, BiLO)
7 Plunkett Furniture
7 Sweetbay Supermarkets
6 Denny's
6 Destination Maternity
6 Music City Record Distributors
6 Pulix
6 Whole Foods
6 Winn Dixie
5 Borders
5 Krispy Kreme
5 Mark Shale
5 Stock Building Supply
5 Target
4 Albertson's
4 Applebees
4 Coach
4 Girl Scout Stores
4 Red Robin Gourmet Burgers
4 Harry W. Schwartz Bookshops
4 Jagmania
4 Jennifer Convertibles
4 Lucky Grocery Stores
4 Sacino & Sons
3 Blockbuster
3 Bulgari
3 Dollar Tree
3 Food World
3 Good's Furniture & Flooring
3 Guess
3 Hawaiian Telecom
3 High Point Coffee
3 Jamba Juice
3 Lane Bryant
3 P&C Food Markets
3 Virgin Records
2 A.C. Moore
2 Bailey Banks & Biddle
2 Belk
2 Bob Evans
2 Checker Auto Parts
2 Costco Home Stores
2 Dunkin Donuts
2 Hacketts
2 Homer's Music and Gifts
2 Hypnoses
2 Jewel-Osco
2 Kragen Auto Parts
2 L'Oreal Paris
2 MarBeck Appliance Parts
2 Morton's
2 Natuzzi Americas
2 Piggly Wiggly
2 Plan 9 Music
2 Pop Tunes
2 Rees Jewelers
2 Robinson Luggage
2 Rooms Express
2 Ruth's Chris
2 Salvation Army Thrift Stores
2 Sears Essentials
2 Shaw's
2 Sheetz
2 SK Restaurant Group
2 Spicy Pickle
2 Storables
2 Thomasville Home Furnishings
1 Ace Hardware
1 Andersons General Store
1 Atlanta Bread Company
1 AutoZone
1 Badcock Home Furniture & More
1 Beverly Hall
1 Bon-Ton
1 Bigham’s
1 Bulgari
1 Cici's
1 Congress
1 Crabtree & Evelyn
1 Cub Foods
1 D'Amica Cucina
1 Disney Store
1 E&J's Designer Shoe Outlet
1 El Paso Bar-B-Que
1 Fleeger's Hardware
1 Fresh City
1 Fresh Market
1 Giant Market
1 Goldberg's
1 Hershey's Gifts (online store)
1 IGA
1 KC Masterpiece
1 Lord & Taylor
1 Lowe's
1 Max Mara
1 McCormick & Schmick's
1 Mel's Diner
1 Midtown Foods
1 Monroe IGA
1 Nike
1 Powell's
1 Record Theatre
1 RJ Gator's
1 Roy's Hawaiian Fusion
1 Safeway
1 Sam's Wine & Spirits
1 Schneiderman's Furniture
1 Scrambler Marie's
1 Smith's Food & Drug
1 Sony PlayStation Store
1 Sony Style Store
1 Southern Family Markets
1 Spartan Stores
1 Staples
1 Stax Omega Restaurant
1 Trader Vic's
1 Ukrop's
1 Uno Chicago Grill
1 Urban Fresh (Supervalu)
1 Victoria's Secret
1 Vons
1 West Elm (Williams Sonoma)
1 White's Fresh Foods
1 Wilson Farms Store
1 Winchell's Donut House
1 World Market
1 Wal-Mart
More than 20,000 stores closed over the past two years, with the bulk of the losses in 2009. Is the worst behind us? Year over year change in Retail Sales shows a sharp recovery starting in early 2009.
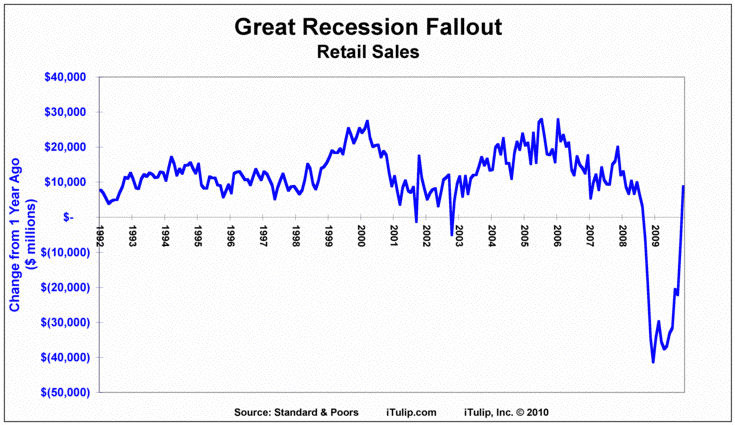
The year over year data that compare Dec. 2009 to Dec. 2008 shows a sharp recovery.
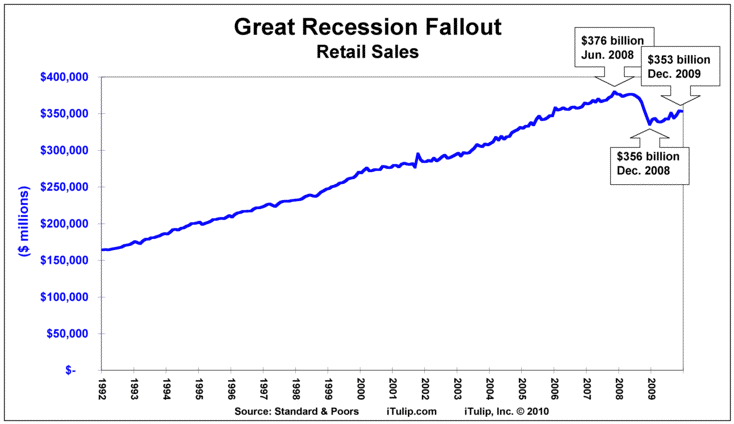
You may wonder how a 5.3% monthly decline in Retail Sales, from $376 billion in Jun. 2008 to $356 billion in Dec. 2008, translated into 20,000 store closings. The answer is that there are approximately 1.2 million retail stores in the U.S. The 5.3% decline in Retail Sales coincided with the closing of approximately 2.4% of retail stores. That doesn't sound so bad. It's beyond the scope of this analysis, but it is the character of store closings—the average size of each store and changes in inventories and merchandise sold rather than the total number that puts the number of closings that tell the real story. The U.S. has survived the ordeal, but the so-called "new normal" is the poorer and more third-world version that we warned about a year ago in Fed cuts dollar, Fire sales vs FIRE sales, Duh-flation, and Bezzle shrinks again. The insidious erosion of purchasing power continues as the same dollars earned today buy lower quality goods and services than before.
Getting back to the PCE Services mystery, personal consumption expenditure includes not only goods and services as you'd expect but interest and fees on goods and assets that were purchased in the past.
Getting back to the PCE Services mystery, personal consumption expenditure includes not only goods and services as you'd expect but interest and fees on goods and assets that were purchased in the past.
Top level list of components of PCE
- Purchases of new goods and services by individuals
- Purchases of goods and services by nonprofit institutions
- Used goods
- Purchases of goods and services abroad by U.S. residents
- Imputed transactions
Services PCE includes haircuts and car repairs, but mortgage payments, auto payments, and credit card payments inflate the total.
We return to the chart we created earlier that compares money spent by consumers at retailers and total PCE on Durable and Non-Durable Goods.
We return to the chart we created earlier that compares money spent by consumers at retailers and total PCE on Durable and Non-Durable Goods.

Retail Sales measures sales of goods by retailers to consumers. Goods PCE measures the purchase of goods by consumers, plus the imputed interest payments on the debt taken on by consumers when they use credit to purchase these goods.
What you are looking at above is a Productive versus FIRE Economy comparison, the impact of the rise in the use of credit by consumers to purchase goods, and also home price inflation, since 1959. Note that the inflection occurs, as other charts we have shown you over the years, around the time of the end of the international gold standard and birth of the FIRE Economy in the early 1970s.
Notice also the impact of compound interest on the shape of the Goods PCE curve compared to the linear growth shape of the Retail Sales curve. The chart shows a layer of FIRE Economy sitting on top of the Productive economy, approximately $1.5 trillion in PCE on top of $2 trillion of Retail Sales in Dec. 2009 on an annualized basis. It is, as far as we know, the first chart that depicts the additive impact of the FIRE Economy to the Productive Economy.
While the FIRE Economy has largely recovered, the “real economy” remains sick.
Productive economy falters
Behind the encouraging 5.7% Q4 2009 GDP number released today is the fact that much of the PCE component of GDP is FIRE, and the rest is government spending. The stock market doesn't appear to be buying the idea that an economic recovery based on public debt expansion is sustainable. Beyond the credit limit on the government credit card that is quickly becoming a political football for the midterm elections, maybe the stock market is looking at something else.
Measures of real output
Here we review a number of measures of real economic output that are distinct from FIRE Economy measures.
Total rail traffic in the U.S. in 2009 was below 2008 levels, and trended down into the 4th quarter of 2009 as during 2008, curiously in a quarter when GDP numbers were robust.
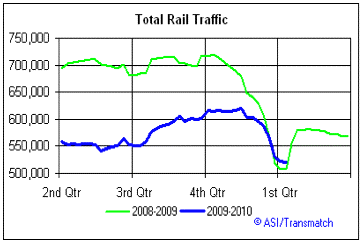
If the economy is truly recovering we'd expect to see a climb in rail traffic to 2007 levels in Q4 2009 not a collapse to Q4 2008 lows.
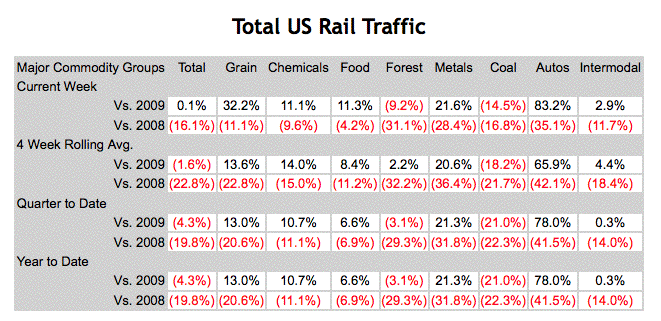
Given the crash in rail traffic in 2008 and 2009, any negative year over year traffic numbers in the current period are surprising.
Shipments of autos, presumably to replenish inventories after the "Cash for Clunkers" draw-down, shows robust growth. Food, grain, chemicals, and metals showed double digit growth over 2009 levels but not 2008 levels.
Looking at the totals, only by the measure of the current week is total rail traffic up over the same period in 2009, and only by a thin 0.1% margin. On a four week rolling average basis, total rail traffic is off nearly 20% from the same period in 2008. Even more remarkable is the drop off in coal shipments, off 21% from 2008 and 18% from 2009 levels on a four week rolling average basis.
Energy demand is indicative of economic performance, at least on a relative same-country basis. If an economy is recovering compared to last year, then why has U.S. crude oil demand fallen compared to a year ago?
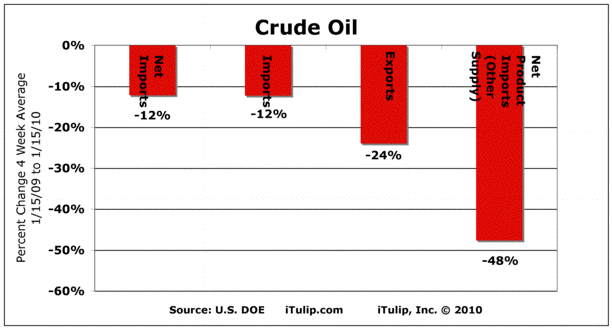
According to the latest DOE report, net crude oil imports are off 24%, and net imports of all energy materials, including natural gas, are off 48%. Isn’t energy demand supposed to rise when the economy is recovering?
Electrical energy demand is as close to a government statistics-independent proxy for real economic growth as you can get, at least in the medium term, that is, in periods of more than three months but under two years. Short-term factors such as weather can impact electricity demand for short periods, and increased efficiencies and substitutions can lower demand over extended periods.
According to the latest DOE report published Jan. 15, 2010 that covers the year ending Oct. 2009, “Year-to-date, total net generation was down 4.6 percent from 2008 levels. Net generation attributable to coal-fired plants was down 12.4 percent. Nuclear generation was down 0.4 percent. Generation from petroleum liquids was down 11.4 percent, while natural gas-fired generation was up by 3.9 percent year-to-date.”
A recent update extends this decline into Nov. 2009, stating, “Total electric power generation in the United States decreased 5.6 percent from November 2008. Over the same period, coal generation decreased 12.2 percent as a result of the increased cost of coal as a fuel used in electricity generation and the decrease in demand for electric power due to the economic downturn in the United States.”
That means that electrical energy demand during the “as good as it gets” fiscal spending recovery quarter of Q3 2009 that we forecast in April 2009 was actually below the Armageddon period of Q3 2008 before the fiscal stimulus programs started and when monetary stimulus was still effective.
The great asset collapse
If the economy still “feels” worse to you than the numbers suggest, the preceding data on the state of the real economy help to explain why. But even as the so-called PCE Services measure of the FIRE Economy send signals of recovery, the latest Flow of Funds data show that the foundation of the FIRE Economy, asset prices, continues to rot.
During the Great Recession private assets lost ground as government-issued and nationalized private assets gained.
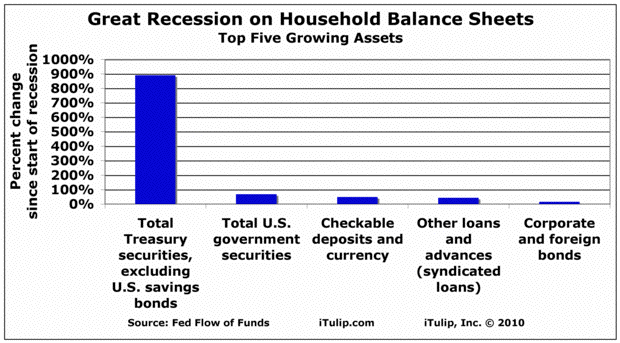
On a percentage basis, Treasury bonds became very, very popular during The Great Recession, between Dec. 2007 when we issued our warning that the Debt Deflation Bear Market started and Dec. 10, 2009 when the latest Flow of Funds report came out that covers the Q3 2009 period.
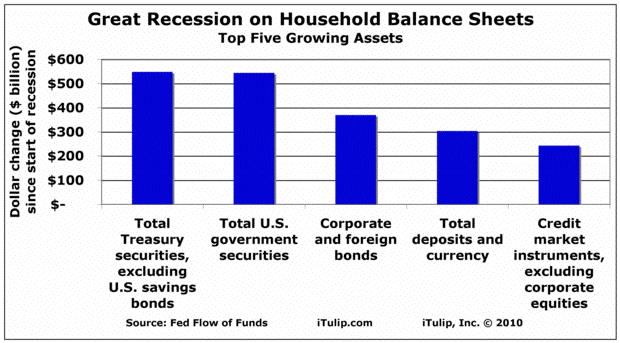
In dollar terms, the top five fastest growing household assets are Treasury bonds, government securities (municipal bonds), and Corporate bonds. Bank savings and money market accounts grew by $250 billion in total.
While they purchased these assets, what did U.S. households sell?
While they purchased these assets, what did U.S. households sell?
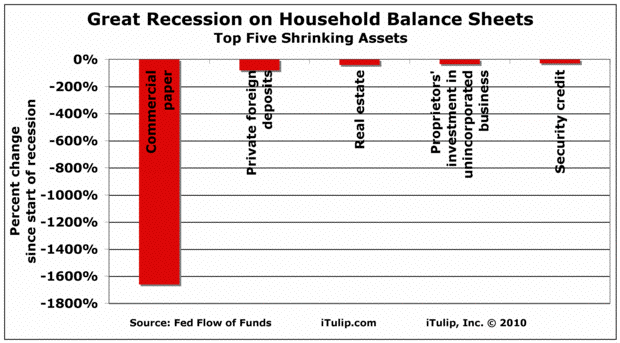
On a percentage basis, households dumped Commercial more than any other of the top five losers.
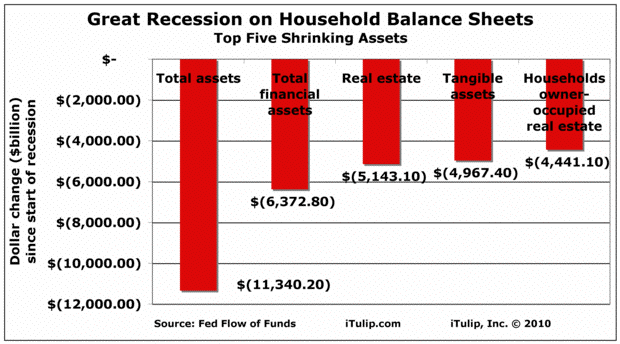
On a dollar basis, while the total is not cumulative, the order of the top five big losers by asset category lays out the order of precedence.
Total assets fell by over $11 trillion, financial assets by $6.3 trillion, real estate by $5.1 trillion, tangible assets by $5 trillion, and owner-occupied real estate by $4.4 trillion. Based on today’s news that U.S. home prices fell by 12% in 2009, the next Flow of Funds report is likely to show even more Real Estate carnage.
If you add up all of the losses in the value of assets held by households during the recession (holding gains on assets), the sum comes out to a stunning $13.6 trillion, of which $7.6 trillion is real estate asset price loss.
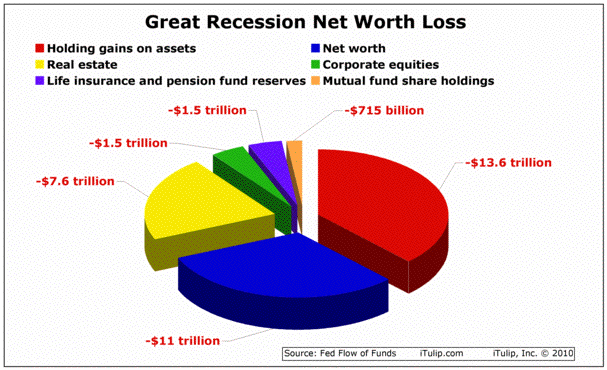
The net worth of U.S. households has fallen by $11 trillion as of the end of Q3 2009, this despite a strong recovery in portfolios due to rising stock prices.
Remember that PCE, comprised of 40% interest and other economic rents on production, improved at a $10.3 trillion annual rate in Dec. 2009? That only slightly offsets a $13 trillion loss in asset values over the same period.
Conclusion
Our earlier report of the death of the FIRE Economy was wildly exaggerated. PCE increased even during The Great Recession because the so-called Services component—that makes up 67% of the measure—grew due to interest and fees on existing debt.
Unemployment remains high and has yet to decline, real personal income is falling, revolving credit continues to contract, the value of assets held by households has been devastated by a $13 trillion loss, and household net worth took a $11 trillion haircut.
More than ten million people lost their jobs and 20,000 retail stores closed. Rail traffic is anemic, and energy demand is falling.
The data we see frequently displayed as evidence of recovery instead reveal an underlying weakness in the structure of the U.S. economy, and both the ineffectiveness and unsustainability of fiscal stimulus and monetary policy, and the fallacious reporting of economic rents as economic output.
As we said in "FIRE Economy Fallout -- Part I: Recession ends, depression begins” the fallout from The Great Recession will dog the U.S. economy until the underlying problem is addressed: the dependence of the U.S. economy on private market debt financed economic growth, and on government spending when the private credit markets are unable to meet demand.
The stimulus that has sustained the illusion has not come cheaply.
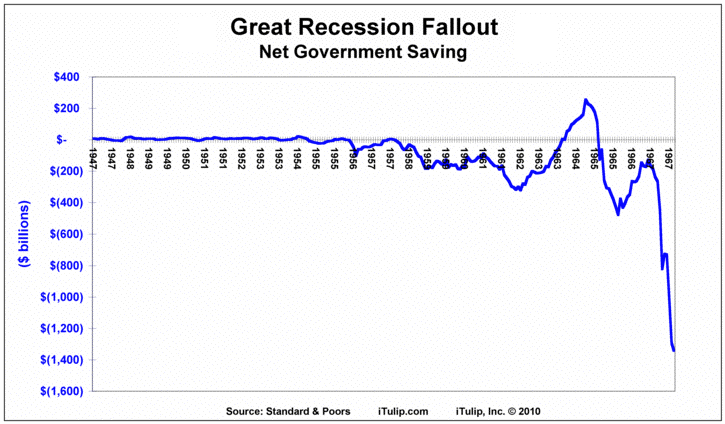
These bad facts take us full circle back to our argument that we made for three years before the government executed the re-inflation policies we predicted. Before Q4 2007, in order to grow the economy depended on low interest rates, a weak dollar, government spending, foreign borrowing, and asset price inflation. After the crisis and asset price deflation the economy has come to depend on near zero interest rates, a weak dollar, government spending, foreign borrowing, and asset price maintenance merely to avoid a new crisis.
Special lending programs expand government credit in a vain attempt to keep real estate asset prices from falling even farther than they have since 2006.
New spending programs borrow more at home and abroad to “create jobs,” a dubious proposition based on the misapprehension that increased taxation and borrowing, ultimately from businesses, produces a net long-term gain in total employment.
Economists Stiglitz and Krugman argue that even more spending is needed to get the economy on a self-sustained growth path, while both Democrat and Republican candidates in midterm elections jockey for position on a platform of fiscal restraint.
The argument over bigger or smaller deficits or will not go on forever. Judgment Day approaches, and we believe its arrival may be hastened by recent developments that we cover in Part II.
Everything is up for grabs.
The Fog of Economic Crisis - Part II: Where the hell are we?
• First Bounce of the Debt Deflation Bear Market ended
• No more easy shorts
• Waiting for the end of the world
A few weeks ago I’m on the phone waiting my turn to be interviewed as part of an NPR panel discussion. The segment begins with a replay of Vice President Joe Biden bellowing “No more bubbles!” In the same speech he blasts the "cowboys on Wall Street" and blames the nation's financial center for "an economy built on a bubble."
The populist accusations, while roughly conforming to fact, neglect the inconvenient truth that the prior bubble in dot com and telecommunications company stocks, years before the housing bubble, inflated during the Clinton administration.
In any event, the drama is wasted. The Obama administration need not worry about another big bad bubble. We are not going to have one, not for a very long time.
I know, I know. The title of my now two year old Harper's Magazine article was titled "The Next Bubble." But don't forget the conclusion: "Given the current state of our economy, the only thing worse than a new bubble would be its absence."
That was my warning at the time that after the crash yet to come, our bubble-dependent economy sans new bubble will be a poorer place, one of living standards below those to which many had become accustomed, based as they were on borrowing and wealth from rising asset prices. That ended in 2007. more...
iTulip Select: The Investment Thesis for the Next Cycle™
__________________________________________________
To receive the iTulip Newsletter or iTulip Alerts, Join our FREE Email Mailing List
Copyright © iTulip, Inc. 1998 - 2010 All Rights Reserved
All information provided "as is" for informational purposes only, not intended for trading purposes or advice. Nothing appearing on this website should be considered a recommendation to buy or to sell any security or related financial instrument. iTulip, Inc. is not liable for any informational errors, incompleteness, or delays, or for any actions taken in reliance on information contained herein. Full Disclaimer
Special lending programs expand government credit in a vain attempt to keep real estate asset prices from falling even farther than they have since 2006.
New spending programs borrow more at home and abroad to “create jobs,” a dubious proposition based on the misapprehension that increased taxation and borrowing, ultimately from businesses, produces a net long-term gain in total employment.
Economists Stiglitz and Krugman argue that even more spending is needed to get the economy on a self-sustained growth path, while both Democrat and Republican candidates in midterm elections jockey for position on a platform of fiscal restraint.
The argument over bigger or smaller deficits or will not go on forever. Judgment Day approaches, and we believe its arrival may be hastened by recent developments that we cover in Part II.
Everything is up for grabs.
 |
• First Bounce of the Debt Deflation Bear Market ended
• No more easy shorts
• Waiting for the end of the world
A few weeks ago I’m on the phone waiting my turn to be interviewed as part of an NPR panel discussion. The segment begins with a replay of Vice President Joe Biden bellowing “No more bubbles!” In the same speech he blasts the "cowboys on Wall Street" and blames the nation's financial center for "an economy built on a bubble."
The populist accusations, while roughly conforming to fact, neglect the inconvenient truth that the prior bubble in dot com and telecommunications company stocks, years before the housing bubble, inflated during the Clinton administration.
In any event, the drama is wasted. The Obama administration need not worry about another big bad bubble. We are not going to have one, not for a very long time.
I know, I know. The title of my now two year old Harper's Magazine article was titled "The Next Bubble." But don't forget the conclusion: "Given the current state of our economy, the only thing worse than a new bubble would be its absence."
That was my warning at the time that after the crash yet to come, our bubble-dependent economy sans new bubble will be a poorer place, one of living standards below those to which many had become accustomed, based as they were on borrowing and wealth from rising asset prices. That ended in 2007. more...
iTulip Select: The Investment Thesis for the Next Cycle™
__________________________________________________
To receive the iTulip Newsletter or iTulip Alerts, Join our FREE Email Mailing List
Copyright © iTulip, Inc. 1998 - 2010 All Rights Reserved
All information provided "as is" for informational purposes only, not intended for trading purposes or advice. Nothing appearing on this website should be considered a recommendation to buy or to sell any security or related financial instrument. iTulip, Inc. is not liable for any informational errors, incompleteness, or delays, or for any actions taken in reliance on information contained herein. Full Disclaimer


Comment