Originally posted by MarkL
View Post
-
Re: August 2009 FIRE Economy Depression update – Part I: Snowball in Summer - Eric Janszen
Here's an answer, though FRED has one he prefers: Copy whatever picture you're interest in and put it into your computer. Opened a post window here and look down beneath it to manage attachments. There you'll have the option to upload your picture to iTulip. Once it is uploaded click on it. I believe it will be in a list of current attachments in that same window. Click the "mountain" icon = "insert image" (at the top of your Reply to Thread message window and copy the URL from the window that shows your picture, which is now on iTulips server, and paste it into the "insert image" box, and don't duplicate the "http://" If I have succeeded in describing that, then it should work. -
Re: August 2009 FIRE Economy Depression update – Part I: Snowball in Summer - Eric Janszen
I Google'd "John Williams CPI" and was directed to this site. The "Alternative CPI Measures" chart on the home page don't (to me) reflect a 6% cpi... it shows 3 different CPIs, two at -2% and a Clinton era one at 1%. http://www.shadowstats.com/ Am I on the wrong site? Am I reading this incorrectly? Thanks for introducing me to him.Originally posted by bart View Post
Wait! I think I see now. This chart on the home page labeled "Alternative CPI Measures" aren't John William's Alternative CPI Measures. They are different goverment measures. Badly labeled. I found the 6% figure deeper in the site. The guy should put his work on his home page! Anyway, please ignore the above!
Can someone tell me where you put charts/graphs/pictures so I can post them here? This site doesn't allow me to simply upload them....
Oh, and Bart, to counter in advance one of your std claims... I'm not responding to every single point in your post, because I either agree with them, didn't come up with something interesting to say on them, or think that the person to who they were directed should address them... not because I'm trying to use one of the 25 rules of disinformation! I thought the rest of your post was valuable. However, this point is the one that drew my attention and on which I had something of value to contribute!Last edited by MarkL; August 21, 2009, 12:03 PM.Leave a comment:
-
Re: August 2009 FIRE Economy Depression update – Part I: Snowball in Summer - Eric Janszen
my observation after 10 yrs around here...Originally posted by MarkL View Post
when ej gets into a contest with a deflationista they never concede. they either fade away, change the subject or lie about the position they took before. karl is a good example of this.
i cannot think of one instance where one of them ever said, 'oh, yeh. you were right. they arrested the deflation after a few months like you said. they printed money and reclassified assets and bought crap debt like you said. they depreciated the dollar like you said. the fed exploded its balance sheet like you said...'
no way! they keep moving the goal line over and over again.
deflationistas were ...
- wrong about qe... said the red's never do it
- wrong about the fed buying all the crap mortgage debt
- wrong about the amount that the fed expanded its balance sheet... by over $1 trillion!
- wrong about congress... won't run a > 10% gdp deficit to stimulate the economy
- wrong about ppi/cpi spiralling down and down ala 1930s
wrong, wrong, wrong, wrong, wrong.
how many times do these guys have to be wrong before they take a serious look at the argument?
can't balme ej for calling it game over.
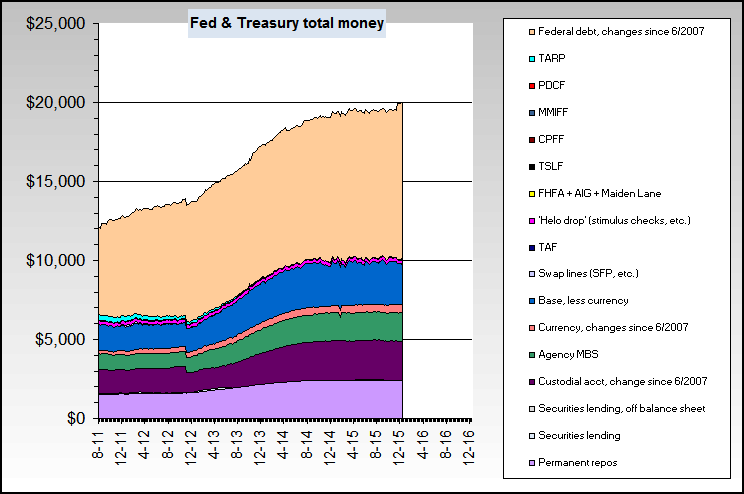
as for the result of all of this reflation bafoonery, this chart is definitive...

the deflation/disinflation that itulip forecast ended in march 2009. itulip noted this in mid may. the smart money listened. the deflationistas kept arguing and nit picking.
as for the idea the recovery in the ppi is a blip ala mid 1930?
compare this...

to this...

maybe the deflationistas can keep the argument alive for a few more months with that one. but what's the point of arguing with them about it? once that test of the deflationist theory fails the deflationistas will invent a new test keep the deflation dream alive.
that reminds me... debt nations dream of deflation... from 2005
Leave a comment:
-
Re: August 2009 FIRE Economy Depression update – Part I: Snowball in Summer - Eric Janszen
Originally posted by jk View Post
As another example of the spin, the CRB commodity index definition was changed back in 2005 to be much more heavily energy weighted. So any comparisons to past CRB numbers that do not use current CCI (the old index) are just plain wrong and very misleading.
And here's the factual evidence of how huge the change was and the spin is.

Leave a comment:
-
Re: August 2009 FIRE Economy Depression update – Part I: Snowball in Summer - Eric Janszen
Originally posted by rdrees View Post
You were using annual rates before, and 1.2% (note that it's a positive number) over 5 months annualized is 2.88%
And "PPI - all commodities", which almost always leads PPI finished goods, was up 2.7% during the same period - an annual rate of 6.55%.
I also note in passing that expressing 1.2% as .012% and also not converting to annual change rates is quite misleading and appears to be a spin attempt in my opinion - thereby my prior comment about "Wall St. calculators".
Additionally, I find it fascinating that you continue to avoid both quite similar data in CPI, and the entire area of CPI corrections from shadowstats.com per the fine work of John Williams (what I call CPI without lies) which shows current CPI in the +6% range.Leave a comment:
-
Re: August 2009 FIRE Economy Depression update – Part I: Snowball in Summer - Eric Janszen
i think fred's and bart's charts make the answer clear, especially fred's note that energy products needed a separate scale since their volatility flattened everything else if using the same scale: the movements you point to are all about crude oil. the recent pullback in ppi is secondary to the drop in oil prices from its high a year ago. looking at the longer term, however, it is clear that crude oil at $70 [and IN THE MIDST OF THE WORST RECESSION IN 2 GENERATIONS!] is historically still very, VERY high. and the longer term trend of energy prices has not been broken by the spike and pullback over '08-'09.Originally posted by rdrees View PostLeave a comment:
-
Re: August 2009 FIRE Economy Depression update – Part I: Snowball in Summer - Eric Janszen
Great Info Bart! Thanks!
I'm personally with EJ on this and believe that the Fed will outspend the downturn. At the moment the political will is waning, but with another leg down the Political impetus will return. This doesn't mean I've completely drank the koolaid however and I can definitely see the counter argument.
To start with, I don't see these charts as definitive at all. Yes, they can be interpreted the way you have. They also can be interpreted the way rdrees has. It's all dependent on which time frame you choose! One year... rdrees wins. 5 months you win. 1 month rdrees wins. Your point that commodities typically lead the rest of the PPI makes a lot of sense however.
When I look at EJ's chart of the 1930's 4 year crash, right around midyear 1930 there is an upward blip. That upward turn of the CPI could be perceived as analogous to the upturn we're in at the moment. It doesn't mean it is! It doesn't mean it's not! It could also be something different like 1 year of upwards movement followed by 4 years of deflation!
Moving away from the micro, on one hand, obviously we have the fact that the Fed is responding in a very different way than they did in 1930! Helicopter Ben appears to be personally willing to do what it takes. On the other hand, while the stock market is up, he may bow to the Congressional pressures he's recently been under and slow down the press.
The one item that throws doubt on EJ's inflation prediction for me is the magnitude of the CDS/CDR debacle and overall debt that needs to be deleveraged. It may be radically bigger than what the Fed is generating.
Some posts here at iTulip claim it to be in the 600T range!! Is the Fed's 1-2T of quantitative easing, outspending the deflationary pressures of that much velocity loss? It's often said that for every dollar the Fed pumps, 6x-9x (I've heard figures in this range) enters the economy. So if the Fed has spent a Trill or Two, that means (assuming the banks are lending and they're really not yet) 6T-18T is entering the economy. Is even this amount enough to counter the figures I've heard of a 60T-600T CDS/CDR debacle?
I've heard the argument that since the banks all owe the CDS/CDRs to each other it doesn't count as money. I've heard others say any paper that is used as a medium of value exchange is money. My conclusion... clearly the CDS/CDR debacle is affecting our economy... which implies it's certainly being treated as real money to some degree!
So we have short term evidence that is inconclusive. We have macro evidence that is largely based on the statement "don't bet against the fed"... but the world may now be larger or Congress may be stronger than the Fed. Deflation/Inflation is still a valid discussion in my book. Personally I come down on the inflation side. But my "confidence level" isn't anywhere near 100%. Perhaps 1 year of continued deflation/"disinflation" is in order before 5 years of sideways movement as demand regen's and THEN inflation? Inflation this next quarter or so as EJ postulated 6 months ago may happen too... it's hard to say.Last edited by MarkL; August 21, 2009, 11:38 AM.Leave a comment:
-
Re: August 2009 FIRE Economy Depression update – Part I: Snowball in Summer - Eric Janszen
Originally posted by metalman View Post
As you might imagine, I do have a few more charts "in reserve" to amaze & delight him if he shows up again. ;)
One additional item about those trend lines that he should address regarding PPI is Newton's law of inertia:
"An object in motion continues in motion with the same speed and in the same direction unless acted upon by an unbalanced force."
... especially given charts like this one:
And just to be as clear as possible, there are no guarantees. Trends do change... but the weight of all of the evidence to date very much points towards inflation.
One final note - [deflationista blogger] has still not answered my post on his blog about M3 or my charts combing M3, credit & gov't debt... can you say ostrich in run & hide mode and worse?.. although to be fair it appears that his comment system is down this morning. But it was up last night and he had plenty of time to respond yesterday.Last edited by bart; August 21, 2009, 11:18 AM.Leave a comment:
-
Re: August 2009 FIRE Economy Depression update – Part I: Snowball in Summer - Eric Janszen
Bart wanted me to use his figures, so I did.
Here's the first set of 5-month figures he posted:
Here's actual Finished Good PPI numbers for the last 5 months:
169.5 169.8 170.2 173.2 171.7
So I took 171.7 (most recent month) - 169.5 (five months ago) = 2.2
Then I divided 2.2 by 171.7 (most recent month) and got 0.012%
So, PPI in finished goods up 0.01% over five months.
The original figures I posted are year on year figures, which shows PPI in finished goods down 6.8% from a year ago. Either way you slice it, it doesn't seem like significantly higher prices are on the immediate horizon.
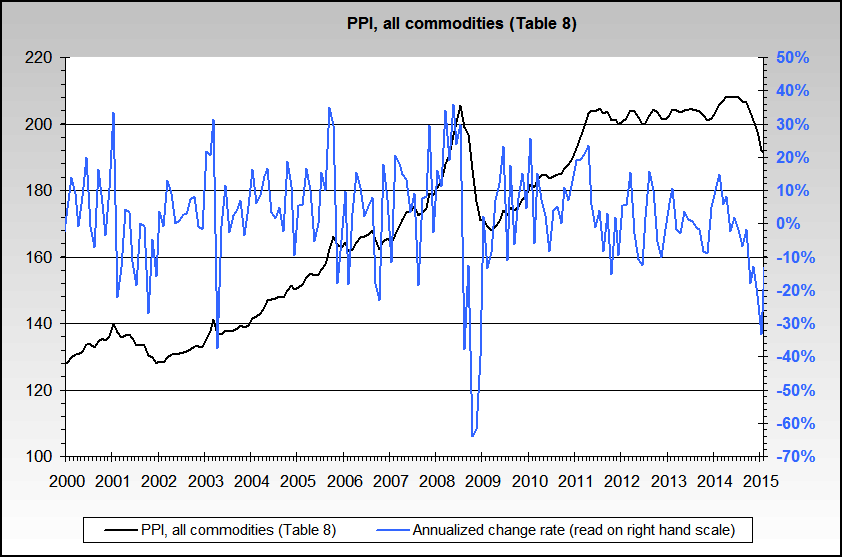
There's no disputing Bart's first graph that we've had inflation since the '70s in this country. The second graph shows the 2008 spike in the PPI, but also that PPI is back where it was about two years ago, and that the annual change rate is heading straight down now.
I think the third graph with the blue line is somewhat misleading. Yes, the annualized change rate is getting smaller (going up), but it's been below zero for nearly all of this year.
As I conceded before, it's next to impossible for us to sustain such large year on year drops in the PPI. But flat to somewhat negative PPI for some time to come certainly looks at least as likely from these graphs as another large increase like the oil driven increase in 2008.Leave a comment:
-
Re: August 2009 FIRE Economy Depression update – Part I: Snowball in Summer - Eric Janszen
Sorry, I don't know. Maybe Finster will see this and respond.Originally posted by vinoveri View Post
The raw gain in PPI all commodities from early 2002 to the recent bottom is 31%, while the CCI shows about an 88% gain during the same period.Leave a comment:
-
Re: August 2009 FIRE Economy Depression update – Part I: Snowball in Summer - Eric Janszen
solid response... does rdrees's silence mean 'ok, you win'?Leave a comment:
-
Re: August 2009 FIRE Economy Depression update – Part I: Snowball in Summer - Eric Janszen
thanks Bart. Do you know if and to what extent the slope of the black line in the middle chart correlates to say the inverse of FDI or $USD?Originally posted by bart View PostLeave a comment:
-
Re: August 2009 FIRE Economy Depression update – Part I: Snowball in Summer - Eric Janszen
Here's some PPI (all commodities) charts. I'd use PPI finished goods, but the all commodities version tends to leads the finished goods version.
The very long term picture:
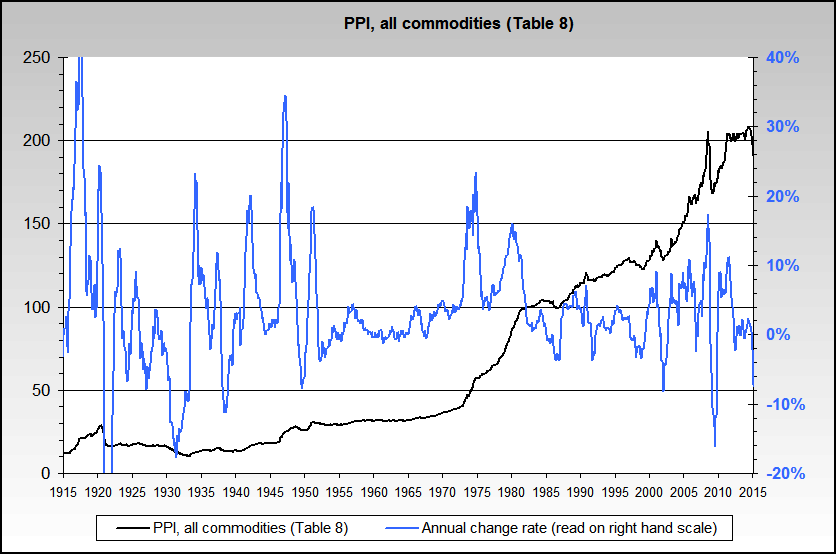
The short term picture, showing the basic underlying trend and with an annual change rate:

Same shorter term period, but this time with annualized change rate with its own recent trend line.
Leave a comment:
-
Re: August 2009 FIRE Economy Depression update – Part I: Snowball in Summer - Eric Janszen
Where DO you get that the PPI is up .01% over the last 5 months?Originally posted by rdrees View Post
These are the original figures you posted:
Finished Goods Intermediate Goods Crude Goods
Dec.: -.9% -2.3% -24.6%
Jan.: -1.0% -3.5% -29.1%
Feb.: -1.4% -5.2% -34.5%
Mar.: -3.5% -8.9% -39.0%
Apr.: -3.7% -10.5% -40.0%
May: -5.0% -12.5% -41.1%
June: -4.6% -12.5% -40.0%
July: -6.8% -15.1% -44.8%Leave a comment:

Leave a comment: