Announcement

Collapse
No announcement yet.

August 2009 FIRE Economy Depression update – Part I: Snowball in Summer - Eric Janszen

Collapse
X
 
  • Filter
  • Time
  • Show
Clear All
new posts

  • ST
    replied
    Re: August 2009 FIRE Economy Depression update – Part I: Snowball in Summer - Eric Janszen

    Originally posted by metalman View Post
    so... where are we all going? surely we can't be the only ones thinking this way.
    to beat a dead horse...Canada - paper assets decline, hard assets increase in value, commodity currency benefits even if devalued somewhat by gov't, still relatively strong, best fiscal shape of the G-7

    but, then I guess I have the benefit of 3 different citizenships between my spouse and I

    still, easy for an American to go north if you have an education - the main problem I find is a general stagnation of thinking in Americans - like they are stuck here no matter what

    I don't consider being in gold and US treasuries safe if you live in the US - you know the dollar devalues - there goes your treasuries, you know chances of a balance of payments crisis increase - then what? currency controls and maybe a 90% tax on gold? you're stuck - how is that protection if the worst case develops which it always seem to with iTulip forecasts?

    you aren't protected at all. You are much more protected if you sit in Canadian t-bills and gold up there and Canadian commodity currency cash

    Leave a comment:


  • goadam1
    replied
    Re: August 2009 FIRE Economy Depression update – Part I: Snowball in Summer - Eric Janszen

    Originally posted by jpatter666 View Post
    I think frog in a pot is exactly the right phrase. People were scared in September-March (when the heat was on high), but they're short memories.

    Recessions have at worst only lasted 18 months or so, as long as [nearly] anyone can remember.

    Deficits? People have been crying about the deficit since Reagan. Nothing ever came of it.

    Jobs, housing? The recession is coming to an end -- don't you read Newsweek?

    People feel that something bad is in the air, but they can't put a finger on it. Things seem OK for the moment -- not as if there are soup lines everywhere. If this is a depression, it's not *that* bad they think (unless you're in Detroit). Several people I talk to have taken some measures, but nothing drastic. If things get much worse, they'll be no more in trouble, so might as well enjoy things while they can.

    We've become a nation of grasshoppers.
    If and when we get our Argentina moment, it will stun the sheeple. How many will say: "I didn't see that coming"

    But in a macro level how could it not be an age of anxiety. Here are some reasons I can come up with:

    More people alive than all of history up until now.

    Mass extinction of chunks of the biosphere.

    An aging western population with some cultures below replacement rate.

    A technological earthquake equivalent to the creation of the printing press or the steam engine displacing nearly all forms of work.

    A society that consumes more than it makes. Mostly forgot how to make stuff. But all the while suffocated with social cues to consume more than it needs.

    A system based on the impossibility of infinite growth.

    Fiat everything you own but your health and hugs.

    Leave a comment:


  • jpatter666
    replied
    Re: August 2009 FIRE Economy Depression update – Part I: Snowball in Summer - Eric Janszen

    Originally posted by goadam1 View Post
    Bingo! I make commercials.

    It's not lost on me that no structural, legal, moral, or any other meaningful change has happened. Stagflation? Triple dip recession? Frog in a pot? I could come up with three or four scenarios. But I live in the now and prepare for a couple of futures. Right now business isn't terrible. Right now I will do a tech upgrade I swore in 2007 I would put on hold until the first storm passed. Right now credit is flowing and stuff is happening.
    I think frog in a pot is exactly the right phrase. People were scared in September-March (when the heat was on high), but they're short memories.

    Recessions have at worst only lasted 18 months or so, as long as [nearly] anyone can remember.

    Deficits? People have been crying about the deficit since Reagan. Nothing ever came of it.

    Jobs, housing? The recession is coming to an end -- don't you read Newsweek?

    People feel that something bad is in the air, but they can't put a finger on it. Things seem OK for the moment -- not as if there are soup lines everywhere. If this is a depression, it's not *that* bad they think (unless you're in Detroit). Several people I talk to have taken some measures, but nothing drastic. If things get much worse, they'll be no more in trouble, so might as well enjoy things while they can.

    We've become a nation of grasshoppers.

    Leave a comment:


  • goadam1
    replied
    Re: August 2009 FIRE Economy Depression update – Part I: Snowball in Summer - Eric Janszen

    Originally posted by metalman View Post
    so... where are we all going? surely we can't be the only ones thinking this way.
    Go around telling people things like: debt is how money is created. the system is set up to make you a debt serf. you are responding to social controls and manipulation when you buy stuff on credit. a financial oligarchy is milking the middle class like a herd of debt cows. credit will not make up for inflation or lack of wage increases. processed food is poison.

    Should I go on.

    Go ahead and see what happens.

    People are asleep.

    Leave a comment:


  • goadam1
    replied
    Re: August 2009 FIRE Economy Depression update – Part I: Snowball in Summer - Eric Janszen

    Originally posted by steveaustin2006 View Post
    I'm guessing you are in the same business as my wife - tv production, but back to the point - I think what you are seeing is the increase in consumer confidence level which I'm guessing spills over to business owners as well. It is a lagging indicator to the stock market so as the stock market rises people feel like things are getting better.

    I've no idea how people can think things are better if they actually look at the data - things have fallen off a cliff here. And now we hear news like the CNW poll stating that 1 in 4 people regret taking advantage of cash for clunkers because they now realize they can't afford the debt on an avg. car of $16k. Voila - the gov't just gave the household sector incentive to take on $11 billion of new debt.

    Frankly, I am so sickened by financial oligarchy, consumer stupidity and gov't largesse that I will likely leave the country within a year or two. So when people take on venture risk and open a business in this climate or go back to spending more when they clearly can't afford to do so for their unsuspecting spouse & kids, I'm tempted to think - same ole stupid.
    Bingo! I make commercials.

    It's not lost on me that no structural, legal, moral, or any other meaningful change has happened. Stagflation? Triple dip recession? Frog in a pot? I could come up with three or four scenarios. But I live in the now and prepare for a couple of futures. Right now business isn't terrible. Right now I will do a tech upgrade I swore in 2007 I would put on hold until the first storm passed. Right now credit is flowing and stuff is happening.

    Leave a comment:


  • metalman
    replied
    Re: August 2009 FIRE Economy Depression update – Part I: Snowball in Summer - Eric Janszen

    Originally posted by steveaustin2006 View Post
    I'm guessing you are in the same business as my wife - tv production, but back to the point - I think what you are seeing is the increase in consumer confidence level which I'm guessing spills over to business owners as well. It is a lagging indicator to the stock market so as the stock market rises people feel like things are getting better.

    I've no idea how people can think things are better if they actually look at the data - things have fallen off a cliff here. And now we hear news like the CNW poll stating that 1 in 4 people regret taking advantage of cash for clunkers because they now realize they can't afford the debt on an avg. car of $16k. Voila - the gov't just gave the household sector incentive to take on $11 billion of new debt.

    Frankly, I am so sickened by financial oligarchy, consumer stupidity and gov't largesse that I will likely leave the country within a year or two. So when people take on venture risk and open a business in this climate or go back to spending more when they clearly can't afford to do so for their unsuspecting spouse & kids, I'm tempted to think - same ole stupid.
    so... where are we all going? surely we can't be the only ones thinking this way.

    Leave a comment:


  • metalman
    replied
    Re: August 2009 FIRE Economy Depression update – Part I: Snowball in Summer - Eric Janszen

    dupe.. itulip hanging...
    Last edited by metalman; August 27, 2009, 06:42 PM. Reason: pls delete

    Leave a comment:


  • metalman
    replied
    Re: August 2009 FIRE Economy Depression update – Part I: Snowball in Summer - Eric Janszen

    Originally posted by Morgasbord View Post
    And yet, my future industry is still keeping it together:
    Woot.
    you are in the perfect industry for our times!

    - maintain sense of self worth by buying an affordable premium product... check
    - socialize with other upper middle class types more cheaply than a country club membership... check
    - engage in socially acceptable self med.. check

    win, win, win!

    substitution rules.

    Leave a comment:


  • ST
    replied
    Re: August 2009 FIRE Economy Depression update – Part I: Snowball in Summer - Eric Janszen

    Originally posted by goadam1 View Post
    Quote:

    But I have taken on extra free-lance lately. I'll ask again: aren't people seeing improving business conditions? I'm busier. I see new stores opening. I was at a packed baseball game and people have money for $10 yankee beer. I won't claim it is self sustaining, but to say that reflation hasn't worked seems silly.
    I'm guessing you are in the same business as my wife - tv production, but back to the point - I think what you are seeing is the increase in consumer confidence level which I'm guessing spills over to business owners as well. It is a lagging indicator to the stock market so as the stock market rises people feel like things are getting better.

    I've no idea how people can think things are better if they actually look at the data - things have fallen off a cliff here. And now we hear news like the CNW poll stating that 1 in 4 people regret taking advantage of cash for clunkers because they now realize they can't afford the debt on an avg. car of $16k. Voila - the gov't just gave the household sector incentive to take on $11 billion of new debt.

    Frankly, I am so sickened by financial oligarchy, consumer stupidity and gov't largesse that I will likely leave the country within a year or two. So when people take on venture risk and open a business in this climate or go back to spending more when they clearly can't afford to do so for their unsuspecting spouse & kids, I'm tempted to think - same ole stupid.

    Leave a comment:


  • Morgasbord
    replied
    Re: August 2009 FIRE Economy Depression update – Part I: Snowball in Summer - Eric Janszen

    Originally posted by metalman View Post
    thank grg55 for this one...
    Brace yourself: Beer prices are going up

    Brewers say rising commodity costs and lower volumes are forcing them to raise its price tags.

    NEW YORK (CNNMoney.com) -- Beer drinkers beware: The cost of a cold one is going up.

    ...
    And yet, my future industry is still keeping it together:
    Boulder, CO • August 17, 2009 – The Brewers Association, the trade association representing the majority of U.S. brewing companies, reports America's small and independent craft brewers¹ are still growing (see Craft Brewing Statistics) despite many challenges and are continuing to provide jobs to the U.S. economy. Dollar growth from craft brewers during the first half of 2009 increased 9%, down from 11% growth during the same period in 2008. Volume of craft brewed beer sold grew 5% for the first six months in 2009, compared to 6.5% growth in the first half of 2008. Barrels sold by craft brewers for the first half of the year is an estimated 4.2 million, compared to 4 million barrels sold in the first half of 2008.
    "At a time when many of the giant beer brands are declining, small and independent craft brewers are organically growing their share and slowly gaining shelf and restaurant menu space one glass of craft beer at a time," said Paul Gatza, Director of the Brewers Association.

    http://www.beertown.org/ba/media_2009/midyear2009.html
    Woot.

    Leave a comment:


  • metalman
    replied
    Re: August 2009 FIRE Economy Depression update – Part I: Snowball in Summer - Eric Janszen

    thank grg55 for this one...
    Brace yourself: Beer prices are going up

    Brewers say rising commodity costs and lower volumes are forcing them to raise its price tags.

    NEW YORK (CNNMoney.com) -- Beer drinkers beware: The cost of a cold one is going up.

    Brewers across the globe are hiking prices to compensate for lower sales volumes and higher commodity costs.

    Anheuser-Busch InBev, the world's largest brewer and maker of Budweiser, announced plans to raise prices Tuesday.

    "We plan on taking price increases on a majority of volume and in a majority of markets this fall," Anheuser-Busch InBev said in a statement. "The increase helps cover some input costs."

    The U.S.-Belgian brewer said prices will go up "across different price tiers," including its high and low-end brands.

    MillerCoors - the maker of popular beers Miller Lite, Coors Lite and Blue Moon -- is also raising prices in some markets...

    ...Heineken, best known for its Heineken and Amstel brands, said Tuesday that its global price increases have helped it turn profits despite sagging volumes...

    Leave a comment:


  • goadam1
    replied
    Re: August 2009 FIRE Economy Depression update – Part I: Snowball in Summer - Eric Janszen

    Quote:
    Your graph seems to suggest that unit labor costs often tend to increase in recessions, and that makes a certain amount of sense. Oftentimes, laid off workers are given severance packages where they are paid for a while after they leave. That presumably pushes the unit production cost higher because businesses are paying salaries for people who don't work for them anymore, pushing up the average per-actual-worker pay. Also, a lot of businesses cut hours instead of laying off workers. But because certain labor costs like health insurance are fixed, the same worker at the same hourly pay will cost more per unit if they work fewer hours, right? But they'll still cost the employer less money overall!
    That's a good point. Maybe that explains why wages are rising.


    As a small business owner, I'll say this is the reason wages are up with high unemployment abounding. It is much cheaper to pay an employee 10% more for being a great multi-tasker than it is to take on a whole person and all the costs that come with an employee.

    But I have taken on extra free-lance lately. I'll ask again: aren't people seeing improving business conditions? I'm busier. I see new stores opening. I was at a packed baseball game and people have money for $10 yankee beer. I won't claim it is self sustaining, but to say that reflation hasn't worked seems silly.

    Leave a comment:


  • FRED
    replied
    Re: August 2009 FIRE Economy Depression update – Part I: Snowball in Summer - Eric Janszen

    Originally posted by rdrees View Post
    Well, I never could quite figure out the multiple quote thing, so my responses are in bold inside your responses. Sorry.
    Fixed it for you.

    I'm not sure it makes sense to include the portion of this recession prior to the economic crisis in late 2008, which is when the deflation began.
    All of the graphs that the Fed's web site spits out show periods of recession in gray. The reason the background of both graphs is entirely gray is that both graphs show only the first six quarters of each period when the economy was in recession.


    Although those quarters certainly qualify as part of the same recession, it was the huge obliteration of dollar wealth from the financial crisis (and the fall in oil prices from their peak) that sparked the deflation that began in July 2008. If you start from there, and you use PPI (which is "EJ's" preferred metric since it's less of a political football) you get:

    7/08: 205.5
    8/08: 199.0
    9/08: 196.9
    Falling prices each month and for the entire Q2 2008 quarter.

    10/08: 186.4
    11/08: 176.8
    12/08: 170.9
    Again-falling prices each month and for the entire Q4 2008 quarter. The end of this quarter is when the Fed really turned on the taps are set rates at 0% and engaged in quantitative easing. What happened?

    01/09: 171.2
    02/09: 169.3
    03/09: 168.1
    Mostly more of the same--aside from a tiny upward blip from December to January, there's month to month and a quarterly fall in prices. Despite 0% fed funds rate the whole Q1 2009 quarter.

    04/09: 168.7
    05/09: 170.2
    06/09: 174.1
    Now we get our first quarter of month to month increases and a quarterly increase to boot. No doubt about that, and that would be different than the Great Depression. However, the total rise in prices over the quarter was only 3%, which is certainly not out of the realm of the "normal" type inflation we've seen most of the rest of the past 20 years. But then we get this:

    07/09: 172.7
    Now the PPI is going back down again! Granted, it's down less than a percent from the last month, but down it goes again. So you've got three straight quarters of consistent month on month deflation, a quarter of modest increases, then a downward path again. Again, I'm not claiming that we're going to see anything like the mother of all deflations -- the Great Depression, but something is clearly happening here, and it's not generally inflation. And don't you think it's remarkable that we would see a fall in the PPI in July 2009 more than seven months after the fed dropped interest rates to zero? And we had something like $300 billion in quantitative easing? That demonstrates pretty clearly to me that there are very, very strong deflationary pressures at work here.
    This entire section follows from the false premise that the recession did not begin in the 4th quarter of 2007. The PPI clearly climbs through the end of 2007 and for the first seven months of 2008, until July. Compare this the The Great Depression when the PPI fell nearly continuously from Jan. 1930 to Dec. 1934, although fo the purposes of comparing the two recessions we only show the first six quarters.

    I've seen the word "deflationista" quite a bit around this website, and I don't know precisely what it means. But I'm probably not exactly what you would define as a deflationista. First, I agree with you that any person who thinks that we could see anything like the price declines that occurred when we were on the gold standard is a fool. The economics are so different as to be almost an irrelevant point of comparison. I also agree that in a fiat currency regime such as ours, there is no theoretical limit to the amount of money the fed can print and that we can always have inflation, eventually, if we want it. We're definitely of the same mind there.
    A point of agreement. No 1930s deflation spiral.

    But just because it's infinitely easier to have inflation these days doesn't mean that deflationary pressures have gone away. From a money demand side, the immense destruction of wealth in late 2008 has created a environment where money is incredibly dearer, and I think it's easy to underestimate how strong that deflationary pressure can be. I don't care if you call it a deflationary spiral or a deflationary event or a deflationary environment or what, but just because we're off the gold standard does not mean that there can't be long-term situations putting serious downward pressure on prices. I see such a situation now.
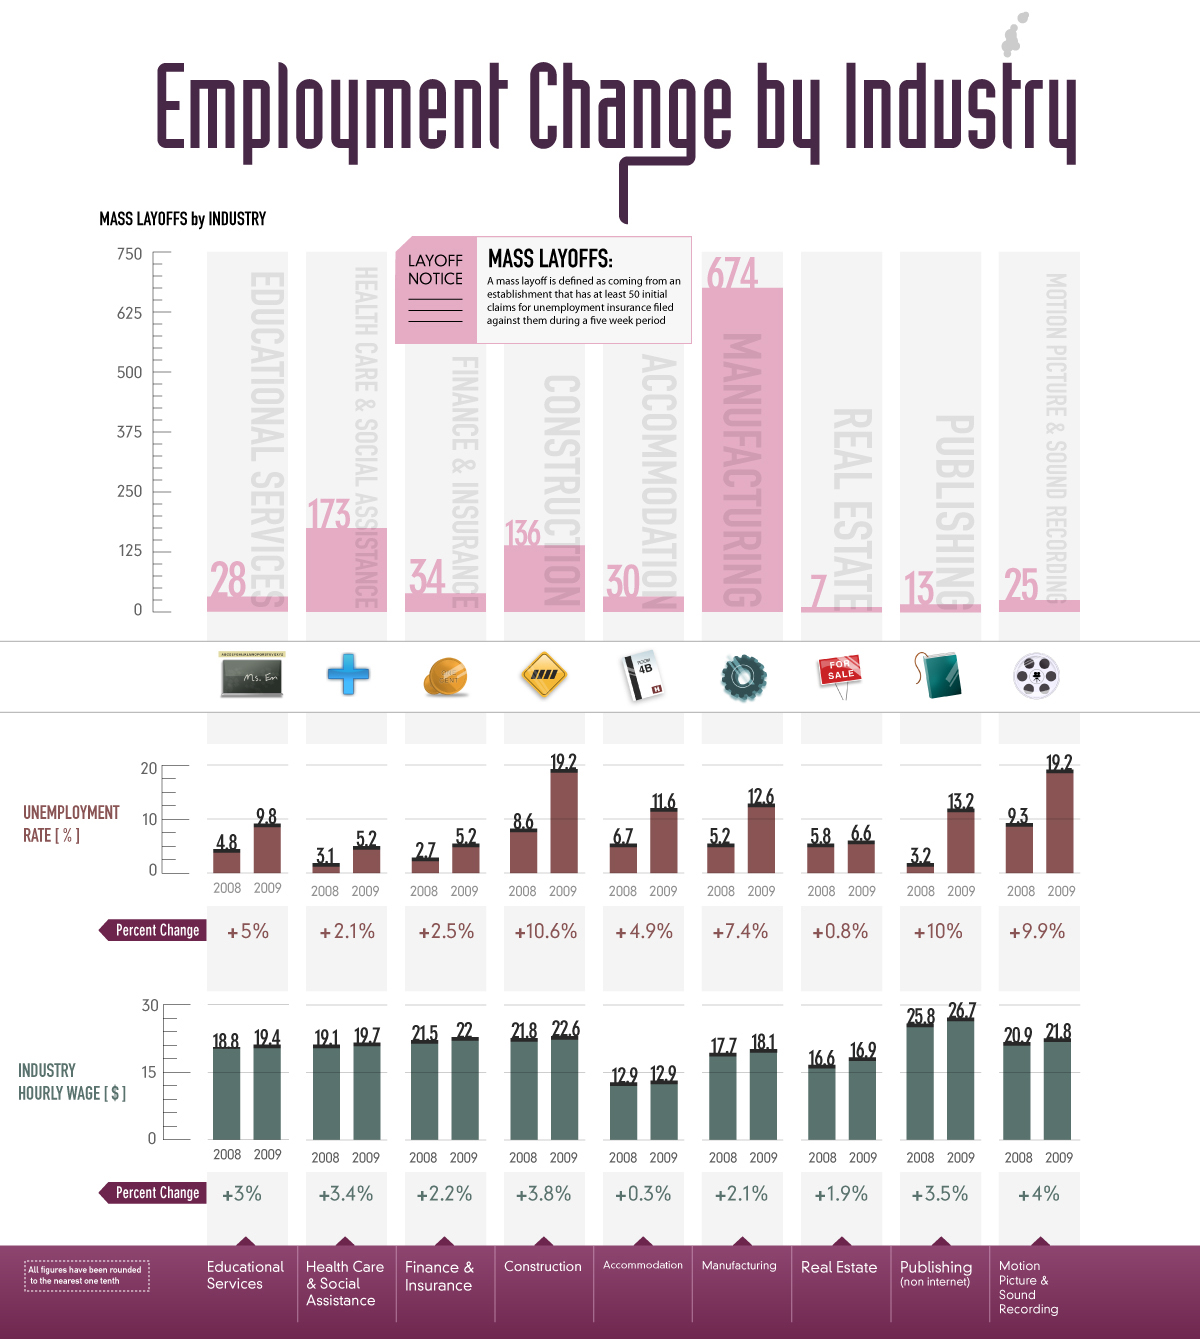
    Think of it this way. Who has pricing power? During the Great Depression, just about no one. Today energy and commodity producers have pricing power. Oddly, and we don't entirely understand why, wage earners have pricing power, even with very high unemployment! It's not supposed to work that way, but this chart is typical of data we are seeing.


    Then there's the money supply-side problem. As I've noted before, newly printed fed money has to go through the banks before it gets out into the wider economy, and if the banks are soaking up a bunch of that money, the fed's efforts are blunted. Consider an analogy: the fed is the fire hydrant hooked up to the city water mains and is essentially an infinite supply of water. The banks are the fire hoses delivering the water to the fire. Ka-Poom theory seems to focus very heavily on the resources of the fire hydrant (the fed), but hasn't paid too much attention to the fire hose (the banks). If the hose is clogged up and leaky, the size of the city water reservoirs becomes a whole heck of a lot less important. I think that's what we're seeing here. Yes, the Fed's balance sheet is balooning, but a decidedly smaller portion of that money is making it out into the economy. In other words, I do not believe that we will see price increases that come close to matching the increase in the Fed balance sheet even when consistent inflation does return.
    This is not how money is created in our hybrid private-public money system. Money is borrowed-lent into existance, the the Fed's balance sheet has little to do with it. As J.K Galbraith said, "The process by which banks create money is so simple that the mind is repelled." $20,000 comes into being when a consumer buys a car, in the process adding $20,000 to his liabilities and a bank adds $20,000 to its assets. From there the money goes round and round the economy. Deflationits don't understand double entry bookkeeping. Their minds are too repelled to get it.

    By buying all the bad debts, the Fed is keeping the banks in business, not adding to the money supply. The banks, since they are functioning are able to participate in the process of money getting borrowed-lent into existence.

    With respect to underestimating the fed's ability to inject inflation into the economy in all sorts of unpredictable ways, you're right. They can do a lot to create inflation. But will they? They've already backed off quantitative easing, cash for clunkers is over, and the mood of the country it seems to me has gone decidedly sour on the levels of our debts. While the fed has the ability to do many things, the political winds may prevent them from actually carrying them out.
    That assumes they are in control. The conceit of all central bankers is that they are, that the terrible inflations of the past were due to bad decisions. Our observation is that inflations happened when the central bank was faced with two unacceptable decisions, either do not print money to meet the current quarter's debt interest payment cash flow requirements, possibly resulting in a Sudden Stop run on the bank or do print and raise inflation fears, resulting in a similar reaction from credit markets.

    But all this brings me to another point of skepticism I have with Ka-Poom. When we do get back to consistent inflation, which I believe we will, why must it be large? The deflationary pressures still hang very heavily around our economy with crashing consumer demand and still all too poor bank balance sheets. When the fed gets us back to inflation, these deflationary pressures should temper high levels of inflation for some time to come. And if you have so much faith in the fed to have the willpower to make inflation come back, why do you lose faith in the ability of the fed to tame it once it's here, especially given that they will have assistance from slumping consumer demand? I think it more likely that we we get consistent inflation back, it will return to the moderate levels we've seen for most of the last 20 years.

    The conculsion of the article os stagflation with a growing risk of a Ka-Poom Sudden Stop.

    I'm not sure if I agree with your assessment of Japan here. I went to the OECD site and pulled up these annual numbers that go back a little further than yours (since Japan's problems really began in 1993, not 1999), and go through the most up to date year they have, 2008. Also, instead of using manufacturing wages, I went with all private sector wages, which gives a much better cross section of the Japanese experience. Here are the numbers:

    Prices; Wages
    1993: 100.1; 99.6
    1994: 100.8; 101.4
    1995: 100.7; 103.2
    1996: 100.8; 104.9
    1997: 102.6; 107.0
    1998: 103.3; 105.6
    1999: 102.9; 104.1
    2000: 102.2; 103.8
    2001: 101.4; 102.9
    2002: 100.5; 99.9
    2003: 100.3; 99.8
    2004: 100.3; 98.9
    2005: 100.0; 100.0
    2006: 100.2; 101.0
    2007: 100.3; 100.1
    2008: 101.7; 99.5

    This data demonstrates that Japanese workers were paid less in 2008 than they were all the way back in 1993, while the prices they are paying are higher. These were not particularly good years for Japan, as prices rose more than 1.5% while wages fell a bit.

    Moreover, the 1999-2006 time frame you originally used tells a very different story when you use the broader, all private sector wage metric: From 1999 to 2006, prices did indeed fall by more than 2%, but wages actually fell over 3%--again, not good years for Japan. Unless, apparently, you happened to work in manufacturing. But in hindsight, the wage increases over that time period for Japanese factory workers was most likely related to the export boom to the U.S. fuelled by cheap credit, and was not sustainable.

    So I'm going to have to disagree with you when it comes to Japan's deflation being "good" for them. I don't think it was--at least it wasn't for most Japanese people. Consider that, over the same time period 1993-2008 when Japanese wages fell slightly, American wages rocketed up almost 40%! So the pain Japan underwent through that same time period relative to us was actually quite astonishing. And by the way, American prices over that longer 1993-2008 time period rose less than 33%, which means American workers not only came out ahead relative to Japan over that time period, but actually came out substantially ahead in absolute terms. America doesn't look too bad after all, eh?

    In any event, I'm still not entirely clear why you think that kind of thing couldn't happen here, whether you call it a deflationary spiral or "stag-deflation." I know you emphasize that Japan had a current account surplus while we have a current account deficit, but I'm not sure that really answers the question. I mean, Japanese public debt skyrocketed over that time period as the Japanese government borrowed and borrowed and borrowed in efforts to stimulate their economy, and it would seem to me that would provide sufficient counterweight to the fact that, more narrowly, they exported more than they imported.
    Because the U.S. will run out of foreign credit long before its domestic public debt reaches close to 195% of GDP.

    I would certainly not dispute that higher energy prices lead to higher prices, and if we have indeed reached peak cheap oil, the whole world will see rising costs for everything. But your prediction is about the United States specifically. That means that you are predicting the dollar to fall RELATIVE to other currencies making us experience MORE cost-push inflation than other countries because of the declining dollar. But that's just not happening at this point. Since 2006, the dollar index has never gone higher than 91 and never lower than 71. Today, we're around 78, which is just a bit lower than the middle of that range, and a point HIGHER than where we were a year ago. In other words, you can't blame energy inflation on a weak dollar at this point in time because the dollar is not particularly weak. What's more, the dollar has soom room to fall and still stay within that range.
    The dollar has depreciated 12% since March 2009. Over that time period prices of commodities and stocks are up between 20% and 50%. The U.S. needs the dollar to fall to halt deflation. The U.S. devauing the dollar against oil much as it did against gold in 1934, and for silmilar reasons.

    Now don't get me wrong: I recognize that the dollar is substantially lower today than in 2001, for example, which means oil is more costly for us relatively than back then. But in the context of the post-2006 more recent dollar climate, we haven't been paying much more for oil than anyone else in the world has.

    The second part of the theory is the one I just don't get -- "A reduction in price competition among producers due to bankruptcies and consolidation." As I've noted before, that is just squarely contradictory to the classical supply-demand graphs we all learned in grade school. Absent a true monopoly, producers have no pricing power in a capitalist economy. Only supply and demand set the price, and when demand is lower, price is lower, all other things being equal. And this second part of the theory just does not jibe with that. Yes, there will be price volatility when excess inventory is burned off after demand drops. But the new equilibrium price will be lower than it was before because less people want the product. Rising energy costs, of course, can make prices higher independent of this phenomenon, but as you acknowledge that's a different phenomenon.
    I recommend a visit to About.com. Iinflation is caused by a combination of four factors:
    1. The supply of money goes up.
    2. The supply of other goods goes down.
    3. Demand for money goes down.
    4. Demand for other goods goes up.

    Let's say that a town has four hardware stores, and three go out of business because of collapsing demand. In other words, there's only enough demand now to support a single store. You seem to be saying that once the dust settles, the single hardware store will start gouging consumers because they've got no competition. But that won't work because a competitor will start up and undercut the price gouging with the price the market can support. And since there's demand for only one store, the price gouging hardward store will go bankrupt because everyone will shop across the street at the new, cheaper hardware store. And if the new one gets cocky when they're the only hardware store left standing and tries itself to gouge, they'll be driven out of business by yet another new start up. So I just cannot understand how Ka-Poom would posit that the "reduction in competition among suppliers" will result in higher prices for consumers.
    Think of it this way. Before the recession. there are four Home Depot stores serving a population of 10,000. After the recession there are two. If demand falls 25% but local supply falls 50%, does the surviving store have pricing power? Might a low end store start up to meet the needs of the population that cannot afford the prices at the remaining store? Maybe, if credit were avaiable to do so, which it is not. That's the point.

    We are not looking at the same graph. Your graph has CPI, which "EJ" says is unreliable and toyed with by our government, and it has PPI, but only for energy. Take a look at my figures up above which show the most simple, broad based, least "fooled with" metric, which is simply PPI for all commodities. Since July 2008, PPI has risen only four times: 12/08-1/09, 3/09-4/09, 4/09-5/09, and 5/09-6/09. Every other month to month figure is a decline--including the most recent figure: 7/08-8/08, 8/08-9/08, 9/08-10/08, 10/08-11/08, 11/08-12/08, 1/09-2/09, 2/09-3/09, and 6/09-7/09. Is that a deflationary spiral? I don't know, maybe, maybe not. But no matter what you call it, it's been a generally deflationary year, with monthly decreases outnumbering monthly increases 2:1.
    You are cherry picking data. Start with the start of each recesion.

    True, for the last four months, increases outnumbered decreases 3:1. But the increases were pretty modest and the last figure is a decrease. So while we may disagree on what we think will happen next, I don't think it's fair to say that the numbers speak for themselves.
    One of us will be right and one of us will be wrong. We will see if the overall trend in PPI remains upward.

    I guess I would agree with you to a certain extent: yes, governments can step in and borrow to create demand in an economy. But can they replace it? I think the Japan example shows pretty strongly that a government can borrow through the teeth and still not be able to fully replace lost consumer demand--their public debt increased mightily while prices stayed mostly stagnant. It would seem to me--and I think you would agree--that consumer demand in America is going to be signficantly down from its peak for some time to come. I seriously doubt that the federal government can more than make up for that lost demand, especially since we're already starting in a pretty signficant hole.
    Government can print money and use the money to finance projects that hire workers and pay them. If ti runs defiicits to finnce this spending, it does not have to tax other sectors of the economy. However, if the deficits get too large, the credit markets begin to raise interest rates, which slows the economy. Then the deficit spending becomes a zero sum game.

    See my above comments. The numbers are not nearly as "clear" as you would suggest, I think, as there are a number of ways to look at them. And if you want to be super-technical about it, it is most accurate to sat that CPI and PPI is currently "falling" as in we are presently experiencing a drop, not a rise.

    One of us will be right and one wil be wrong. You argue a return to a falling PPI. When? How far?

    I'm not sure if I'm following you on this one. At least from the narrow perspective of net creditor vs. net debtor, why does the latter create special risks for inflation? I see how it creates special incentives for inflation, but not necesarily special risks that might result in uncontrollable inflation. And just to be clear, I'm not particularly skeptical on this point, I just don't know if I get it.
    Because a foreign creditor asks questions that are not asked if a nation does not have foreign debt but only domesticl debt, as in the case of Japan. The foreign creditor asks, "If the debtor country runs out of earned income, will it print money to repay me? Might it pay back its domestic creditors before me?"

    Well, the PPI says that producers are paying nearly 20% less for all commodities today than they were last July. Why, then, would they feel compelled to raise their prices if their input costs are so much lower? Yes, they may be higher than a couple years ago, and way higher than 10 years ago. But we're talking about prices that we're paying right now at Target, for example. If Target is charging $5 for a notebook today, why would they suddenly start charging $6--a 20% increase--when they pay 20% LESS for the components than just last year?
    But their input costs are higher, not lower. See charts above.

    See above. I don't think that's technically accurate, and at the very least, the issue is not nearly as simple as you suggest, I think.
    Ok.

    But wait--unit production costs are only half the story, right? Your graph shows that each unit of labor costs about 7% more than it did at the start of the recession. But unemployment is up nearly 100% over the same time period, essentially doubling from 5% to 10%! That's a lot fewer employees to pay, despite their somewhat higher unit costs. So I think my point stands: overall labor costs are down sharply for producers mostly because they are employing far less people.
    See data in the graph above. Wages are rising acoss all industries as unemployment rises.

    Your graph seems to suggest that unit labor costs often tend to increase in recessions, and that makes a certain amount of sense. Oftentimes, laid off workers are given severance packages where they are paid for a while after they leave. That presumably pushes the unit production cost higher because businesses are paying salaries for people who don't work for them anymore, pushing up the average per-actual-worker pay. Also, a lot of businesses cut hours instead of laying off workers. But because certain labor costs like health insurance are fixed, the same worker at the same hourly pay will cost more per unit if they work fewer hours, right? But they'll still cost the employer less money overall!
    That's a good point. Maybe that explains why wages are rising.

    In any case, I think the facts are on my side that labor costs are falling for employers overall, even if per unit cost is rising, given the huge numbers of people being laid off and given fewer hours being worked. This, in combination with slumping consumer demand, suggests that inflationary pressures on producers are not currently imminent, and that the current pressures are deflationary.
    No, the data contradict this assertion.

    I think that oversimplifies the issue. PPI and CPI are lower both month on month and year on year, I think you would have to acknowledge. So this is more of a prediction of trend than fact. And on that prediction, we have some disagreement.
    You lost me. The chart shows both PPI and CPI rising since late 2008.

    Actually, this brings me to a related point. I've seen on this site that Ka-Poom makes a real effort to distinguish asset price inflation from consumer good inflation. True, they are distinct, but aren't they more closely related than that would suggest? I mean, wasn't one of the major criticisms of Greenspan that he failed to acknowledge the close correlation between asset prices and consumer prices by keeping interest rates low in the face of huge stock market and housing bubbles because price inflation was relatively stable? In other words, Greenspan kept interest rates too low for too long because he failed to understand that loose monetary policy was producing an asset bubble.
    There are many article here on that topic. The influence each other in complex ways.

    Well, the same should be true on the way down, right? A huge collapse in asset prices should be just as much an indication of a collapse in money supply as an asset bubble would be an indication of too much money supply.
    The housing bubble came from too much mortgage credit chasing not enough assets. Different money supply, different inflation.
    And the amount of destruction of wealth from the collapse in asset prices over the last several months has been astonishing. To me, that must also be taken into account at least to some extent when determining whether we'll see high consumer prices going forward. Significantly lower asset prices combined with significantly lower producer prices from this same point last year seem to suggest a deflationary environment. Perhaps it can be overcome, but the brakes are on and it should take a lot more engine than normal to get over them.
    Negative weallth effects are a real factor of demand. But the Fed has increased the supply of money relative to demand, creating inflation.

    No, probably not long term significant deflation, and almost certainly nothing like the Great Depression. As I said above, I think the fed will get us back to an inflationary environment. But at the same time, consider that we've had all those policies you mentioned for several months and we still saw prices fall from June 2009 to July 2009. You say there might be something seasonal to that most recent dip, but consider this: between 1999 and 2009, the PPI fell from June to July in only three years, while rising in seven. Over the same time period, PPI fell from July to August in three years, but rose in only six (one year was flat). So whatever seasonal factors might be at play, the data doesn't seem to suggest that they're any different from what should happen next month.

    So while I don't think we'll have lots of deflation for too long, what you've pointed out does not necessarily mean soaring inflation for a long time either. We just might have flat to moderate inflation.
    We don't predict soaring inflation. Read the article again.

    Now that's just not accurate. Consider external debt to GDP, with external debt defined as "the total public and private debt owed to nonresidents repayable in foreign currency, goods, or services."

    http://en.wikipedia.org/wiki/List_of..._external_debt

    We are at 95%. That's much higher than most countries, as we have the 24th highest ratio out of 202 countries. However, Switzerland, the UK, the Netherlands, France, Germany, Denmark, Norway, Finland, and Australia all have higher ratios than us. Some are way higher--France, for example, is at 212%
    We don't owe any money in a foreign currency. That is our blessing. The question is the cash flows relative to foreign debt.

    Agreed and hope it can continue. My work can sometimes take me out of action for a bit, but if you respond, I'll promise to get back to it as soon as I can.
    Ok.

    Leave a comment:


  • rdrees
    replied
    Re: August 2009 FIRE Economy Depression update – Part I: Snowball in Summer - Eric Janszen

    Well, I never could quite figure out the multiple quote thing, so my responses are in bold inside your responses. Sorry.

    Originally posted by FRED View Post
    Actually, no. During the entire 48 month decline in CPI from 1930 to 1934 there was never more than one month when CPI increased month over month and never year over year.


    This time around, CPI and energy have been rising continuously for several quarters.


    I'm not sure it makes sense to include the portion of this recession prior to the economic crisis in late 2008, which is when the deflation began. Although those quarters certainly qualify as part of the same recession, it was the huge obliteration of dollar wealth from the financial crisis (and the fall in oil prices from their peak) that sparked the deflation that began in July 2008. If you start from there, and you use PPI (which is "EJ's" preferred metric since it's less of a political football) you get:

    7/08: 205.5
    8/08: 199.0
    9/08: 196.9
    Falling prices each month and for the entire Q2 2008 quarter.

    10/08: 186.4
    11/08: 176.8
    12/08: 170.9
    Again-falling prices each month and for the entire Q4 2008 quarter. The end of this quarter is when the Fed really turned on the taps are set rates at 0% and engaged in quantitative easing. What happened?

    01/09: 171.2
    02/09: 169.3
    03/09: 168.1
    Mostly more of the same--aside from a tiny upward blip from December to January, there's month to month and a quarterly fall in prices. Despite 0% fed funds rate the whole Q1 2009 quarter.

    04/09: 168.7
    05/09: 170.2
    06/09: 174.1
    Now we get our first quarter of month to month increases and a quarterly increase to boot. No doubt about that, and that would be different than the Great Depression. However, the total rise in prices over the quarter was only 3%, which is certainly not out of the realm of the "normal" type inflation we've seen most of the rest of the past 20 years. But then we get this:

    07/09: 172.7
    Now the PPI is going back down again! Granted, it's down less than a percent from the last month, but down it goes again. So you've got three straight quarters of consistent month on month deflation, a quarter of modest increases, then a downward path again. Again, I'm not claiming that we're going to see anything like the mother of all deflations -- the Great Depression, but something is clearly happening here, and it's not generally inflation. And don't you think it's remarkable that we would see a fall in the PPI in July 2009 more than seven months after the fed dropped interest rates to zero? And we had something like $300 billion in quantitative easing? That demonstrates pretty clearly to me that there are very, very strong deflationary pressures at work here.

    It's case closed on the deflation spiral. Why? Because double entry bookkeeping works better when you don't have to balance entries on one side of the balance sheet with physical gold on the other. The determination to do that in the early 1930s is the reason the U.S. and only the U.S. experienced a deflation spiral. No other country did. See The truth about deflation. Deflationists such as Mike Shedlock don't want to talk about this for fear of alienating the goldbug readership that's attracted to the banker bashing rhetoric. But facts are facts. Sans gold standard, a central bank can, in the famous words of Alan Greenspan in 2003, "Theoretically expand its balance sheet infinitely." We never forgot that line. It turned out to be prophetic.


    Even if prices did begin to fall again, we trust the Fed to expand its balance sheet even more. The principle of buying assets with government money has extended beyond the FIRE Economy. The government is willing to print money and buy cars, and now print money to buy appliances. Why not buy commercial real estate? Houses? Whatever it takes to support prices. Why not? Who a year ago would have imagined "Cash for Clunkers"? Sometimes I think the difficultly with the deflationist mindset is a lack of imagination. Betting against this principle of government using its balance sheet to substitute public for private credit and money has been a losing proposition for over 10 years.

    We have over the years had to address both scenarios, the deflation spiral case and the Japan since 1993 stag-deflation case. The deflation spiral case is closed. Anyone who brings it up again will be directed to various articles here that explain why.
    I've seen the word "deflationista" quite a bit around this website, and I don't know precisely what it means. But I'm probably not exactly what you would define as a deflationista. First, I agree with you that any person who thinks that we could see anything like the price declines that occurred when we were on the gold standard is a fool. The economics are so different as to be almost an irrelevant point of comparison. I also agree that in a fiat currency regime such as ours, there is no theoretical limit to the amount of money the fed can print and that we can always have inflation, eventually, if we want it. We're definitely of the same mind there.

    But just because it's infinitely easier to have inflation these days doesn't mean that deflationary pressures have gone away. From a money demand side, the immense destruction of wealth in late 2008 has created a environment where money is incredibly dearer, and I think it's easy to underestimate how strong that deflationary pressure can be. I don't care if you call it a deflationary spiral or a deflationary event or a deflationary environment or what, but just because we're off the gold standard does not mean that there can't be long-term situations putting serious downward pressure on prices. I see such a situation now.

    Then there's the money supply-side problem. As I've noted before, newly printed fed money has to go through the banks before it gets out into the wider economy, and if the banks are soaking up a bunch of that money, the fed's efforts are blunted. Consider an analogy: the fed is the fire hydrant hooked up to the city water mains and is essentially an infinite supply of water. The banks are the fire hoses delivering the water to the fire. Ka-Poom theory seems to focus very heavily on the resources of the fire hydrant (the fed), but hasn't paid too much attention to the fire hose (the banks). If the hose is clogged up and leaky, the size of the city water reservoirs becomes a whole heck of a lot less important. I think that's what we're seeing here. Yes, the Fed's balance sheet is balooning, but a decidedly smaller portion of that money is making it out into the economy. In other words, I do not believe that we will see price increases that come close to matching the increase in the Fed balance sheet even when consistent inflation does return.

    With respect to underestimating the fed's ability to inject inflation into the economy in all sorts of unpredictable ways, you're right. They can do a lot to create inflation. But will they? They've already backed off quantitative easing, cash for clunkers is over, and the mood of the country it seems to me has gone decidedly sour on the levels of our debts. While the fed has the ability to do many things, the political winds may prevent them from actually carrying them out.

    But all this brings me to another point of skepticism I have with Ka-Poom. When we do get back to consistent inflation, which I believe we will, why must it be large? The deflationary pressures still hang very heavily around our economy with crashing consumer demand and still all too poor bank balance sheets. When the fed gets us back to inflation, these deflationary pressures should temper high levels of inflation for some time to come. And if you have so much faith in the fed to have the willpower to make inflation come back, why do you lose faith in the ability of the fed to tame it once it's here, especially given that they will have assistance from slumping consumer demand? I think it more likely that we we get consistent inflation back, it will return to the moderate levels we've seen for most of the last 20 years.
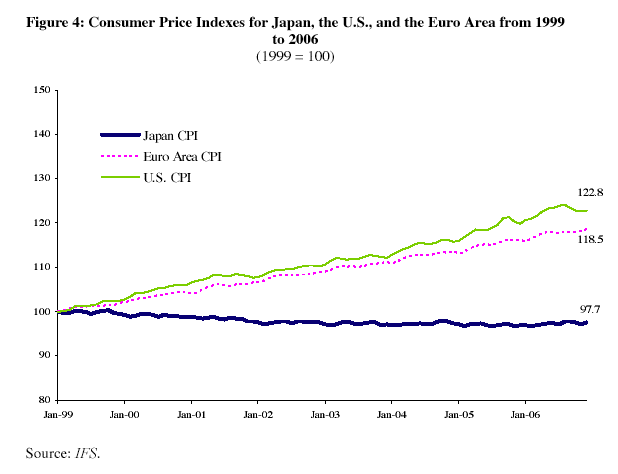
    That still leaves the Japan case. The deflation there is clearly not a self-reinforcing spiral. From 1999 to 2008, the Japan CPI drifted down 2.3%.


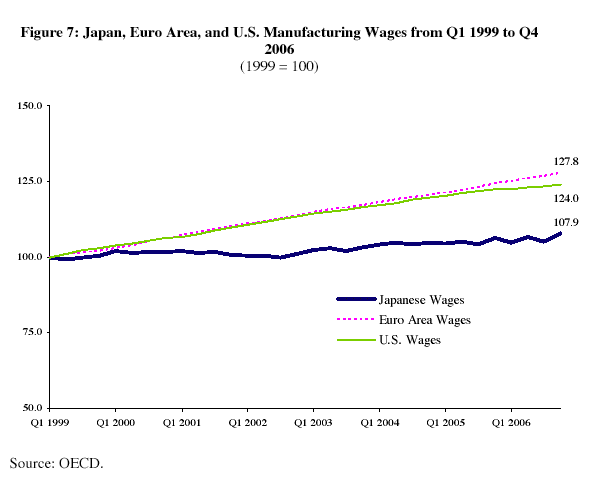
    That kind of deflation is more like the kind the GavKal talks about, the good kind that increases the purchasing power of income. In fact, whie consumer prices 2.3% fell in Japan, wages went up by nearly 8%!


    Now, neoclassical models tell us that's not possible. The whole matter of a generation of brainwashed economists is too big in scope to go into here, but suffice it to say when we see employment in the IT field in Silicon Valley fall 26% from 2001 to 2008 while wages increased 69%, the theory of NAIRU has problems. When we crack open NAIRU we find the thick, gooey, ideological filling: the relationship between prices and wages has been oversimplified for political convenience.

    But I digress. If the U.S. were able to manage a "deflation" as Japan has experienced since 1993, that would not be such a bad thing. For that we'd first need to generate a current account surplus to offset a capital account deficit. Since our economy is structured around a current account deficit and depends on a capital account surplus to finance employment, such restructuring will require a major transformation in labor markets and investment that will take ten years or more. In the mean time, the value of the dollar drifts down and down, as it has since 2001 except for the period of deleveraging when the world ran for dollars to unwind leveraged bets.
    I'm not sure if I agree with your assessment of Japan here. I went to the OECD site and pulled up these annual numbers that go back a little further than yours (since Japan's problems really began in 1993, not 1999), and go through the most up to date year they have, 2008. Also, instead of using manufacturing wages, I went with all private sector wages, which gives a much better cross section of the Japanese experience. Here are the numbers:

    Prices; Wages
    1993: 100.1; 99.6
    1994: 100.8; 101.4
    1995: 100.7; 103.2
    1996: 100.8; 104.9
    1997: 102.6; 107.0
    1998: 103.3; 105.6
    1999: 102.9; 104.1
    2000: 102.2; 103.8
    2001: 101.4; 102.9
    2002: 100.5; 99.9
    2003: 100.3; 99.8
    2004: 100.3; 98.9
    2005: 100.0; 100.0
    2006: 100.2; 101.0
    2007: 100.3; 100.1
    2008: 101.7; 99.5

    This data demonstrates that Japanese workers were paid less in 2008 than they were all the way back in 1993, while the prices they are paying are higher. These were not particularly good years for Japan, as prices rose more than 1.5% while wages fell a bit.

    Moreover, the 1999-2006 time frame you originally used tells a very different story when you use the broader, all private sector wage metric: From 1999 to 2006, prices did indeed fall by more than 2%, but wages actually fell over 3%--again, not good years for Japan. Unless, apparently, you happened to work in manufacturing. But in hindsight, the wage increases over that time period for Japanese factory workers was most likely related to the export boom to the U.S. fuelled by cheap credit, and was not sustainable.

    So I'm going to have to disagree with you when it comes to Japan's deflation being "good" for them. I don't think it was--at least it wasn't for most Japanese people. Consider that, over the same time period 1993-2008 when Japanese wages fell slightly, American wages rocketed up almost 40%! So the pain Japan underwent through that same time period relative to us was actually quite astonishing. And by the way, American prices over that longer 1993-2008 time period rose less than 33%, which means American workers not only came out ahead relative to Japan over that time period, but actually came out substantially ahead in absolute terms. America doesn't look too bad after all, eh?

    In any event, I'm still not entirely clear why you think that kind of thing couldn't happen here, whether you call it a deflationary spiral or "stag-deflation." I know you emphasize that Japan had a current account surplus while we have a current account deficit, but I'm not sure that really answers the question. I mean, Japanese public debt skyrocketed over that time period as the Japanese government borrowed and borrowed and borrowed in efforts to stimulate their economy, and it would seem to me that would provide sufficient counterweight to the fact that, more narrowly, they exported more than they imported.
    You misunderstand the theory. There are two major sources of inflation and many minor ones that lead to our theory that we will experience a rising in inflation no later than Q1 2010. These are detailed in Everyone is wrong, again – 1981 in Reverse Part II: Nine Signs of Inflation. The two major sources are cost push from energy imports and a reduction in price competition among producers due to bankruptcies and consolidation. Rising energy costs are inflationary.

    Disagree. A weak dollar is the primary reason for high energy costs. Monetary and fiscal policy are the primary reasons for dollar weakness. Thus high energy costs are a result of monetary and fiscal policy.
    I would certainly not dispute that higher energy prices lead to higher prices, and if we have indeed reached peak cheap oil, the whole world will see rising costs for everything. But your prediction is about the United States specifically. That means that you are predicting the dollar to fall RELATIVE to other currencies making us experience MORE cost-push inflation than other countries because of the declining dollar. But that's just not happening at this point. Since 2006, the dollar index has never gone higher than 91 and never lower than 71. Today, we're around 78, which is just a bit lower than the middle of that range, and a point HIGHER than where we were a year ago. In other words, you can't blame energy inflation on a weak dollar at this point in time because the dollar is not particularly weak. What's more, the dollar has soom room to fall and still stay within that range.

    Now don't get me wrong: I recognize that the dollar is substantially lower today than in 2001, for example, which means oil is more costly for us relatively than back then. But in the context of the post-2006 more recent dollar climate, we haven't been paying much more for oil than anyone else in the world has.

    The second part of the theory is the one I just don't get -- "A reduction in price competition among producers due to bankruptcies and consolidation." As I've noted before, that is just squarely contradictory to the classical supply-demand graphs we all learned in grade school. Absent a true monopoly, producers have no pricing power in a capitalist economy. Only supply and demand set the price, and when demand is lower, price is lower, all other things being equal. And this second part of the theory just does not jibe with that. Yes, there will be price volatility when excess inventory is burned off after demand drops. But the new equilibrium price will be lower than it was before because less people want the product. Rising energy costs, of course, can make prices higher independent of this phenomenon, but as you acknowledge that's a different phenomenon.

    Let's say that a town has four hardware stores, and three go out of business because of collapsing demand. In other words, there's only enough demand now to support a single store. You seem to be saying that once the dust settles, the single hardware store will start gouging consumers because they've got no competition. But that won't work because a competitor will start up and undercut the price gouging with the price the market can support. And since there's demand for only one store, the price gouging hardward store will go bankrupt because everyone will shop across the street at the new, cheaper hardware store. And if the new one gets cocky when they're the only hardware store left standing and tries itself to gouge, they'll be driven out of business by yet another new start up. So I just cannot understand how Ka-Poom would posit that the "reduction in competition among suppliers" will result in higher prices for consumers.
    Are we both looking at the same graph? Both the PPI and CPI have risen for six months straight until July. The volatility is there, but in the other direction from the one you see. The trend is clearly inflation with an occasional one month dip, not deflation with an occasional one month rise. In fact, we expect the sharp rise in inflation in June was due to seasonal factors. June and July summed average to the trend that started in early 2009.


    If you take the year over year view, you can create a graph that looks like deflation.


    But if you look carefully you can see that PPI and CPI have gone from 45% year over year to -40% year over year over the course of one year. +45% + -40% = +5%, an increase not a decline. Any way you cut it, PPI and CPI are rising.
    We are not looking at the same graph. Your graph has CPI, which "EJ" says is unreliable and toyed with by our government, and it has PPI, but only for energy. Take a look at my figures up above which show the most simple, broad based, least "fooled with" metric, which is simply PPI for all commodities. Since July 2008, PPI has risen only four times: 12/08-1/09, 3/09-4/09, 4/09-5/09, and 5/09-6/09. Every other month to month figure is a decline--including the most recent figure: 7/08-8/08, 8/08-9/08, 9/08-10/08, 10/08-11/08, 11/08-12/08, 1/09-2/09, 2/09-3/09, and 6/09-7/09. Is that a deflationary spiral? I don't know, maybe, maybe not. But no matter what you call it, it's been a generally deflationary year, with monthly decreases outnumbering monthly increases 2:1.

    True, for the last four months, increases outnumbered decreases 3:1. But the increases were pretty modest and the last figure is a decrease. So while we may disagree on what we think will happen next, I don't think it's fair to say that the numbers speak for themselves.
    That is not how money is created to finance cash flows in a modern hybrid fiat and endogenous money system. Money is lent into being by the act of borrowing. If households and businesses aren't doing it, the government will do it for them, and has. This is a philosophical point that deflationists disagree with.
    I guess I would agree with you to a certain extent: yes, governments can step in and borrow to create demand in an economy. But can they replace it? I think the Japan example shows pretty strongly that a government can borrow through the teeth and still not be able to fully replace lost consumer demand--their public debt increased mightily while prices stayed mostly stagnant. It would seem to me--and I think you would agree--that consumer demand in America is going to be signficantly down from its peak for some time to come. I seriously doubt that the federal government can more than make up for that lost demand, especially since we're already starting in a pretty signficant hole.

    The CPI and the PPI are clearly rising as you can see in the charts above.
    See my above comments. The numbers are not nearly as "clear" as you would suggest, I think, as there are a number of ways to look at them. And if you want to be super-technical about it, it is most accurate to sat that CPI and PPI is currently "falling" as in we are presently experiencing a drop, not a rise.

    The U.S. cannot experience deflation ala Japan unless the U.S. can export 20% of the world's capital flows instead of importing 40% of them. Who shall we export to? From what industries? With what workers?

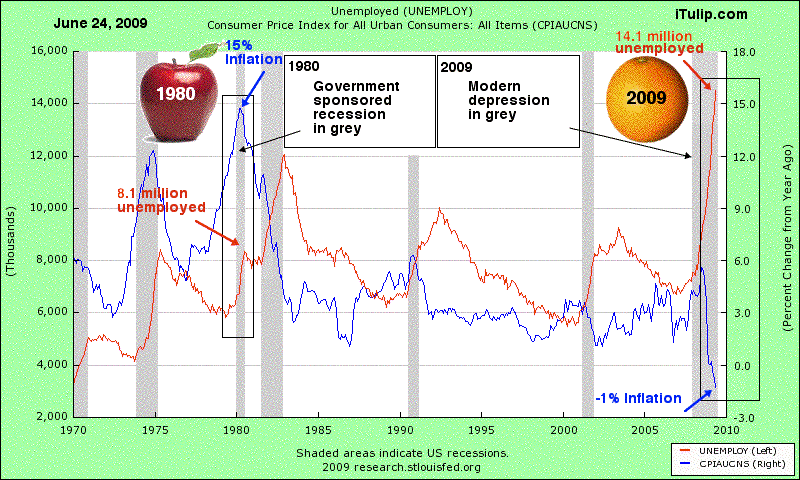
    No doubt this one is different! Here's the chart we show to spell it out.


    This depression was not created on purpose by the Fed off a CPI at 15%. The Fed is busy building a foundation for inflation, not destroying an old one. They think they are stopping a second Great Depression. When the history books are written, it will be noted that the Fed did not understand the unique risk that the U.S. as a net debtor faces in 2009 that it did not face in 1930 when the U.S. was a net creditor and devalued the dollar by 70%. Devaluation by fiscal deficit spending is a dangerous policy.
    I'm not sure if I'm following you on this one. At least from the narrow perspective of net creditor vs. net debtor, why does the latter create special risks for inflation? I see how it creates special incentives for inflation, but not necesarily special risks that might result in uncontrollable inflation. And just to be clear, I'm not particularly skeptical on this point, I just don't know if I get it.
    That's precisely the point: they can't. Where are they going to get oil for less than $70 a barrel? Look at the PPI again.

    But all other things aren't equal. The dollar has been devalued. Oil is $72 not $16 as in 2001.
    Well, the PPI says that producers are paying nearly 20% less for all commodities today than they were last July. Why, then, would they feel compelled to raise their prices if their input costs are so much lower? Yes, they may be higher than a couple years ago, and way higher than 10 years ago. But we're talking about prices that we're paying right now at Target, for example. If Target is charging $5 for a notebook today, why would they suddenly start charging $6--a 20% increase--when they pay 20% LESS for the components than just last year?

    The PPI is rising for all classes of goods.
    See above. I don't think that's technically accurate, and at the very least, the issue is not nearly as simple as you suggest, I think.
    Oh, really? We've been trying to tell you: we're not in Kansas anymore.


    What? Unit labor costs shot up during the FIRE Economy Depression?
    But wait--unit production costs are only half the story, right? Your graph shows that each unit of labor costs about 7% more than it did at the start of the recession. But unemployment is up nearly 100% over the same time period, essentially doubling from 5% to 10%! That's a lot fewer employees to pay, despite their somewhat higher unit costs. So I think my point stands: overall labor costs are down sharply for producers mostly because they are employing far less people.

    Your graph seems to suggest that unit labor costs often tend to increase in recessions, and that makes a certain amount of sense. Oftentimes, laid off workers are given severance packages where they are paid for a while after they leave. That presumably pushes the unit production cost higher because businesses are paying salaries for people who don't work for them anymore, pushing up the average per-actual-worker pay. Also, a lot of businesses cut hours instead of laying off workers. But because certain labor costs like health insurance are fixed, the same worker at the same hourly pay will cost more per unit if they work fewer hours, right? But they'll still cost the employer less money overall!

    In any case, I think the facts are on my side that labor costs are falling for employers overall, even if per unit cost is rising, given the huge numbers of people being laid off and given fewer hours being worked. This, in combination with slumping consumer demand, suggests that inflationary pressures on producers are not currently imminent, and that the current pressures are deflationary.
    No, prices just have to go higher, and they have.

    Again, PPI and CPI are higher, not lower.
    I think that oversimplifies the issue. PPI and CPI are lower both month on month and year on year, I think you would have to acknowledge. So this is more of a prediction of trend than fact. And on that prediction, we have some disagreement.
    The relationship between the money supply and inflation, with time lags, hard to dispute.


    take the extreme case, Argentina. In 2002, virtually no credit. A cash economy. Banking system? Dead. Inflation? Over 20%.
    I'm with you to a point. As I acknowledged before, we're in a very different monetary world than the gold standard of the early 1930s, and I would never dispute that money supply is intimately related to inflation. But as I pointed out before, it's unclear to me that we'll end up seeing as great an increase in money supply as the fed's balance sheet would suggest.

    Actually, this brings me to a related point. I've seen on this site that Ka-Poom makes a real effort to distinguish asset price inflation from consumer good inflation. True, they are distinct, but aren't they more closely related than that would suggest? I mean, wasn't one of the major criticisms of Greenspan that he failed to acknowledge the close correlation between asset prices and consumer prices by keeping interest rates low in the face of huge stock market and housing bubbles because price inflation was relatively stable? In other words, Greenspan kept interest rates too low for too long because he failed to understand that loose monetary policy was producing an asset bubble.

    Well, the same should be true on the way down, right? A huge collapse in asset prices should be just as much an indication of a collapse in money supply as an asset bubble would be an indication of too much money supply. And the amount of destruction of wealth from the collapse in asset prices over the last several months has been astonishing. To me, that must also be taken into account at least to some extent when determining whether we'll see high consumer prices going forward. Significantly lower asset prices combined with significantly lower producer prices from this same point last year seem to suggest a deflationary environment. Perhaps it can be overcome, but the brakes are on and it should take a lot more engine than normal to get over them.

    Yes, but why did the Depression era deflation end? The Fed took the U.S. off the gold standard and devalued the dollar 70%. Why did the 1970s inflation end? The Fed raised short term interest rates to 18%. What will result from QE, massive money growth, zero interst rates, a depreciating dollar and a 12.3% FY2009 fiscal deficit? Not deflation.
    No, probably not long term significant deflation, and almost certainly nothing like the Great Depression. As I said above, I think the fed will get us back to an inflationary environment. But at the same time, consider that we've had all those policies you mentioned for several months and we still saw prices fall from June 2009 to July 2009. You say there might be something seasonal to that most recent dip, but consider this: between 1999 and 2009, the PPI fell from June to July in only three years, while rising in seven. Over the same time period, PPI fell from July to August in three years, but rose in only six (one year was flat). So whatever seasonal factors might be at play, the data doesn't seem to suggest that they're any different from what should happen next month.

    So while I don't think we'll have lots of deflation for too long, what you've pointed out does not necessarily mean soaring inflation for a long time either. We just might have flat to moderate inflation.
    They have no external debt. They owe the money "to themselves." Foreigners not only hold our debt but we have to keep borrowing from them to repay the debt we owe them and also finance the operations of our government.
    Now that's just not accurate. Consider external debt to GDP, with external debt defined as "the total public and private debt owed to nonresidents repayable in foreign currency, goods, or services."

    http://en.wikipedia.org/wiki/List_of..._external_debt

    We are at 95%. That's much higher than most countries, as we have the 24th highest ratio out of 202 countries. However, Switzerland, the UK, the Netherlands, France, Germany, Denmark, Norway, Finland, and Australia all have higher ratios than us. Some are way higher--France, for example, is at 212%

    Good discussion.
    Agreed and hope it can continue. My work can sometimes take me out of action for a bit, but if you respond, I'll promise to get back to it as soon as I can.
    Last edited by FRED; August 26, 2009, 08:39 PM. Reason: Fixed quotes blocks

    Leave a comment:


  • Ghent12
    replied
    Re: August 2009 FIRE Economy Depression update – Part I: Snowball in Summer - Eric Janszen

    Originally posted by metalman View Post
    doubt any of them thought about it any longer than a used car salesman wonders about the last asshhole he sold a car to.
    Bingo. "This unit gets sold today!"

    Leave a comment:

Working...
X