Re: August 2009 FIRE Economy Depression update Part I: Snowball in Summer - Eric Janszen
bart is the man! is there a chart you do not have? :cool:
Announcement
Collapse
No announcement yet.
August 2009 FIRE Economy Depression update Part I: Snowball in Summer - Eric Janszen
Collapse
X
-
Re: August 2009 FIRE Economy Depression update Part I: Snowball in Summer - Eric Janszen
This article is a tour de force.
Leave a comment:
-
Re: August 2009 FIRE Economy Depression update Part I: Snowball in Summer - Eric Janszen
Originally posted by Jim Nickerson View PostUnless I'm misunderstanding something above (always possible), the SPX had a closing low of 676.53 on March 8, 2009, and on 6/17/09 closed at 910.71, a move of 234.18 points equaling a rise of 34.61%. From there to the closing high so far on 8/13/09, the SPX moved a further 102.02 points or 10.07%. From the 3/8/09 low to the 8/13/09 high the move has been 49.69%.
The link below is an interview with Bob Prechter from CNBC today, discussing in part his call I believe on August 5 to exit long positions which it seems he recommended at some point after exiting short positions near the end of February, which was not a bad call.
Starting at about 4 mins on this video he discussed his assessment of the US$ which he "sees" as strengthening perhaps for several years.
I'm not posting this thinking Prechter is/will be/could be correct, but rather to show an example of the the disparate analyses that exist each and every day in the financial commentary about the future. http://www.cnbc.com/id/15840232?play=1&video=1217397249elliot wave is a scam & prechter is a scam artist. give the man his due.... he's good at what he does... separating people from their money.
Inflation Not a Problem, "Deflationary Depression" in Our Future, Prechter Says
Posted Aug 11, 2009 08:30am EDT by Peter Gorenstein in Investing, Commodities, Recession, Banking, Housing
In July, Ben Bernanke told a town hall meeting, "I was not going to be the Federal Reserve chairman who presided over the second Great Depression." According to New York Times columnist Paul Krugman in that regard he's succeeded. Bernanke's rescue of the financial sector in tandem with the Obama Administration's stimulus plan prevented a "full replay" of the Great Depression, the Nobel Prize-winning economist writes.
But like President Bush declaring "Mission Accomplished" in 2003, Elliott Wave International founder, Bob Prechter thinks Krugman and Bernanke are premature in declaring victory over the credit crunch. Prechter, who famously predicted the 1987 stock market crash, tells Tech Ticker "the march towards depression, which is being fueled by deflationary trend, is pretty well intact."
So forget all you've heard about recovery and inflation, "we've only seen the first phase," of the downturn according to Prechter. Next to come, is "a credit implosion" that will once again destroy the value of stocks, commodities and especially real estate. "The biggest area of overvaluation because of credit extension is the real estate area," he says. "And if you'll notice thats the area that's had the weakest of any kind of attempt at a recovery."
If you read the book "At The Crest of the Tidal Wave" by Bob Prechter, written in 1996, he shows clearly and unequivocally that we would soon be entering the 4th of the 9th wave i.e. wave FOUR down of GRAND SUPERCYCLE degree.
The book has scientific backing in the area of geometry known as chaos theory, of which fractal waves(which includes ELLIOTT waves)area sub-set. The Great Crash of 1929-32 was of one degree SMALLER(SUPERCYCLE), and it took the DOW down 89%, from about 380 to 41.
What is scary is that since we are seeing now the GC WAVE FOUR portended in that book, fractal theory says that ultimately,(and that means it can take decades, but also means there will be NO new DOW high until long after this), the DOW drop will not stop until it reaches to the depths of the fourth wave of one-lesser degree. Well, that is EXACTLY the Supercycle wave IV where the DOW dropped to 41 in 1932.Since then, we have been in Supercycle WAVE V of GC WAVE THREE.
So, we are looking at an ultimate target for the DOW of between 41 and 380. THAT IS NO SHIT OR MISPRINT. :eek::eek:
-- profit_of_doom (doom@helltopay.ca), October 16, 1999.


Leave a comment:
-
Re: August 2009 FIRE Economy Depression update Part I: Snowball in Summer - Eric Janszen
Unless I'm misunderstanding something above (always possible), the SPX had a closing low of 676.53 on March 8, 2009, and on 6/17/09 closed at 910.71, a move of 234.18 points equaling a rise of 34.61%. From there to the closing high so far on 8/13/09, the SPX moved a further 102.02 points or 10.07%. From the 3/8/09 low to the 8/13/09 high the move has been 49.69%.Originally posted by EJ View PostSince December 2008 we expected the stock market to bounce in response to fiscal stimulus spending. We missed the second leg down in Q1 2009 then noted the start of a First Bounce on March 27, comparing it to the first bounce in the Nikkei in 1993 also driven by government money.
Never keen to try to catch the very top or bottom in any bubble or government driven market--and perhaps the distinction is precious--on June 17 after the S&P had risen 28% off March panic lows, we said the First Bounce was over. The S&P went up another 6% after that before rolling over.
The link below is an interview with Bob Prechter from CNBC today, discussing in part his call I believe on August 5 to exit long positions which it seems he recommended at some point after exiting short positions near the end of February, which was not a bad call.
Starting at about 4 mins on this video he discussed his assessment of the US$ which he "sees" as strengthening perhaps for several years.
I'm not posting this thinking Prechter is/will be/could be correct, but rather to show an example of the the disparate analyses that exist each and every day in the financial commentary about the future. http://www.cnbc.com/id/15840232?play=1&video=1217397249
Leave a comment:
-
Re: August 2009 FIRE Economy Depression update Part I: Snowball in Summer - Eric Janszen
I actually don't think they're crap, one just needs to both put them in proper perspective (as in mostly ignore U1-5 except for inevitable U3 spin effects from Wall St., back adjust for the doofus birth death model, etc.) and also pay attention to stats like John Williams estimates and my own U7 reconstruction - as well as folk like EJ who have been talking about "jobless recovery" and similar for years.Originally posted by whitetower View PostThanks, Bart, for that graph. I've been thinking for some time that the "unemployment" numbers U1-U6 are just all crap anyway -- "unemployment" has been redefined by the government, what, 3 times in 20 years? I suppose it's being redefined right now as well.
They tell close to the same macro story - things are not in good shape to say the very least. The difference between ~16% U6 and ~20% shadowstats.com numbers and my own ~20% reconstructed U7, while very important for that 4% difference who are unemployed, is not terribly consequential in the grand scheme - they both suck hugely.
Agreed... and unfortunately I don't track working age population. It would certainly present a better & more complete picture, but those charts beat nuttin'.Originally posted by whitetower View PostWhat's important is the total workforce relative to the working-age population. It's a far clearer picture of things to simply ask: "What percentage of people are working?"
Leave a comment:
-
Re: August 2009 FIRE Economy Depression update Part I: Snowball in Summer - Eric Janszen
We are hearing this all over the country. That is not the usual response in a recession.Originally posted by Chief Tomahawk View Post"Competing stores that sell similar items are charging prices that are noticeably higher than a year ago, and far higher than during the fire sale period from Christmas 2008 until the end of Q2 2009."
I can't argue with EJ's firsthand evidence in Boston, but I think that's pre-mature here in Chicago. If anything, I think the stage here is retailers have experienced a decline in sales and thereby revenue and are attempting to counter that by raising prices. I think many know it won't work yet it's all they can do to try to pay the bills, etc.
In the 2001-2002 recession, businesses immediately dropped prices as commodity prices fell like a rock. Businesses are not dropping prices this time because their costs remain too high. The Fed, in its infinite wisdom, has made input costs sticky! Their debt deflation reflation policy has been a complete disaster.

Leave a comment:
-
Re: August 2009 FIRE Economy Depression update Part I: Snowball in Summer - Eric Janszen
"Competing stores that sell similar items are charging prices that are noticeably higher than a year ago, and far higher than during the fire sale period from Christmas 2008 until the end of Q2 2009."
I can't argue with EJ's firsthand evidence in Boston, but I think that's pre-mature here in Chicago. If anything, I think the stage here is retailers have experienced a decline in sales and thereby revenue and are attempting to counter that by raising prices. I think many know it won't work yet it's all they can do to try to pay the bills, etc.
Also, two of the supermarket chains made big announcements about price cuts at the start of this summer. I think it was a rollback of the price increases which came through last summer due to $147 oil.
If anything, we're in the disinflationary stage here in Chicago. And in regards to Cambridge and Harvard, didn't Harvard have a derivative investment of $1 billion blow sky high 6 weeks ago? Perhaps are they trying to squeeze every dime out of whereever their investments reach to save their arse? Maybe that explains why local retailers have raised prices: because their landlord jacked up their rent? Just a thought.
Leave a comment:
-
Re: August 2009 FIRE Economy Depression update Part I: Snowball in Summer - Eric Janszen
"student furnishings"
Sounds like a setting ripe for the return of the Datsun 210 Hatchback. Heaven help us.
Leave a comment:
-
Re: August 2009 FIRE Economy Depression update Part I: Snowball in Summer - Eric Janszen
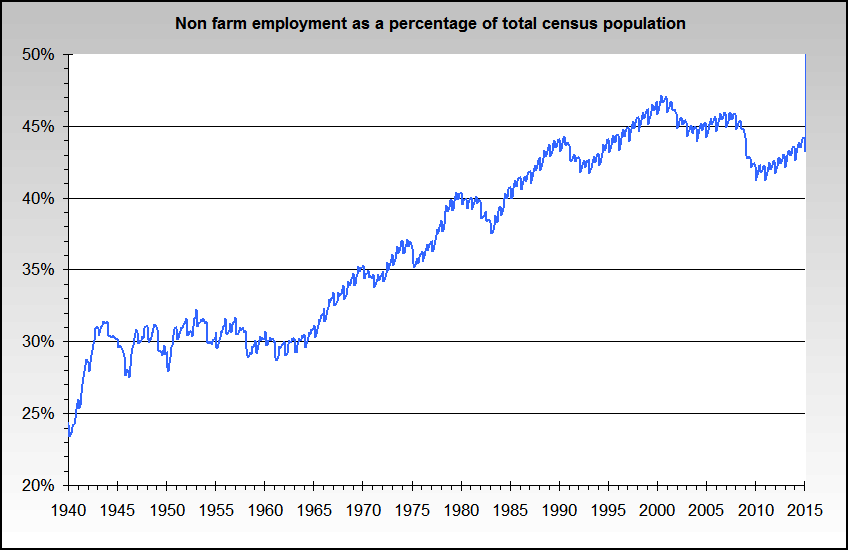
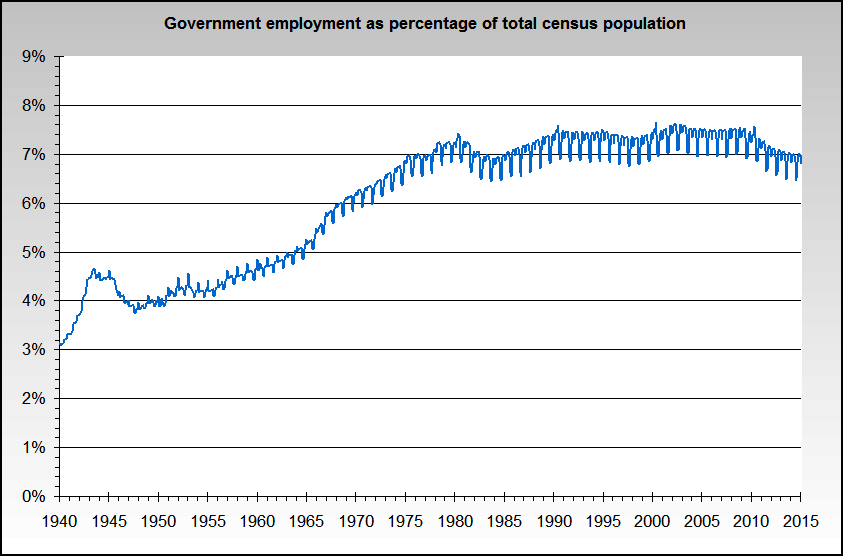
Thanks, Bart, for that graph. I've been thinking for some time that the "unemployment" numbers U1-U6 are just all crap anyway -- "unemployment" has been redefined by the government, what, 3 times in 20 years? I suppose it's being redefined right now as well.
What's important is the total workforce relative to the working-age population. It's a far clearer picture of things to simply ask: "What percentage of people are working?"
Leave a comment:
-
Re: August 2009 FIRE Economy Depression update Part I: Snowball in Summer - Eric Janszen
I already had a chart showing total non farm payroll to total (census) population, so I just cleaned it up a bit and also did one for government employees only.


Leave a comment:
-
Re: August 2009 FIRE Economy Depression update Part I: Snowball in Summer - Eric Janszen
Actually, there is another guy missing from the picture, but as seen here, he is clearly showing the way - the goldman sux down the hill way that is:Originally posted by jk View Postthe only way to improve the picture is to have them pushing the snowball up a mountain, sysiphus style.
(Head Huncho of the Central Bank of Canada)
Leave a comment:
-
Re: August 2009 FIRE Economy Depression update Part I: Snowball in Summer - Eric Janszen
the only way to improve the picture is to have them pushing the snowball up a mountain, sysiphus style.
Leave a comment:
-
Re: August 2009 FIRE Economy Depression update Part I: Snowball in Summer - Eric Janszen
i didn't get the 18% thing either. that said, relative to 1980s & 1950s, the trend is hard to miss.Originally posted by jk View Post2 nits and a big reaction.
nit 1- how can the % of the laborforce unemployed for more than 27 weeks be greater than u6?
nit 2- consumer credit didn't recover after 2001 because j6p used the housing atm via heloc's and refi's- a cheaper and tax-advantaged source of credit.
big reaction- your analysis becomes ever more forceful and incisive, and scary.
do you have the numbers re helocs/refis and total consumer credit? didn't fleck or someone figure out the total dollars of helocs/refis is a tiny portion of total consumer credit?
the analysis is building on a firm foundation... and reaching to a f&cking scary conclusion. :eek:
also, the picture of larry, benny, timmy & bobby is way cool.
Leave a comment:
-
Re: August 2009 FIRE Economy Depression update Part I: Snowball in Summer - Eric Janszen
2 nits and a big reaction.
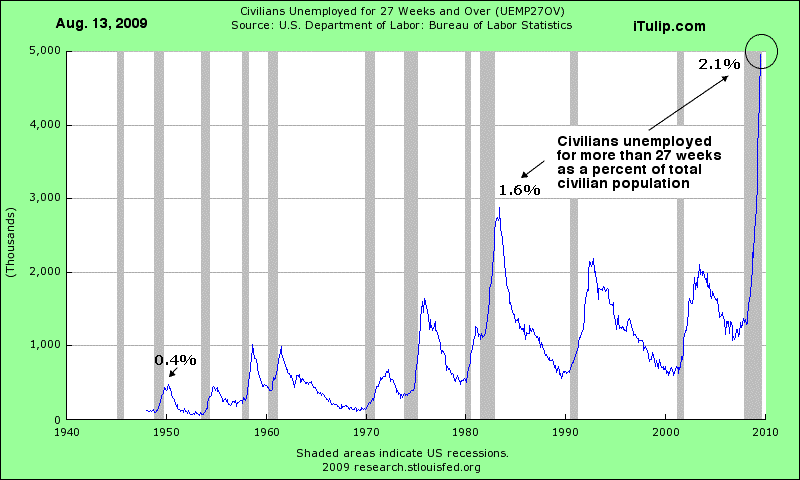
nit 1- how can the % of the laborforce unemployed for more than 27 weeks be greater than u6?
nit 2- consumer credit didn't recover after 2001 because j6p used the housing atm via heloc's and refi's- a cheaper and tax-advantaged source of credit.
big reaction- your analysis becomes ever more forceful and incisive, and scary.
Leave a comment:
-
Re: August 2009 FIRE Economy Depression update Part I: Snowball in Summer - Eric Janszen
Hello EJ,
I think there is a labelling error in the graph and also in the text but I can't put my finger on it. The civilian labor force is currently counted at 154,504,000. 18% of that number is clearly not equal to the ~5 million shown on the graph above. I am unsure what the original intention was behind that graph but something will surely have to change to make it correct.Originally posted by EJ View PostWhy did PCE resume falling? In a word, jobs. The unemployment picture is bad and, again, defying even our most pessimistic projections, continues to worsen.

The number of members of the civilian labor force counted as officially unemployed for more than 27 weeks is over 18% of the total civilian labor force, exceeding the previous peak of 12.3% in 1983. Worse, the rate of growth shows no signs of slowingthe trend is still vertical.
Leave a comment:
Leave a comment: