Announcement

Collapse
No announcement yet.

August 2009 FIRE Economy Depression update – Part I: Snowball in Summer - Eric Janszen

Collapse
X
 
  • Filter
  • Time
  • Show
Clear All
new posts

  • Re: August 2009 FIRE Economy Depression update – Part I: Snowball in Summer - Eric Janszen

    Originally posted by ASH View Post
    jk invests by the "Feynman path integral" method. Money travels by every possible path to reach his pocket, but the superposition of the losses and gains is such that only the path that "minimizes action" results in any appreciable change in net worth.
    exactly!;)

    Comment


    • Re: August 2009 FIRE Economy Depression update – Part I: Snowball in Summer - Eric Janszen

      Originally posted by jk View Post
      i'm a probabilist, and thus think it's foolish to invest on only one scenario.
      I would agree. But inflation and deflation over the next 12 months would require investing in opposing directions. If inflation is coming shortly, long commodities, shorting the dollar, shorting the long end of treasuries is the thing to do. If deflation has another leg down, then you either do the opposite of those things... or simply wait to only catch the upside.

      Comment


      • Re: August 2009 FIRE Economy Depression update – Part I: Snowball in Summer - Eric Janszen

        Originally posted by MarkL View Post
        I would agree. But inflation and deflation over the next 12 months would require investing in opposing directions. If inflation is coming shortly, long commodities, shorting the dollar, shorting the long end of treasuries is the thing to do. If deflation has another leg down, then you either do the opposite of those things... or simply wait to only catch the upside.
        yep, opposite directions but with different assets.

        fwiw, here are my current allocations [approximately, it's been a while since i bothered pricing everything precisely.]
        34% precious metals [8-9% ag, 25% au: in the form of cef, gtu, some gld]
        26% tbills
        25% tbonds [in the form of tlt]
        7% energy [mostly canadian energy trusts, a little dbo]
        -7% shorts [mostly spy, a bit of qqqq and iwm]
        and then some odds and ends like: 2% in gim; 2.5% in miscellaneous longs; 1% in puts on fxi and eem; and so on.

        so you can figure out as well as i how these assets might react under various scenarios.

        Comment


        • Re: August 2009 FIRE Economy Depression update – Part I: Snowball in Summer - Eric Janszen

          Is a house a "durable good" too?

          Comment


          • Re: August 2009 FIRE Economy Depression update – Part I: Snowball in Summer - Eric Janszen

            Originally posted by rdrees View Post
            Quick comment on the final graph here: is there anyway to make both left and right axes have 0 as the midpoint, like in the previous two graphs? It's a little hard to sort out, but it looks like the graphs using the left axis have been flat to negative during the course of the recession, while the graph using the right has been positive the whole time. I'm having trouble seeing the comparison you're suggesting with the axes "off" like that. Also, do the other two graphs use as "nominal interest rate" the 10 year government bond, like the final graph? Or are they using the Fed Funds rate, which would seem like the more obvious metric?
            key point of the fed's charts re usa 1930s & japan early 1990s... real interest rates... the hallmark of reflation success!

            usa 1931... +15%... fail!!!

            japan 1990... +5%... fail!!!

            has the fed pulled off negative real interest rates? all else is bullshit.

            drum roll, pls....

            Comment


            • Re: August 2009 FIRE Economy Depression update – Part I: Snowball in Summer - Eric Janszen

              Originally posted by rdrees View Post
              Could you explain more what you mean by "foreign financing" and how that would not apply to other countries? Are you talking about our current account deficit?
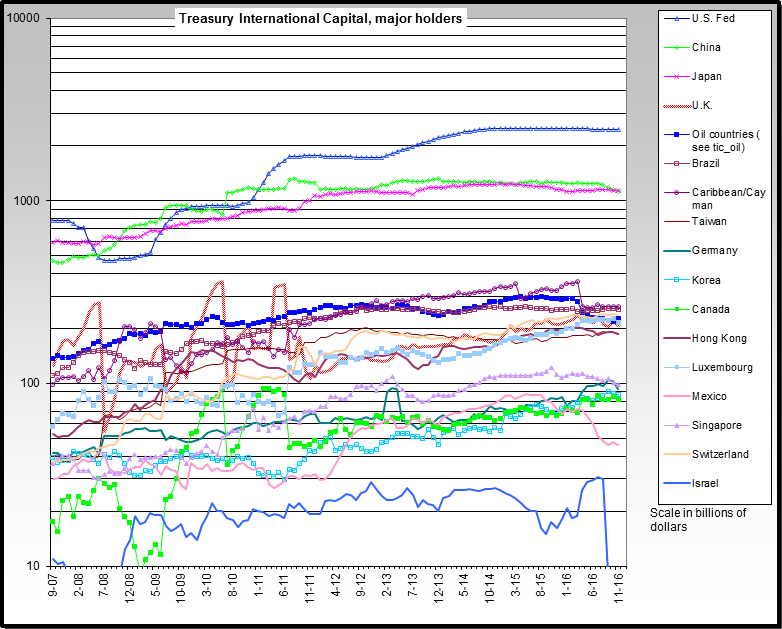
              Yes, the current account deficit or external debt or even Treasury International Capital figures or the BOPI data series from the Fed/BEA. Lots of ways to view the same issue.


              No other country in your list comes close.


              Originally posted by rdrees View Post
              As for whether our deficit numbers are being toyed with, perhaps they are. But I would assume that if our government is playing with numbers, other governments are, too. Washington, D.C. may push a lot of horse puckey and slimy lies, but I don't think they have the monopoly on it compared with other countries' capitols.
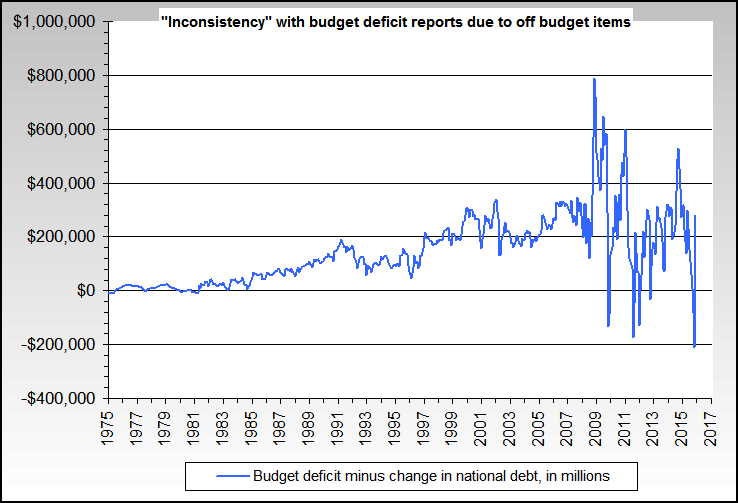
              There's no perhaps about it on budget deficits. Comparing either the White House budget deficit or the budget deficit figures from the Treasury against increases in the national debt shows a heinous growth rate difference roughly since the Reagan administration - especially the current and last administration.


              The monthly budget deficit per the Treasury:


              The differences between the reported deficit and change in the national debt.


              And just because other governments do it doesn't make it even vaguely close to right. I'm not accusing you, but that's also the Nuremberg defense.
              Plus, a number of figures that I have that remain uncharted as yet show that the US is near, if not at, the top of the list.

              "Just say no" applies to financial profligacy, seriously questionable ethical behavior, "bankster" bailouts etc. etc. almost ad nauseum much more than to drug problems. That article/link I posted yesterday - Unconscious Conspiracies - also strongly applies.
              http://www.NowAndTheFuture.com

              Comment


              • Re: August 2009 FIRE Economy Depression update – Part I: Snowball in Summer - Eric Janszen

                Originally posted by metalman View Post
                key point of the fed's charts re usa 1930s & japan early 1990s... real interest rates... the hallmark of reflation success!

                usa 1931... +15%... fail!!!

                japan 1990... +5%... fail!!!

                has the fed pulled off negative real interest rates? all else is bullshit.

                drum roll, pls....


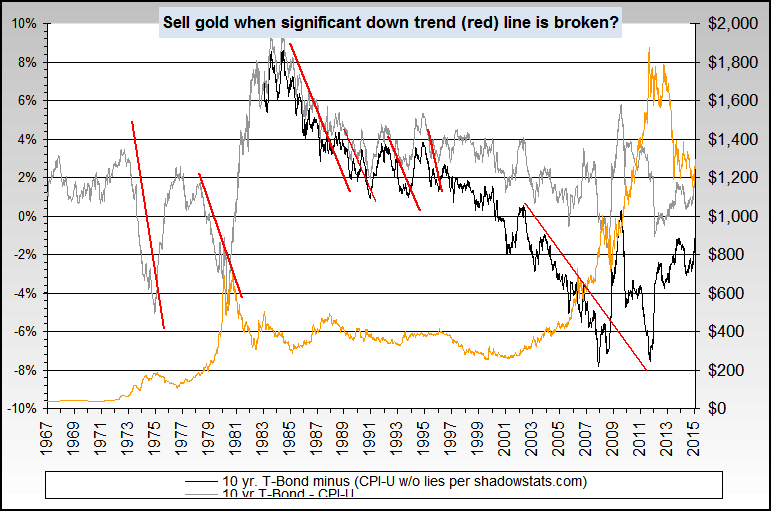
                Another view on negative interest rates, with a bonus of it perhaps being tradeable.


                http://www.NowAndTheFuture.com

                Comment


                • Re: August 2009 FIRE Economy Depression update – Part I: Snowball in Summer - Eric Janszen

                  Originally posted by bart View Post
                  "Just say no" applies to financial profligacy, seriously questionable ethical behavior, "bankster" bailouts etc. etc. almost ad nauseum much more than to drug problems.
                  We have a long way to go, I'm afraid.
                  Most folks are good; a few aren't.

                  Comment


                  • Re: August 2009 FIRE Economy Depression update – Part I: Snowball in Summer - Eric Janszen

                    Originally posted by rdrees View Post
                    I doubt I'll be able to provide you with a statistic that could encompass all of those concerns at once, but among the broadest, perhaps, is external debt to GDP, with external debt defined as "the total public and private debt owed to nonresidents repayable in foreign currency, goods, or services."

                    http://en.wikipedia.org/wiki/List_of..._external_debt

                    We are at 95%. That's much higher than most countries, as we have the 24th highest ratio out of 202 countries. However, Switzerland, the UK, the Netherlands, France, Germany, Denmark, Norway, Finland, and Australia all have higher ratios than us. Some are way higher--France, for example, is at 212%

                    Another metric focuses on total public, i.e. government debt, to GDP.

                    http://en.wikipedia.org/wiki/List_of...by_public_debt

                    We're at 61%, which is 28th highest in the world. Then again, Japan, Norway, Germany, Italy, Canada, and France are all above us. France, for example, is at 64%.

                    So by either metric, a decent number of Westernized economies exceed our debt positions vs. GDP. Yet none of them has had defaults or out of control inflation.

                    You also asked about entitlements--well, I'm not sure how to add that up to compare to other countries, but I would be shocked if our level of entitlements were anything close to Western Europe's.

                    So if France hasn't defaulted and the Euro hasn't tanked, why should we expect those results out of the dollar when it would appear that our debt position is relatively better?

                    Not good, mind you. I don't like our fiscal position at all in the long term. But we should start to see where the breaking point comes in other big Western economies before we see it in ours, it would seem.
                    So the bottom line is, we're bad off, but before we see significant inflation or a currency collapse, these other countries that are worse should see it first. Perhaps Iceland and UK are canaries in the coal mine?

                    I suppose also that similar to the "rush to safety" that in Q1-Q2 of this year pushed the DXY to 80+, if those countries worse than us default or start to see signifcant inflation, we may actually see a repeat of Q1-Q2 and a strengthening of the dollar for a period of time. This could be a deflationary force... for a limited period of time, just like the start of this year.

                    Comment


                    • Re: August 2009 FIRE Economy Depression update – Part I: Snowball in Summer - Eric Janszen

                      Originally posted by MarkL View Post
                      So the bottom line is, we're bad off, but before we see significant inflation or a currency collapse, these other countries that are worse should see it first. Perhaps Iceland and UK are canaries in the coal mine?

                      I suppose also that similar to the "rush to safety" that in Q1-Q2 of this year pushed the DXY to 80+, if those countries worse than us default or start to see signifcant inflation, we may actually see a repeat of Q1-Q2 and a strengthening of the dollar for a period of time. This could be a deflationary force... for a limited period of time, just like the start of this year.
                      iceland would have played out differently if they could have printed the money they owed. uk will be a little more relevant.

                      Comment


                      • Re: August 2009 FIRE Economy Depression update – Part I: Snowball in Summer - Eric Janszen

                        Originally posted by ThePythonicCow View Post
                        We have a long way to go, I'm afraid.
                        I submit that to the understatement of the decade award.
                        http://www.NowAndTheFuture.com

                        Comment


                        • Re: August 2009 FIRE Economy Depression update – Part I: Snowball in Summer - Eric Janszen

                          Originally posted by rdrees View Post
                          You are right, bart. I meant 0.012 OR 1.2%. My mistake.
                          Cool, and thanks.

                          Originally posted by rdrees View Post
                          I don't, however, think it adds much to then turn that to an annualized rate. Yes, PPI is up 1.2% over five months. But it's also down 0.9% from last month. Why not annualize that -.9% number? I'm sure each of us could find some stretch of time that helps our cause, be it year on year and month on month for me, or for a five month period for you.
                          I find it diffcult at best to believe that you're serious about creating conclusions by annualizing one month's data... but at least we can agree that some of this discussion is about valid differences of opinion. I just don't believe that you're looking at all of the facts.

                          Originally posted by rdrees View Post
                          As for John Williams and shadowstats, the graphs on the home page show a precipitous fall in the rate of inflation for all three measures, and deflation for two of them. That seems generally to support what I've been saying, which is that the numbers do not seem to suggest serious inflation from today's prices any time soon.
                          Fair enough... but my real and main point about the shadowstats.com corrections is how much inflation it is showing *now*, and how badly understated CPI-U really is due to all the machinations over the decades.

                          And if you do the exact same 5 month annualized change rate exercise on SGS-CPI, it shows a reversal recently - just like PPI.

                          Of course two of the stats show deflation too - they're the BLS BS numbers.


                          Originally posted by rdrees View Post
                          In any event, I'm generally sticking with PPI because it's readily available, known by all, and has been more or less approved as a decent measuring stick for prices by "EJ," as I noted in a prior post.
                          I note that EJ also uses many other stats, and has also commented on the lies in CPI-U.

                          I also note that there's a truly huge disconnect in growth between the "PPI - all commodities" and both the CRB and CCI commodity indexes, and I personally don't believe it fairly represents reality.


                          Originally posted by rdrees View Post
                          I still think it odd that you deem any dissenting opinion to yours to be "misinformation" and use of any other metric than your preferred metrics misleading or not worthy of consideration. I do sincerely hope that we can raise our level of dialogue and that you will, at some point, come to the realization that someone with a different opinion than yours does not automatically qualify as an enemy.
                          There you go again. Read my lips - "Manners and propriety and straight shooting make a difference to me".
                          Please read my recap in post #138 (especially) as many times as needed to see at least partially what I'm talking about.

                          I have posted chart after chart and cited large amounts of data and facts, and you are still trying to spin/characterize me as an "enemy"... and you are keeping it going with paragraphs like the above or even thinking that my new thread on Unconscious Conspiracies was about you. Look at all the topics in my comments section about "behind the scenes" factors, my various articles and even my tinfoil hat avatar - and please demonstrate some perspective.

                          I don't know who you are, but would guess a high level lawyer or corporate exec, and I completely and totally refuse to believe that you don't know what I'm talking about in the areas of cognitive biases, logical fallacies, and disinformation (not "misinformation" as you stated, in a probable additional attempted spin) games.

                          I will virtually always call it the way I see it and meet what I perceive as spin or disinformation or whatever with the facts as I see them to the best of my ability, and that includes submitting data about various disinformation tricks that can be and are used by many.
                          http://www.NowAndTheFuture.com

                          Comment


                          • Re: August 2009 FIRE Economy Depression update – Part I: Snowball in Summer - Eric Janszen

                            Originally posted by rdrees View Post
                            To me, looking at those PPI figures showing 8 months of year on year price declines seems like we've qualified for at least some definition of deflation, and maybe even a deflationary spiral, though less severe than the one in the 1930s. Remember that even the deflationary spiral of the great depression came to an end.

                            You might find it useful or educational to review the charts in the The Great Depression tight parallels... busted (v 2.0) thread, which show a broad selection of stats comparing the Great Depression to both the period since October 2007 and March 2000.

                            They might provide additional perspective.


                            Originally posted by rdrees View Post
                            That brings me to the next couple graphs regarding PPI and CPI and CPI vs. energy costs. First, I would never dispute the tight relationship between energy and costs, but what I take from your two-part definition of Ka-Poom is that it posits an inflationary force indepedent from energy costs. So while I completely agree that higher energy costs mean higher prices for goods, that's a distinct inflationary phenomenon from fiscal and monetary actions from the federal government, which I understand Ka-Poom to concern.
                            If you look at long term charts comparing U.S. M3 for example to oil prices, the strong correlation is unmistakeable.

                            And yes, I know that correlation does not prove causation... but causation always includes correlation.


                            Originally posted by rdrees View Post
                            Consider also that the Fed's primary means of "printing money" is through the fed funds rate which does not directly enter the economy but instead goes through the intermediary of the banks. If a bank's balance sheet is alright, that money gets spun out into the economy through debt, which leads to inflation if too much money is "printed." I think that's what we saw after the 2001 recession with the housing bubble, etc.
                            Admittedly the Fed Funds rate is significant, but I would hardly call it primary. I submit that OMOs and SOMA growth via monetizing of debt is a larger factor.

                            And then there's this from Bernanke:
                            "Like gold, U.S. dollars have value only to the extent that they are strictly limited in supply. But the U.S. government has a technology, called a printing press (or, today, its electronic equivalent), that allows it to produce as many U.S. dollars as it wishes at essentially no cost. By increasing the number of U.S. dollars in circulation, or even by credibly threatening to do so, the U.S. government can also reduce the value of a dollar in terms of goods and services, which is equivalent to raising the prices in dollars of those goods and services."
                            -- Ben Bernanke, the current (2008) Chairman of the Board of Governors of the Federal Reserve Bank of the United States, in a speech he made on November 21, 2002 before the National Economists Club in Washington, D.C.


                            And this too:
                            "...the Federal Reserve has the capacity to operate in domestic money markets to maintain interest rates at a level consistent with our economic goals”
                            -- Ben Bernanke, Fed Chairman, March 26th 2007 to the Senate Banking Committee.

                            (he's not talking about Fed Funds there)


                            Or perhaps this, about the Fed and how they supposedly can't see or control bubbles (emphasis mine):

                            "When we moved on February 4th, I think our expectation was that we would prick the bubble in the equity markets. What in fact occurred is that, as evidence of the dramatic shift in the economic outlook began to emerge after we moved and long-term rates began to move up, we were also clearly getting a major upward increase in expectations of corporate earnings. While the stock market went down after our actions on February 4th, it has gone down really quite marginally on net over this period. So what has occurred is that while this capital gains bubble in all financial assets had to come down, instead of the decline being concentrated in the stock area, it shifted over into the bond area. But the effects are the same. These are major capital losses, which have required very dramatic changes in the actions and activities on the part of individuals and institutions.

                            So the question is, having very consciously and purposely tried to break the bubble and upset the markets in order to sort of break the cocoon of capital gains speculation, we are now in a position—having done that and in a sense succeeded perhaps more than we had intended—to try to restore some degree of confidence in the System." (emphasis ours)
                            -- Alan Greenspan, Chairman of the Federal Reserve

                            Source: Federal Open Market Committee (FOMC) meeting minutes from March 22, 1994


                            And one last one, about behind the scenes market control (emphasis mine):

                            “Owing to persistent advances in information and computing technologies, the structure of our financial institutions is continuously changing, I trust for the better. But that evolution in financial structure has also meant that supervision and regulation must be continually changing in order to respond adequately to these developments. In today's markets, for example, there is an increased reliance on private counterparty surveillance as the primary means of financial control. Governments supplement private surveillance when they judge that market imperfections could lead to sub-optimal economic performance.
                            Source, Alan Greenspan speech in 2002


                            Originally posted by rdrees View Post
                            But what if, like Japan in the 1990s, the banks' balance sheets are in so much tatters that they effectively hoard the fed's money? It seems to me that it becomes far more likely that you'll see something different--something that looks like deflation or like Japan. Something, perhaps, that looks like what we're seeing today with falling PPI and CPI.

                            Reviewing the charts about Japan that I posted earlier may help your perspective.


                            Originally posted by rdrees View Post
                            As to Bart's graph about the money supply increasing so much since September 2008, I actually find that to be one of the biggest reasons I'm skeptical of looming high inflation. As bart's chart shows, the Fed cranked the presses big time for the last ten months. But it didn't work! You'd think, if the Fed's printing press were as powerful as it has been in past recessions, we'd have an explosion of inflation. Instead, both CPI and PPI are significantly lower today than they were when they turned the presses to overtime.
                            You might want to consider both Milton Friedman's work on monetary lags (12-18 months lag being his average if memory serves), plus velocity issues that I and other have covered elsewhere... as well as what appears to me to be obvious efforts by the Fed and administration to downplay or counter inflationary expectation issues.

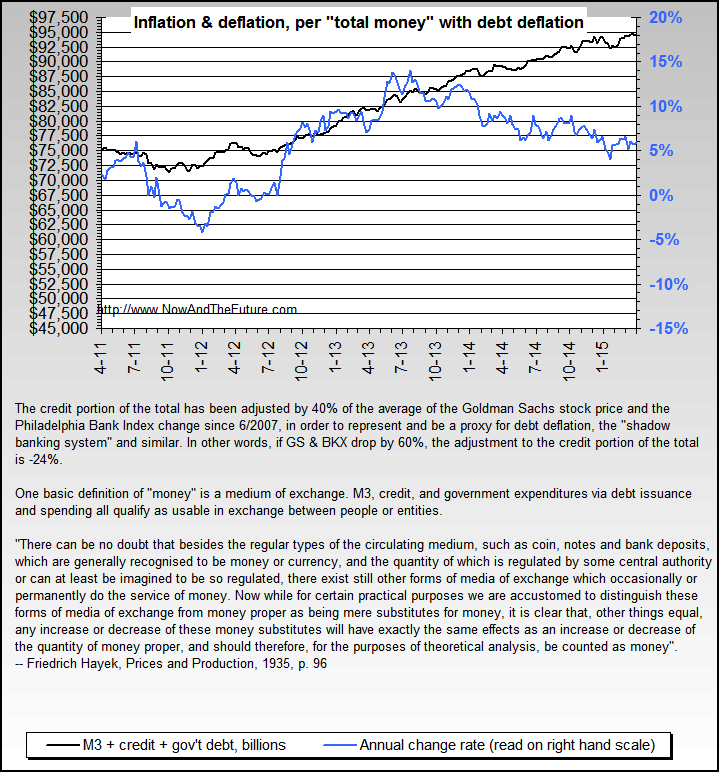
                            And there's also my chart attempts at measuring debt deflation in the total money supply, as well as Finster's fine work with his "FDI" and what they shows about inflation.


                            Originally posted by rdrees View Post
                            As for the fact that we're a debtor nation, I've been thinking about that, and what long-term effect that might have. This post is getting long, so I'll save that for another day, but I will at least point out the following: several Western European nations have higher debt to GDP ratios than we do. And yet, they haven't seen rampant inflation and defaults. Doesn't that suggest that we may have more wiggle room than we think with our debts? Not that I think it's a healthy long-term position to be in, mind you, but it's an interesting comparison, I think.
                            We may indeed have more "wiggle room" -- especially if some real action occurs on dealing with the heinous bailouts & corruption and greed and payoff issues & the ridiculous budget deficits ahead, etc.

                            I also commented via 3 charts showing various credit & debt vs. GDP ratios of the US vs. other countries and areas in a prior post.
                            Last edited by bart; August 22, 2009, 11:52 AM.
                            http://www.NowAndTheFuture.com

                            Comment


                            • Re: August 2009 FIRE Economy Depression update – Part I: Snowball in Summer - Eric Janszen

                              Originally posted by MarkL View Post
                              We pumped it up indeed!

                              But I'm concerned that the CDS/CDR debacle may not be behind us, and as another poster here on iTulip put it (roughly), "we've shoved all of the CDR/CDS 'mail' in the drawer and hummed loudly."

                              At some point the banks of the world will open up that mail.

                              Won't that have a significantly deflationary effect upon the economy, just as the "first wave" of these revelations did last year? Some here on iTulip have said that despite the fact that a lot of these CDS/CDRs are "owed to each other" they should still be considered "money" because they are a medium of exchange, and we've already seen that they can definitely affect the "real" economy. I've seen figures here on iTulip that claim between $60T to $600T are floating around out there! If this is true, the Fed's 2T or the Fed+Gov's 8T looks puny... particularly as the banks won't be able to easily relend while this occurs and achieve the normal 6x-9x velocity of money multiplier affect.

                              Finally, the CDS/CDR ponzi scheme appears to continue to delever at the individual mortgage level. I've read that 25% of all mortages may go into default. This is certainly enough to cause a second wave banking crisis which could potentially cause a return of the deflationary forces that have just alleviated. Oh, and there's the commercial crisis....

                              I do believe that EJ is right and the Fed will ultimately outspend this problem and inflation will go nuts. But perhaps there's another deflationary leg to come first and while the spending done to-date is sufficient to meet the crisis-to-date, it may be insufficient for the magnitude of a potential second wave to come.

                              Thus if we were to revisit the cycle we've just completed, we could see another crash, another deflationary cycle, another bailout, and THEN Crazflation....

                              (Hey... I like that word. "Crazflation." )
                              No deep responses to this, eh? Fred any thoughts? A second wave of deflation seems to be a reasonable argument to me. But most here seem to think inflation asap. But nobody discusses or counters the second wave of deflation theory as a viable possibility....

                              Comment


                              • Re: August 2009 FIRE Economy Depression update – Part I: Snowball in Summer - Eric Janszen

                                Originally posted by MarkL View Post
                                No deep responses to this, eh? Fred any thoughts? A second wave of deflation seems to be a reasonable argument to me. But most here seem to think inflation asap. But nobody discusses or counters the second wave of deflation theory as a viable possibility....
                                if ej's prediction of 500-600 spx comes true, what do you think will trigger it? i.e. i think this question has already been discussed at length.

                                Comment

                                Working...
                                X