 |
The reporting of today's auto unit sale numbers reminds us that most people still don't understand that this is not just a bad recession
The collapse of the FIRE Economy caught most mainstream economics reporters and editors by surprise. Since then the quality of coverage of economic data has improved somewhat. Sure, we still hear "green shoots" sold hard, as if the load of debt that holds the economy back can be wished away, yet we also see more skepticism and less willingness to accept assertions by industry analysts and economists at face value. Reports on economic data still lack historical perspective, but at least most don’t read like press releases anymore, yet readers are still being set up for major disappointment.
Take today’s report by Reuters business reporter David Bailey on today's annual auto sales data issued monthly. Here are excerpts of the Reuters coverage of today's auto sales news with my comments.
June auto sales show stability, led by Ford
Major automakers posted better U.S. auto sales for June than in recent months on Wednesday, led by Ford Motor Co as results pointed to signs of some stabilizing in the hard-hit industry.
So far so good. Saying that the data reveal a slower rate of decline point to signs of some stabilizing is fair. Better than “adding to signs of recovery” or used as an excuse to repeat of that horrid phrase “green shoots.”Major automakers posted better U.S. auto sales for June than in recent months on Wednesday, led by Ford Motor Co as results pointed to signs of some stabilizing in the hard-hit industry.
Ford reported a 10.9 percent drop in U.S. sales in June, near the top of its expectations for a decline of from 10 to 20 percent, and Nissan Motor Co Ltd posted a 23.1 percent drop, in line with analysts' expectations.
I'm confused. Is the 10.9% drop in sales revenue or unit sales? Over what period of time?Retail sales data are always reported in dollars. In inflationary times these are rarely if ever adjusted for either politically inexpedient inflation--which items are classified as "volatile" by economists working for the FIRE Economy--or long term inflation which is buried by statistical maneuvers via the indexes. High gasoline prices in 2008, for example, were regularly reported as increased retail sales. This helped create the "surprise" of the crash that occurred in late 2008. The economy had already been in recession since late 2007, yet few noticed because prices were rising due to energy cost-push inflation. Few reports bothered to mention that the "increase in retail sales" was really a measure of gasoline and heating fuel price inflation not rising sales volume.
In either case, whether revenue or units, the statistic that tells us whether or not a market segment is improving or getting worse is a comparison of sales year over year. For all we know car sales always dip in June from May for seasonal reasons, or maybe they usually rise and this drop is unusually bad. A 10.9% drop in June sales versus May tells us nothing.
In fact, unit sales of autos on a year-over-year basis have been rising for several months as occurs at the beginning of economic recovery periods.
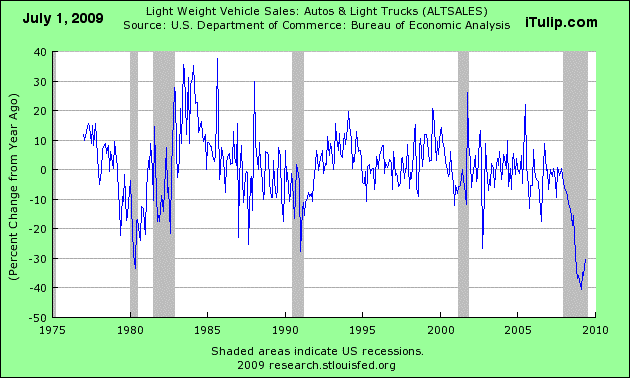
On the surface the data point to recovery--if this FIRE Economy Depression were like any other recession since the end of WWII. But it is not.
Context, context, context
To understand what the new auto sales data mean we first need to understand where we are and how we got here.
Context, context, context
To understand what the new auto sales data mean we first need to understand where we are and how we got here.

The blue line on the chart above shows unit sales of autos and light trucks going back to 1976 and the scale on left hand side of the graph shows unit sales in millions per month. The red line shows real GDP and the scale on the right hand side of the graph shows annual real GDP in billions of dollars.
At 9.1 million units in February 2009, auto unit sales fell during the early stages of the FIRE Economy Depression to within 3% of the all time record low of 8.9 million units since 1976 in December 1981, 28 years ago.
Two important points of comparison between these two economic periods
At 9.1 million units in February 2009, auto unit sales fell during the early stages of the FIRE Economy Depression to within 3% of the all time record low of 8.9 million units since 1976 in December 1981, 28 years ago.
Two important points of comparison between these two economic periods
- The U.S. economy was a $5,292 trillion (real GDP) economy in 1981 compared to a $11,665 trillion economy in 2008. The economy was 55% smaller in real terms. Adjusted for the real change in the size of the economy, unit sales of cars have fallen more than twice as much during the FIRE Economy Depression than during the early 1980s recessions.
- The Federal Reserve created the early 1980s recessions intentionally by raising short term interest rates to over 20% in order to bring down high inflation, then pushing 20%. High borrowing costs led to a fall in demand, business failures, layoffs, and high unemployment. High unemployment cut wage earner’s pricing power, just as today. That shut down a wage-price inflation spiral that had spun out of cost-push inflation from high oil prices years before. Before that, high oil prices had spun out of oil imports due to a weak dollar and an oil supply shock. To stop multiple inflation feedback loops the Fed hit the economy with a sledge hammer. All the little happy loops of inflation process stopped. Crude but effective.
To make a long story short, this time the U.S. economy blew up in late 2008. It did not slow down. It did not fall into recession. The Fed did not create it on purpose to bring down inflation.
A financial system and credit system polluted with excessive risk and debt broke down and the economy started to collapse, a process that continues--driven by inexorable asset price deflation--despite efforts to contain it. The asset price deflation spilled over into the real economy via the credit markets and negative wealth effects.
Auto unit sales data are but one piece of evidence of this obvious fact. Now the question is, Are efforts aimed at stimulating the economy working to end the FIRE Economy Depression, with what unintended consequences, and will the U.S. run out of credit before the economy becomes self-sustaining, free of government subsidies?
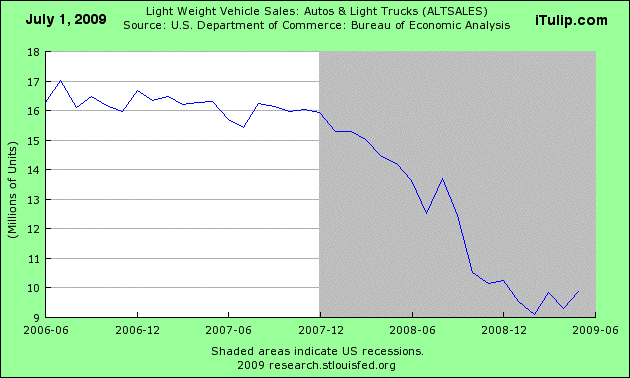
That’s the context. Now let's re-frame the question about today's auto sales data: Will they take off from here along with the economy, or will they rise and fall in response to government stimulus and bounce along at the 9 to 10 million annual level as the depression malingers?
Back to the auto unit sales data report from Reuters.
Back to the auto unit sales data report from Reuters.
Toyota Motor Corp posted a 31.9 percent sales decline in June. The automaker trailed Ford for second place in the U.S. market through the first half of 2009.
Chrysler Group LLC, in its first sales report following its sale to a group led by Italy's Fiat SpA in June, said U.S. June sales fell 42 percent.
Again, does the 42% decline in unit sales represent June 2009 versus May 2009 or June 2009 versus June 2008?Chrysler Group LLC, in its first sales report following its sale to a group led by Italy's Fiat SpA in June, said U.S. June sales fell 42 percent.
Industry analysts and experts expect U.S. auto industry sales to be down less than 30 percent in June, which would be the first time the year-over-year results were even that strong since the financial-market collapse in September.
There we go. They meant year-over-year percent change all along.In the context of the U.S. auto industry, where sales have been slumping for four years, that would constitute good news and support the view that sales are near bottom after a punishing decline to nearly 30-year lows.
An interesting point that most reports failed to make. 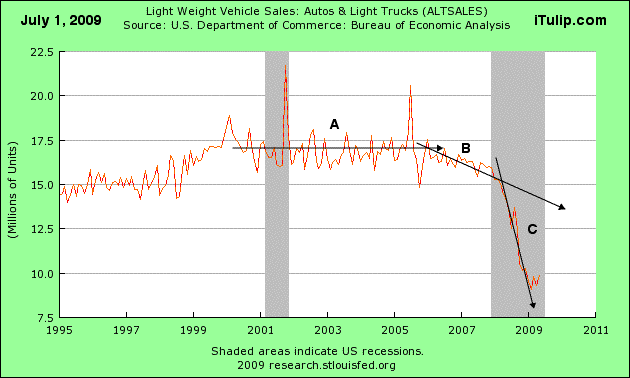
Auto unit sales were flat from 1999 until the housing bubble started to collapse in 2006 (A). Auto sales, partially financed with cash-out refinancing of homes and benefiting from the same loose lending standards that helped inflate the housing bubble, were hit with a series of shocks including a gasoline price shock in 2008, followed by declining real incomes in late 2008, then sharply rising unemployment, then the credit collapse (B). Under the circumstances, it is encouraging that sales did not fall even moe (C).
Economists follow the annualized rate of U.S. auto sales as an early snapshot of the appetite for big-ticket items. A 10 million-unit range would still be among the weakest results since the early 1980s.
We show our apples and oranges economic eras chart again below as we will every time we come across a facile comparison between the FIRE Economy Depression and the early 1980s period.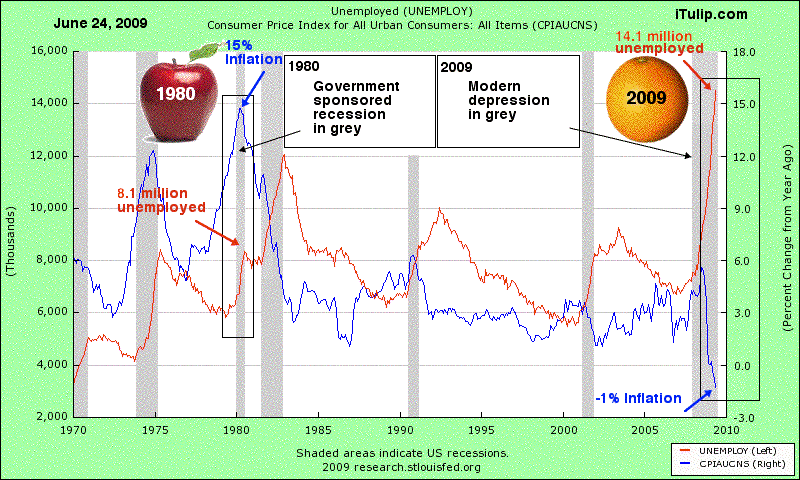
That said, the observation that the appetite for big ticket items is related to auto sales is correct. More generally, there is a strong historical correlation between the sales of autos and the strength of the economy a year later.
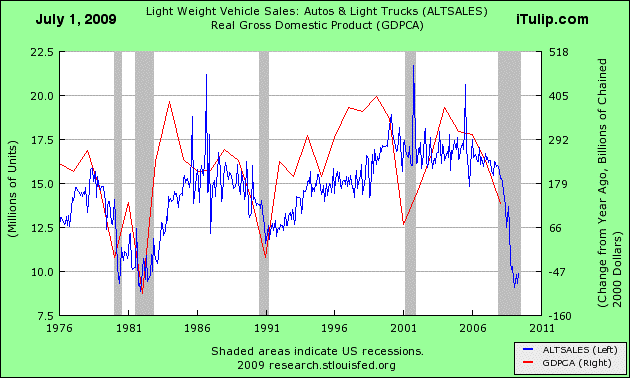
The question is, will the correlation hold again or has the economy fundamentally changed?
I argue in an article in the current month’s Harvard Business Review Selling to the Debt-Averse Consumer that the economy has changed, that the debt overhang of the FIRE Economy will change consumption patterns for a generation. I make a recommendation to consumer products companies about how to address this shift that long time iTulip readers are familiar with.
Incentive dependent consumption
What are auto makers doing by way of incentives to maintain even this awful level of sales volume? Are they able to do so profitably? As we have pointed out before, we cannot have a sustained economic recovery without profits.
Rising incentives that reduce profits result in less investment in future product. That reduces future competitiveness. Less competitiveness means a greater need for more incentives in the future. An auto company caught in this death spiral had better not be counting on a quick economic recovery to pull out of it, and we do not see one coming.
Spring 1930 versus Summer 2009
This period reminds us of the spring of 1930. The following was compiled in 2001 by futurecasts.com from articles published in the New York Times in 1930, re-posted by us with checks and minuses to denote similarities and differences.
Exports falling during the FIRE Economy Depression?

June 2009
Railroad traffic still declining?

June 2009
Speculation driving the stock market?
No two events of this type are alike. The similarities and differences show up in the data. What impresses us most is how unimpressed many appear to be about the seriousness of this depression. They ask why many restaurants are still booked up and why many malls are still busy, even if apparently the shoppers in them are buying less. Where are soup lines? Where is the high crime rate?
We remind them that we are only one year in to a multi-year process.
The average man or woman does not change his or her behavior until years after an economy has changed around them. No one likes change, even positive change but especially negative change. The tendency is to ignore change as long as possible, and hope it goes away and "normalcy" returns. Meanwhile, change goes on.
This depression is transforming the world around us. If you don't think so, I encourage you to take a closer look. On the surface much appears to be the same as, say, two years ago, but under the surface much has changed and is changing--shifting relationships among friends, families, and colleagues. Changes in circumstances affect the range of choices people can make. They make different decisions than before. Different decisions produce different results. Those results impact someone else's decisions. Collections of decisions combine in unexpected ways. One of the most obvious is that consumers buy less as a sustained reduction income and wealth influences purchasing decisions. As they do, after a lag, they will find that they have less to buy because retailers, wholesalers, and manufacturers eventually respond by consolidating or going out of business.
The economy has changed, behavior follows
The Great Depression is taught in American schools as a market crash on a Monday in October 1929 with soup lines forming shortly thereafter. Blurred-over are years of failed trial and error policies by politicians who desperately wanted to undo the damage caused by the preceding decade of credit excess. But as time went on, the damage that started off as abstract data on defaults, output, debt, and incomes began to show up unmistakably in the physiognomy of the economy. The world began to look depressed. That itself will later to have consequences, feeding back into changes in behavior.
To get a street level view of this process, I brought my camera with me on my latest bike ride into Boston from the western suburbs where I live. On the usually pristine Minuteman Bike Trail that I ride on as far as Arlington, not seen on previous trips over the past ten years are now: graffiti, piles of burned trash, groups of teenagers hanging out, and police cars parked on the side of the trail. When their parents are struggling with bills and unemployment, teenage kids tend to take it out on the local neighborhood.
Riding down Newbury Street, Boston’s posh shopping district, I took 15 pictures of retailers that had gone out of business, eight of them side by side. So desirable is the location that even during the 1980s recessions a single vacant Newbury Street shop was a rare sight.
Here they are in a collage, a visualization of the graph from the St. Louis Federal Reserve web site that shows PCE falling at the end of 2007, reflected in conditions on an upscale street of a major U.S. city 18 months later.
I argue in an article in the current month’s Harvard Business Review Selling to the Debt-Averse Consumer that the economy has changed, that the debt overhang of the FIRE Economy will change consumption patterns for a generation. I make a recommendation to consumer products companies about how to address this shift that long time iTulip readers are familiar with.
Incentive dependent consumption
What are auto makers doing by way of incentives to maintain even this awful level of sales volume? Are they able to do so profitably? As we have pointed out before, we cannot have a sustained economic recovery without profits.
RECORD AUTO INCENTIVES
Automakers also have been plying record incentives in the form of cash or special financing to press customer traffic into dealerships, making it more difficult to determine the long-term demand for vehicles.
Edmunds called the month the most expensive June on record, with the average U.S. incentive at $2,930 per vehicle sold, up 20 percent from a year earlier. Edmunds expects incentives to fall as production cuts in recent months pare inventories.
Ford’s profit margin is -12.66% and Operating Margin is -5.49%. Hard to imagine how increasing incentives by 20% will improve on that. Input costs, such as payroll, are not down 20%.Automakers also have been plying record incentives in the form of cash or special financing to press customer traffic into dealerships, making it more difficult to determine the long-term demand for vehicles.
Edmunds called the month the most expensive June on record, with the average U.S. incentive at $2,930 per vehicle sold, up 20 percent from a year earlier. Edmunds expects incentives to fall as production cuts in recent months pare inventories.
"June incentives have never been higher, but we anticipate that the tide is about to turn," Edmunds executive director of industry analysis, Jesse Toprak, said in a statement.
What is the basis of this assertion? None are provided. That's hopeful reporting. The reporter's editor likely insisted on at least one of these throw away hopeful sounding lines from an industry expert. Rising incentives that reduce profits result in less investment in future product. That reduces future competitiveness. Less competitiveness means a greater need for more incentives in the future. An auto company caught in this death spiral had better not be counting on a quick economic recovery to pull out of it, and we do not see one coming.
Spring 1930 versus Summer 2009
This period reminds us of the spring of 1930. The following was compiled in 2001 by futurecasts.com from articles published in the New York Times in 1930, re-posted by us with checks and minuses to denote similarities and differences.
There were great expectations of a quick business revival in the spring of 1930 (green shoots, check). Credit was ample and available at low rates (check). Bank rates had been cut sharply by the Federal Reserve Bank and all the major European national banks (check). Private interest rates had been cut even faster and sharper as people with money found it increasingly difficult to profitably employ it. Not only were business risks rising, the profit inducement to borrow was clearly declining, making the availability of money at sharply declining interest rates increasingly irrelevant (check).
Governments responded to the crisis with substantial tax cuts and public works projects (check).
Auto manufacturers increased steel orders, as auto inventories were at last worked down (check). Railroads, responding to a plea from Pres. Hoover (Obama), accelerated steel rail buying and other planned maintenance and capital projects (today highways fulfill a similar role, check). Many other public utilities and major industries responded similarly (check).
Federal taxes were cut substantially and public works projects were accelerated (check). Steel production rebounded to 69% of capacity and continued climbing towards its usual March-April peak (minus).
The higher wheat prices, a rise in steel production to about 80% of capacity, revived auto production and sales, and the general revival of domestic economic activity, pushed stock market prices higher (minus). April auto production of 467,000 units was better than any April save April, 1929 - but the revival in auto production would probably have been about 40,000 units higher that month but for the collapse of its export market (minus).
Total NYSE stocks reached just under $80 billion by April 10, 1930, making up about 73% of its losses since its September, 19, 1929 highs. The Big Board had surged about $30 billion in five months, a gain of about 65% (minus, still 40% below peak). Its loss from its September, 19, 1929 highs, was just about 12%. Bond prices were running above 1929 levels, and bond financing was now running at 10 times the rate of stock flotation - reversing the tendency in 1929.
The securities markets had staged a nearly complete recovery by any measure, and, despite weak spots, the domestic economy was doing well. But brokers loans were rising sharply, indicating the speculative nature of much of the recovery (check and minus, not a complete recovery but lack of earnings and other factors are evidence that speculation is driving it).
However, the revival was fatally flawed.
In spite of heavy Farm Board purchases, the price index for all commodities had already plummeted to the lowest levels since 1916 (check and minus, did plummet but recovered half way in response to massive global central bank liquidity). The Farm Board now controlled about 1/3rd of the total visible domestic wheat supply (check, the government now controls most of the U.S. auto industry).
Along with the sharp drop in agricultural exports, there was a 46% drop in auto exports for the first quarter of 1930. Exports were a very important factor for the auto industry. They had accounted for about 20% of total sales (minus, the U.S. is a net importer of autos).
Railroad car loadings remained at the lowest levels since 1922 - obviously heavily impacted by the downturns in agriculture and auto exports (check). U.S. foreign trade was now running 23% below 1929 levels - about half consisting in price cuts and half in volume cuts. It was now running below 1928 levels as well (check). First quarter earnings were disappointing, especially when compared with the earnings of the booming first quarter of 1929 (check).
And so on. You get the idea. On to the detailed comparisons.Governments responded to the crisis with substantial tax cuts and public works projects (check).
Auto manufacturers increased steel orders, as auto inventories were at last worked down (check). Railroads, responding to a plea from Pres. Hoover (Obama), accelerated steel rail buying and other planned maintenance and capital projects (today highways fulfill a similar role, check). Many other public utilities and major industries responded similarly (check).
Federal taxes were cut substantially and public works projects were accelerated (check). Steel production rebounded to 69% of capacity and continued climbing towards its usual March-April peak (minus).
The higher wheat prices, a rise in steel production to about 80% of capacity, revived auto production and sales, and the general revival of domestic economic activity, pushed stock market prices higher (minus). April auto production of 467,000 units was better than any April save April, 1929 - but the revival in auto production would probably have been about 40,000 units higher that month but for the collapse of its export market (minus).
Total NYSE stocks reached just under $80 billion by April 10, 1930, making up about 73% of its losses since its September, 19, 1929 highs. The Big Board had surged about $30 billion in five months, a gain of about 65% (minus, still 40% below peak). Its loss from its September, 19, 1929 highs, was just about 12%. Bond prices were running above 1929 levels, and bond financing was now running at 10 times the rate of stock flotation - reversing the tendency in 1929.
The securities markets had staged a nearly complete recovery by any measure, and, despite weak spots, the domestic economy was doing well. But brokers loans were rising sharply, indicating the speculative nature of much of the recovery (check and minus, not a complete recovery but lack of earnings and other factors are evidence that speculation is driving it).
However, the revival was fatally flawed.
In spite of heavy Farm Board purchases, the price index for all commodities had already plummeted to the lowest levels since 1916 (check and minus, did plummet but recovered half way in response to massive global central bank liquidity). The Farm Board now controlled about 1/3rd of the total visible domestic wheat supply (check, the government now controls most of the U.S. auto industry).
Along with the sharp drop in agricultural exports, there was a 46% drop in auto exports for the first quarter of 1930. Exports were a very important factor for the auto industry. They had accounted for about 20% of total sales (minus, the U.S. is a net importer of autos).
Railroad car loadings remained at the lowest levels since 1922 - obviously heavily impacted by the downturns in agriculture and auto exports (check). U.S. foreign trade was now running 23% below 1929 levels - about half consisting in price cuts and half in volume cuts. It was now running below 1928 levels as well (check). First quarter earnings were disappointing, especially when compared with the earnings of the booming first quarter of 1929 (check).
Exports falling during the FIRE Economy Depression?

June 2009
Railroad traffic still declining?

June 2009
Speculation driving the stock market?
No two events of this type are alike. The similarities and differences show up in the data. What impresses us most is how unimpressed many appear to be about the seriousness of this depression. They ask why many restaurants are still booked up and why many malls are still busy, even if apparently the shoppers in them are buying less. Where are soup lines? Where is the high crime rate?
We remind them that we are only one year in to a multi-year process.
The average man or woman does not change his or her behavior until years after an economy has changed around them. No one likes change, even positive change but especially negative change. The tendency is to ignore change as long as possible, and hope it goes away and "normalcy" returns. Meanwhile, change goes on.
This depression is transforming the world around us. If you don't think so, I encourage you to take a closer look. On the surface much appears to be the same as, say, two years ago, but under the surface much has changed and is changing--shifting relationships among friends, families, and colleagues. Changes in circumstances affect the range of choices people can make. They make different decisions than before. Different decisions produce different results. Those results impact someone else's decisions. Collections of decisions combine in unexpected ways. One of the most obvious is that consumers buy less as a sustained reduction income and wealth influences purchasing decisions. As they do, after a lag, they will find that they have less to buy because retailers, wholesalers, and manufacturers eventually respond by consolidating or going out of business.
The economy has changed, behavior follows
The Great Depression is taught in American schools as a market crash on a Monday in October 1929 with soup lines forming shortly thereafter. Blurred-over are years of failed trial and error policies by politicians who desperately wanted to undo the damage caused by the preceding decade of credit excess. But as time went on, the damage that started off as abstract data on defaults, output, debt, and incomes began to show up unmistakably in the physiognomy of the economy. The world began to look depressed. That itself will later to have consequences, feeding back into changes in behavior.
To get a street level view of this process, I brought my camera with me on my latest bike ride into Boston from the western suburbs where I live. On the usually pristine Minuteman Bike Trail that I ride on as far as Arlington, not seen on previous trips over the past ten years are now: graffiti, piles of burned trash, groups of teenagers hanging out, and police cars parked on the side of the trail. When their parents are struggling with bills and unemployment, teenage kids tend to take it out on the local neighborhood.
Riding down Newbury Street, Boston’s posh shopping district, I took 15 pictures of retailers that had gone out of business, eight of them side by side. So desirable is the location that even during the 1980s recessions a single vacant Newbury Street shop was a rare sight.
Here they are in a collage, a visualization of the graph from the St. Louis Federal Reserve web site that shows PCE falling at the end of 2007, reflected in conditions on an upscale street of a major U.S. city 18 months later.
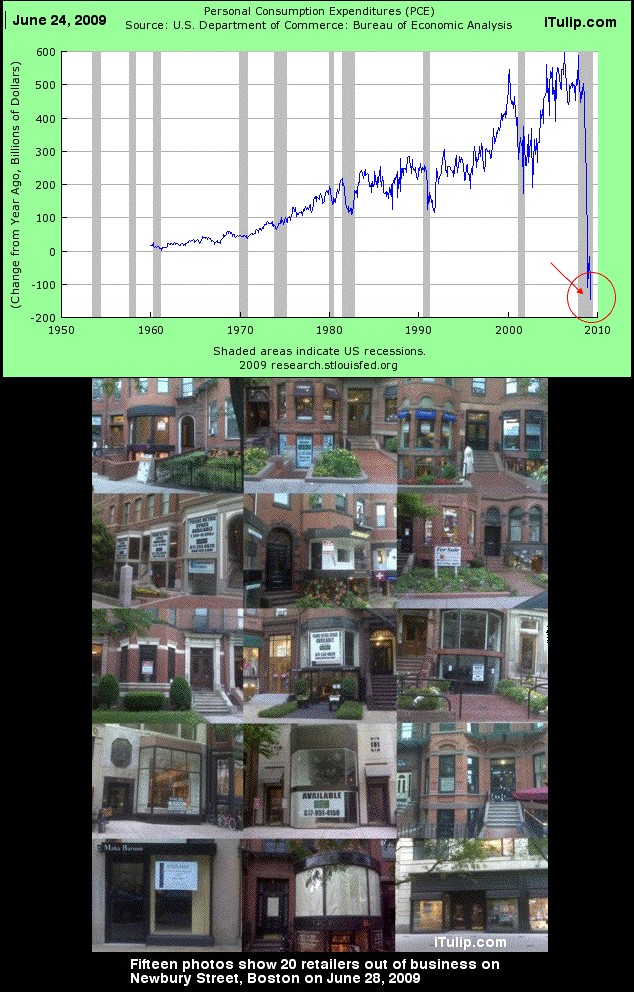
No crowds on a warm Sunday afternoon in June to interfere with the photographer
This picture as a marker, documentation of a lengthy process to help our readers calibrate the rate of the process. Over the next few years we'll go back to keep a photo record of the street. If the FOR SALE and FOR LEASE signs disappear and out-of-business retailers are replaced by new retailers, then we know that some kind of recovery has indeed occurred, even if the composition of retailers there changes.
We shall see if this depression turns out better than the last one.
We shall see if this depression turns out better than the last one.
iTulip Select: The Investment Thesis for the Next Cycle™
__________________________________________________
To receive the iTulip Newsletter or iTulip Alerts, Join our FREE Email Mailing List
Copyright © iTulip, Inc. 1998 - 2007 All Rights Reserved
All information provided "as is" for informational purposes only, not intended for trading purposes or advice. Nothing appearing on this website should be considered a recommendation to buy or to sell any security or related financial instrument. iTulip, Inc. is not liable for any informational errors, incompleteness, or delays, or for any actions taken in reliance on information contained herein. Full Disclaimer


Comment