Announcement

Collapse
No announcement yet.

Does USA 2009 = Argentina 2001? Part I: Falling economy reaches terminal velocity - Eric Janszen

Collapse
X
 
  • Filter
  • Time
  • Show
Clear All
new posts

  • #16
    Re: Does USA 2009 = Argentina 2001? Part I: Falling economy reaches terminal velocity - Eric Janszen

    Originally posted by FRED View Post
    All well and fine to assert one is right and the other is wrong, but what evidence do you have to help us decide?
    Go to the source central bank sites, download the broad money stats, convert them to dollars using then current exchange rates and do a chart. Do a similar exercise with all the stock indexes.

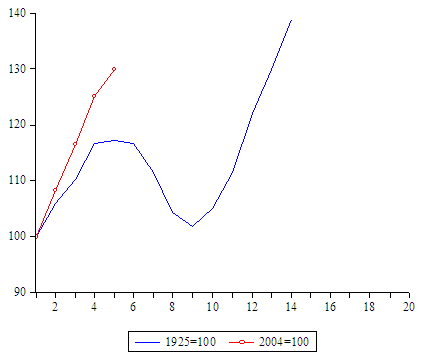
    The primary issue though is one of timing or start dates. They started their money stats in 1925 & 2004. The Great Depression started in 3Q 1929 (or later - see Romer for start dates in different countries), which is at least 4.75 years after 1925. Adding that to 2004 gets us to a start of 3Q 2008, which is almost a full year after the markets peaked.

    The original article from which the misleading charts came was entitled "A Tale of Two Depressions", and one should expect that the charts would start when the Great Depression started or close to it - not 9-12 months off. Arbitrarily starting them when industrial production peaks is misleading at best, even excluding how much of global GDP is service based.

    The same issue applies to stocks, although the date difference is smaller at 3-9 months.
    Additionally, their stock chart doesn't name the current day world stock index that they're using... and I'm unaware of any major one or even an average that shows performance as bad as their current day chart shows.
    Last edited by bart; June 27, 2009, 12:03 AM.
    http://www.NowAndTheFuture.com

    Comment


    • #17
      Re: Does USA 2009 = Argentina 2001? Part I: Falling economy reaches terminal velocity - Eric Janszen

      Here's what Eicengreen and O'Rourke stated with regard to the presentation of the data in their graphs.

      Comparing the Great Depression to now for the world, not just the US

      • This and most other commentary contrasting the two episodes compares America then and now. This, however, is a misleading picture. The Great Depression was a global phenomenon. Even if it originated, in some sense, in the US, it was transmitted internationally by trade flows, capital flows and commodity prices. That said, different countries were affected differently. The US is not representative of their experiences.
      • Our Great Recession is every bit as global, earlier hopes for decoupling in Asia and Europe notwithstanding. Increasingly there is awareness that events have taken an even uglier turn outside the US, with even larger falls in manufacturing production, exports and equity prices.
      • In fact, when we look globally, as in Figure 1, the decline in industrial production in the last nine months has been at least as severe as in the nine months following the 1929 peak. (All graphs in this column track behaviour after the peaks in world industrial production, which occurred in June 1929 and April 2008.) Here, then, is a first illustration of how the global picture provides a very different and, indeed, more disturbing perspective than the US case considered by Krugman, which as noted earlier shows a smaller decline in manufacturing production now than then.
      http://www.voxeu.org/index.php?q=node/3421
      Jim 69 y/o

      "...Texans...the lowest form of white man there is." Robert Duvall, as Al Sieber, in "Geronimo." (see "Location" for examples.)

      Dedicated to the idea that all people deserve a chance for a healthy productive life. B&M Gates Fdn.

      Good judgement comes from experience; experience comes from bad judgement. Unknown.

      Comment


      • #18
        Re: Does USA 2009 = Argentina 2001? Part I: Falling economy reaches terminal velocity - Eric Janszen

        Originally posted by Jim Nickerson View Post
        Here's what Eicengreen and O'Rourke stated with regard to the presentation of the data in their graphs.

        Comparing the Great Depression to now for the world, not just the US

        • This and most other commentary contrasting the two episodes compares America then and now. This, however, is a misleading picture. The Great Depression was a global phenomenon. Even if it originated, in some sense, in the US, it was transmitted internationally by trade flows, capital flows and commodity prices. That said, different countries were affected differently. The US is not representative of their experiences.

        • Our Great Recession is every bit as global, earlier hopes for decoupling in Asia and Europe notwithstanding. Increasingly there is awareness that events have taken an even uglier turn outside the US, with even larger falls in manufacturing production, exports and equity prices.

        • In fact, when we look globally, as in Figure 1, the decline in industrial production in the last nine months has been at least as severe as in the nine months following the 1929 peak. (All graphs in this column track behaviour after the peaks in world industrial production, which occurred in June 1929 and April 2008.) Here, then, is a first illustration of how the global picture provides a very different and, indeed, more disturbing perspective than the US case considered by Krugman, which as noted earlier shows a smaller decline in manufacturing production now than then.

        http://www.voxeu.org/index.php?q=node/3421


        And I did note that above as well as touched on it in The Great Depression parallels... busted thread:
        Originally posted by bart
        The original article from which the misleading charts came was entitled "A Tale of Two Depressions", and one should expect that the charts would start when the Great Depression started or close to it - not 9-12 months off. Arbitrarily starting them when industrial production peaks is misleading at best, even excluding how much of global GDP is service based.
        ...

        Originally posted by bart
        Here are the starting quarter dates of the Great Depression in various countries (source: Romer) sorted by start dates and as you can see, they're mostly nowhere around the June 1929 date at which that stock chart starts.


        Germany 1928,1
        Brazil 1928,3
        Poland 1929,1
        Canada 1929,2
        Argentina 1929,2
        United States 1929,3
        Italy 1929,3
        Belgium 1929,3
        Switzerland 1929,4
        Czechoslovakia 1929,4
        Netherlands 1929,4
        India 1929,4
        Great Britain 1930,1
        Japan 1930,1
        South Africa 1930,1
        France 1930,2
        Sweden 1930,2
        Denmark 1930,4
        Not only that, but using April 2008 is even further after the current stock market peak and current official recession start date (and in the other direction) that June 1929 is ahead of the actual start of the Great Depression.


        It still seems quite misleading to me, and significantly skews all the charts.

        How many have read that article and all the references and links to it on other sites, and don't realize that most of the charts are not aligned with either the start of the Great Depression or the current recession?
        Last edited by bart; June 27, 2009, 12:14 AM.
        http://www.NowAndTheFuture.com

        Comment


        • #19
          Re: Does USA 2009 = Argentina 2001? Part I: Falling economy reaches terminal velocity - Eric Janszen

          Originally posted by bart View Post
          And I did note that above as well as touched on it in The Great Depression parallels... busted thread:


          ...


          Not only that, but using April 2008 is even further after the current stock market peak and current official recession start date (and in the other direction) that June 1929 is ahead of the actual start of the Great Depression.


          It still seems quite misleading to me, and significantly skews all the charts.

          How many have read that article and all the references and links to it on other sites, and don't realize that most of the charts are not aligned with either the start of the Great Depression or the current recession?
          It struck me that the Eichengreen and O'Rourke's point was to present their opinion of 1929 vs. recently based as they wrote, and as was quoted above, on "peaks in the world industrial production." I assume their data are correct, and that their graphs correctly reflect correct data.

          Whether or that presentation agrees with the reality of 1929 vs. now as you perceive it, Bart, or as you think it is best displayed is not an argument that I believe will be sorted out on these pages. They wrote what they wrote on the basis of their qualifications in presenting the graphs. Unless you can disprove the correctness of their data, the reasonable thing appears to be to take their study for what it shows as a valid comparison.
          Jim 69 y/o

          "...Texans...the lowest form of white man there is." Robert Duvall, as Al Sieber, in "Geronimo." (see "Location" for examples.)

          Dedicated to the idea that all people deserve a chance for a healthy productive life. B&M Gates Fdn.

          Good judgement comes from experience; experience comes from bad judgement. Unknown.

          Comment


          • #20
            Re: Does USA 2009 = Argentina 2001? Part I: Falling economy reaches terminal velocity - Eric Janszen

            Originally posted by Jim Nickerson View Post
            It struck me that the Eichengreen and O'Rourke's point was to present their opinion of 1929 vs. recently based as they wrote, and as was quoted above, on "peaks in the world industrial production." I assume their data are correct, and that their graphs correctly reflect correct data.

            Whether or that presentation agrees with the reality of 1929 vs. now as you perceive it, Bart, or as you think it is best displayed is not an argument that I believe will be sorted out on these pages. They wrote what they wrote on the basis of their qualifications in presenting the graphs. Unless you can disprove the correctness of their data, the reasonable thing appears to be to take their study for what it shows as a valid comparison.
            agree with your point, jim. am not convinced that eichengreen's and o'rourke's representations of the data are not valid.

            Comment


            • #21
              Re: Does USA 2009 = Argentina 2001? Part I: Falling economy reaches terminal velocity - Eric Janszen

              Fair enough Jim. I believe that the facts clearly speak for themselves.

              Making comparisons and conclusions about the Great Depression while not using the accepted start date, and also not using the current recession start date strikes me as less than wise.

              Per my experience, the majority of regular folk who have looked at those charts whether here or at other sites don't even realize that the original writers are going way out there with basing the charts on industrial production peaks, and are drawing incorrect and potentially very costly conclusions.
              http://www.NowAndTheFuture.com

              Comment


              • #22
                Re: Does USA 2009 = Argentina 2001? Part I: Falling economy reaches terminal velocity - Eric Janszen

                Originally posted by metalman View Post
                agree with your point, jim. am not convinced that eichengreen's and o'rourke's representations of the data are not valid.

                Fair enough - that's three of you.

                I won't bother to spend 4 hours on two charts next time to bring up a point here that my emails have shown that most don't understand and didn't get.
                I'm not upset, just disappointed.
                Last edited by bart; June 27, 2009, 12:57 AM.
                http://www.NowAndTheFuture.com

                Comment


                • #23
                  Re: Does USA 2009 = Argentina 2001? Part I: Falling economy reaches terminal velocity - Eric Janszen

                  Originally posted by bart View Post
                  Fair enough - that's three of you.

                  I won't bother to spend 4 hours on two charts next time to bring up a point here that my emails have shown that most don't understand and didn't get.
                  I'm not upset, just disappointed.
                  i, for one, found your charts and - even more so - the discussion here quite illuminating. you can't say Eichengreen and O'Rourke's charts were wrong, although you can - and did! - argue that they are misleading, and highlight that element of their construction that produced what you feel are misleading results.

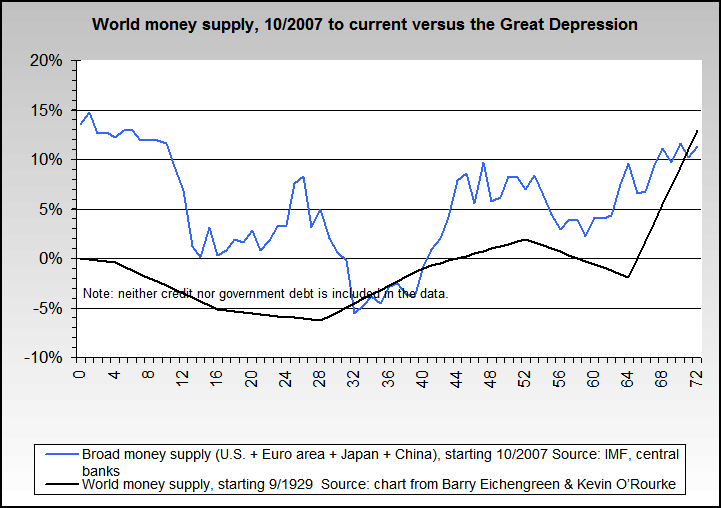
                  more data is better. i would also point out that the money supply charts are of different forms- yours a rate of change chart, theirs a chart of money supply size itself. you'd need to take the first derivative of their chart, then align the start dates to see if there's any difference at all. if so, that would mean that someone has wrong, or at least wrongly labeled data.

                  Comment


                  • #24
                    Re: Does USA 2009 = Argentina 2001? Part I: Falling economy reaches terminal velocity - Eric Janszen

                    Bart:

                    I think your charts are superb and very enlightening. Thank you for taking the time to construct them.

                    Tybee

                    Comment


                    • #25
                      Re: Does USA 2009 = Argentina 2001? Part I: Falling economy reaches terminal velocity - Eric Janszen

                      Originally posted by Tybee Island View Post
                      Bart:

                      I think your charts are superb and very enlightening. Thank you for taking the time to construct them.

                      Tybee
                      Absolutely agree. No one spends more of their time trying to enlighten the rest of us as Bart. If I were Bart after spending all the time he does posting all the charts he does. I would kick back, put my feet up, and say "It's great to be the king."

                      Comment


                      • #26
                        Re: Does USA 2009 = Argentina 2001? Part I: Falling economy reaches terminal velocity - Eric Janszen

                        Originally posted by jk View Post
                        i, for one, found your charts and - even more so - the discussion here quite illuminating. you can't say Eichengreen and O'Rourke's charts were wrong, although you can - and did! - argue that they are misleading, and highlight that element of their construction that produced what you feel are misleading results.

                        more data is better.
                        In the end, we all make our own investment decisions. The more good data the better. Where else but iTulip can someone present an alternative perspective of the data and make a strong, intellectually rigorous, case in defense of their position. That's why I read iTulip.

                        Bart's perspective only adds to the strong presentation by EJ and the iTulip team.

                        Comment


                        • #27
                          Re: Does USA 2009 = Argentina 2001? Part I: Falling economy reaches terminal velocity - Eric Janszen

                          Originally posted by bart View Post
                          Fair enough Jim. I believe that the facts clearly speak for themselves.

                          Making comparisons and conclusions about the Great Depression while not using the accepted start date, and also not using the current recession start date strikes me as less than wise.

                          Per my experience, the majority of regular folk who have looked at those charts whether here or at other sites don't even realize that the original writers are going way out there with basing the charts on industrial production peaks, and are drawing incorrect and potentially very costly conclusions.
                          Points taken on the start dates for the data. However, we stand by the point that we make with the global money markets and fiscal spending charts and want to make sure that readers don't miss that point in the data minutia.

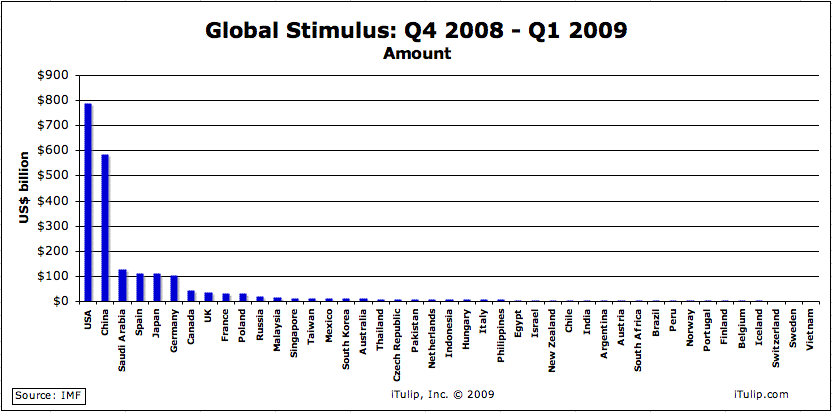
                          In the first year of this debt deflation crisis versus in 1930 governments are spending vastly more money more quickly to try to spend their way out of one kind of trouble, and in our opinion into another kind of trouble. In the final quarter of 2008 and first quarter of 2009 alone governments spent $2.2 trillion on fiscal stimulus as GDP fell. This level of deficit spending dwarfs any that occurred during The Great Depression.


                          Global fiscal stimulus as a percent of GDP: China, Spain and the U.S. lead the pack


                          Global fiscal stimulus in dollars: China, the U.S., and Saudi Arabia lead the pack

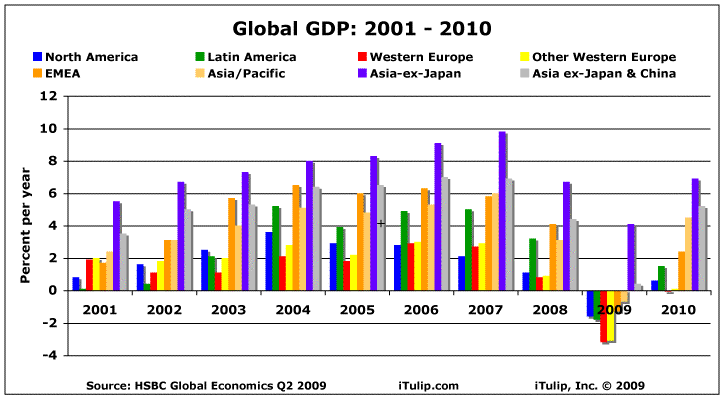
                          At the same time, GDP is declining.


                          Global fiscal spending to GDP ratio today dwarfs 1930, and all of the data we have confirms this fact. It reflects a very different view toward deficit spending held by governments today that developed out of the Great Depression and WWII experience.

                          This response by governments was not exactly a surprise to iTulip readers, any more than was the economic crash that led governments to execute on their "spend your way out of economic depression" philosophy.


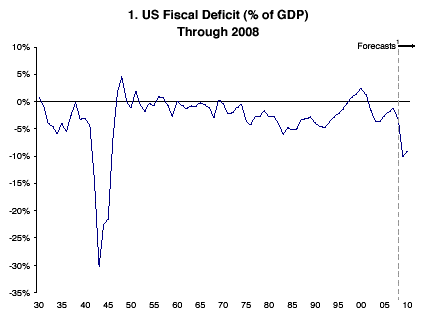
                          Without a doubt, the U.S. is leading the pack in the deficit spending area, as far as we know--if China's GDP numbers are to be believed.


                          Fiscal Deficit/GDP 1930 to 2009 (Goldman Sachs)

                          The focus of our analysis is on the U.S. and how its bet on fiscal stimulus is setting the economy up for a dire outcome if the stimulus fails and leaves the U.S. with gigantic debts and not enough cash flow to pay it off. One chart that went into the analysis but was not published with it should give readers pause. It backs up our assertion that the composition of U.S. foreign debt is becoming more precarious in the manner of Argentina in the late 2000.


                          Change in composition of debt to China, the USA's "IMF"

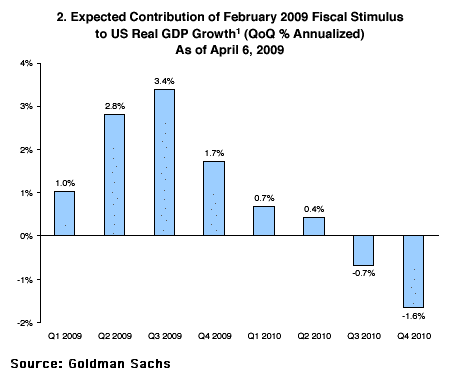
                          The same Goldman analysis that produced the chart above also forecasts the positive GDP impact of stimulus to peak in Q3 2009, which is one of the reasons we viewed the rally from March as a "first bounce." Note that Goldman expects the stimulus to begin to exert a negative impact on the economy in the final quarters of 2010.


                          Safe to say that is not going to happen--we'll get more stimulus spending before it does. :eek:

                          As for the global money supply, again the philosophy and practice today are quite different than in the early 1930s. Compare interest rates in major countries in 1930 versus today and you'll see what I mean. That said, it's not strictly relevant to our point; what matters is not the global money supply but the difficulty that the U.S. is having expanding broad money, as your excellent M3 chart shows.
                          Ed.

                          Comment


                          • #28
                            Re: Does USA 2009 = Argentina 2001? Part I: Falling economy reaches terminal velocity - Eric Janszen

                            Originally posted by bart View Post
                            Here's the one on global money supply, which again is just plain wrong or misleading.


                            The one I just built:


                            The misleading or incorrect one:


                            I urge extreme caution for anyone trying to draw conclusions from those misleading or outright wrong charts.
                            Bart, Thank you for the charts.

                            I have to ask:

                            you seem to be making a MAJOR implication as to what it would MEAN if the start of the derpression is misaligned.

                            Could you please (for me, since I'm a simpleton) explicitly state what the implication is? It looks to be a big one, and I'm missing it, so I have to ask, because I want to CLEARLY UNDERSTAND what you are saying.

                            Thank you.

                            Comment


                            • #29
                              Re: Does USA 2009 = Argentina 2001? Part I: Falling economy reaches terminal velocity - Eric Janszen

                              Thanks for the analysis EJ. It leads me to one question though. Who is going to war against who?

                              Comment


                              • #30
                                Re: Does USA 2009 = Argentina 2001? Part I: Falling economy reaches terminal velocity - Eric Janszen

                                Originally posted by bart View Post
                                Fair enough - that's three of you.

                                I won't bother to spend 4 hours on two charts next time to bring up a point here that my emails have shown that most don't understand and didn't get.
                                I'm not upset, just disappointed.
                                Thanks for your work, bart! It is always great to have someone out there that helps to clarify or even dispel misinformation. And you have done a great job, from my perspective, since I have been here! :cool:

                                Keep it up, buddy. Your efforts are definitely appreciated here.

                                Comment

                                Working...
                                X