Announcement

Collapse
No announcement yet.

Does USA 2009 = Argentina 2001? Part I: Falling economy reaches terminal velocity - Eric Janszen

Collapse
X
 
  • Filter
  • Time
  • Show
Clear All
new posts

  • bart
    replied
    Re: Does USA 2009 = Argentina 2001? Part I: Falling economy reaches terminal velocity - Eric Janszen

    Originally posted by FRED View Post
    Our issue with now versus then is that in those days capital flows were not terribly relevant to inflation but today they are all that matter.
    Mostly true, although the trade balance and gov't debt and USDX are three of the stats and do tell part a significant part of the story.

    Those charts are also US only so inevitably only tell part of the full story, albeit enough to show that now is very far from a repeat of then - which is and was my primary point, as noted in the title of that thread.


    Originally posted by linnj View Post
    Bart:

    Your mention of the "basics" led me to think of this analogy: automobiles have had many changes since 1929 to now, but their speeds are still pretty much the same. The "basic" limit on automobiles is not their inherent speed but the quality of the road system.

    Information storage, transmission, and retrieval have had tremendous increases in speed, but the transport of goods (and energy) are constrained by their infrastructures*. So if we were to make comparision of market changes then and now, we would have the least mismatch if we were to focus on transportation and energy issues.

    *Another "basic" constraint faced by transportation may be its degree of regulation.
    Yep, we're basically tracking.

    Leave a comment:


  • linnj
    replied
    Re: Does USA 2009 = Argentina 2001? Part I: Falling economy reaches terminal velocity - Eric Janszen

    Bart:

    Your mention of the "basics" led me to think of this analogy: automobiles have had many changes since 1929 to now, but their speeds are still pretty much the same. The "basic" limit on automobiles is not their inherent speed but the quality of the road system.

    Information storage, transmission, and retrieval have had tremendous increases in speed, but the transport of goods (and energy) are constrained by their infrastructures*. So if we were to make comparision of market changes then and now, we would have the least mismatch if we were to focus on transportation and energy issues.

    *Another "basic" constraint faced by transportation may be its degree of regulation.
    Last edited by linnj; August 11, 2009, 02:10 PM.

    Leave a comment:


  • FRED
    replied
    Re: Does USA 2009 = Argentina 2001? Part I: Falling economy reaches terminal velocity - Eric Janszen

    Originally posted by bart View Post
    Hot damn... interesting question, it even caused a little smoke to come out of my ears as the brain had to be engaged - and on a Monday. ;)

    Overall, I don't have any real problem with someone extending or compressing the stats if they think it would help but for me I don't see much advantage. People are pretty much the same and respond similarly now, and most "basics" are similar (as in fear, greed, other sentiment measures, and "total" money supply) - and in my opinion that's a much bigger factor than inventory adjustment speed or computer aided housing searches.

    There's also much faster & stronger response from the Fed now as compared to then, and monetary lags are quite similar over time too.

    You might get something out of my first attempt ( http://www.nowandfutures.com/great_depression_old.html ) to do comparisons between then & now since many of the charts show the entire period of the '30s - although they're not as clean or easy to understand as my more current work ( The Great Depression tight parallels... busted (v 2.0) - the text is out of date but the charts are as current as possible).

    Lastly, there's always:
    "History doesn't repeat itself, but it does rhyme."
    -- Mark Twain
    Our issue with now versus then is that in those days capital flows were not terribly relevant to inflation but today they are all that matter.

    Leave a comment:


  • bart
    replied
    Re: Does USA 2009 = Argentina 2001? Part I: Falling economy reaches terminal velocity - Eric Janszen

    Originally posted by linnj View Post
    Bart:

    I have a query about month-to-month graphical comparisons of various downturns. Is a "month" today equivalent to a "month" in 1992 or 1980 or 1929? Because of the rise of computers, inventory control takes place at a faster rate now. Also, the housing market can clear faster now because of computer-aided housing searches. So would the graphs of the current downturn have to be stretched to make a better comparison with the older data?
    Hot damn... interesting question, it even caused a little smoke to come out of my ears as the brain had to be engaged - and on a Monday. ;)

    Overall, I don't have any real problem with someone extending or compressing the stats if they think it would help but for me I don't see much advantage. People are pretty much the same and respond similarly now, and most "basics" are similar (as in fear, greed, other sentiment measures, and "total" money supply) - and in my opinion that's a much bigger factor than inventory adjustment speed or computer aided housing searches.

    There's also much faster & stronger response from the Fed now as compared to then, and monetary lags are quite similar over time too.

    You might get something out of my first attempt ( http://www.nowandfutures.com/great_depression_old.html ) to do comparisons between then & now since many of the charts show the entire period of the '30s - although they're not as clean or easy to understand as my more current work ( The Great Depression tight parallels... busted (v 2.0) - the text is out of date but the charts are as current as possible).

    Lastly, there's always:
    "History doesn't repeat itself, but it does rhyme."
    -- Mark Twain

    Leave a comment:


  • linnj
    replied
    Re: Does USA 2009 = Argentina 2001? Part I: Falling economy reaches terminal velocity - Eric Janszen

    Bart:

    I have a query about month-to-month graphical comparisons of various downturns. Is a "month" today equivalent to a "month" in 1992 or 1980 or 1929? Because of the rise of computers, inventory control takes place at a faster rate now. Also, the housing market can clear faster now because of computer-aided housing searches. So would the graphs of the current downturn have to be stretched to make a better comparison with the older data?
    Last edited by linnj; August 10, 2009, 06:01 PM.

    Leave a comment:


  • rabot10
    replied
    Re: Does USA 2009 = Argentina 2001? Part I: Falling economy reaches terminal velocity - Eric Janszen

    Originally posted by metalman View Post
    nitpick this asap.
    hey thats all good and fine but what about the trip to Vegas?

    Leave a comment:


  • metalman
    replied
    Re: Does USA 2009 = Argentina 2001? Part I: Falling economy reaches terminal velocity - Eric Janszen

    Originally posted by Morelia View Post
    EJ wrote:

    > Argentina
    and Ka-Poom Theory

    > We had not re-visited the case of Argentina since 1998
    > when we developed our now ten-year-old Ka-Poom Theory.

    "Poom: A random or not so random exogenous event that [blah, blah, blah] exposes the true level of risk [blah, blah, blah] causing lenders to loose confidence in the future purchasing power of the dollar and seek alternative reserve assets."

    10 years of misspelling "lose" does not inspire confidence, either.

    Please correct this ASAP.
    nitpick this asap.

    Leave a comment:


  • FRED
    replied
    Re: Does USA 2009 = Argentina 2001? Part I: Falling economy reaches terminal velocity - Eric Janszen

    Originally posted by surfersdsb View Post
    Mr. Jantzen I am a believer in your analysis and have structured my portfolio accordingly. I am reading a number of different well respected journals and articles that differ on the short and intermediate effects of inflation. They point to a number of factors that if the stock market weakens or moves sideways that deflation is the primary fear.

    Below is a part of a report which I believe lays out some very cogent arguments.


    Below I have laid out the link between Fed actions and the economy is far more indirect and complex than the simple conclusion that Federal asset growth equals
    inflation. The price level and, in fact, real GDP are determined by the intersection of the aggregate demand (AD) and aggregate supply (AS) curves. Or, in economic parlance, for an increase in the Fed’s balance sheet to boost the price level, the following conditions must be met:

    1) The money multiplier must be flat
    or rising;
    2) The velocity of money must be
    flat or rising; and
    3) The AS or supply curve must be
    upward sloping.
    The economy and price changes are moving downward because none of these conditions are currently being met; nor, in our judgment, are they
    likely to be met in the foreseeable future.


    Total U.S. debt as a percent of GDP surged to 375% in the first quarter, a new post 1870 record, and well above the 360% average for 2008.
    Therefore, the economy became more leveraged even as the recession progressed. An over-leveraged economy is one prone to deflation and stagnant growth. This is evident in the path the Japanese took after their stock and real estate bubbles began to implode in 1989. At that time Japanese debt as a percent of GDP was 269% (Chart 5). This percentage actually continued to move higher until 1998 when it peaked at 345%, below the current level in the U.S. While the Japanese increased leverage for nine years after the bubble highs, neither highly inflated stock and real estate prices nor economic performance could be sustained as debt repayment became more burdensome.

    Of the pieces that I have read there is little concern of dollar devaluation. The argument that they have used is that as long as the bank reserves are not released into the economy inflation given the above factors will have a hard time gaining ground.


    As a long term wall street oil trader one thing I have learned is don't fall in love with your position and be open to all information.

    Thanks in advance for your response.
    EJ writes in:

    surfersdsb,
    Your question is a good one, and your approach to not fall in love with a position is wise. My view is that "all models are wrong, but some are useful."

    Unlike most analysts who expect inflation, I do not foresee it coming directly as a result of the actions of monetary authorities. I also do not see domestic debt levels as a critical threshold, either. Rather I see the combination of foreign debt, fiscal deficits financed by foreign debt, and trade and deficits financed by capital inflows as the weak points that make the U.S. vulnerable to a balance of payments, currency, and debt crisis. Indirectly inflation results from these.

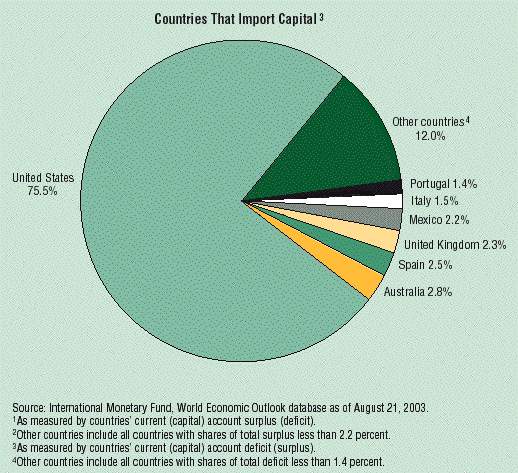
    This analysis From capital flow bonanza to financial crash is helpful both in explaining the phenomenon of a Capital Inflow Bonanza and the results when such a period ends. The glaring omission in this analysis is represented in the two graphs below.


    The U.S. imports more than 30 times as much of the world's capital flows as Spain, for example, yet the U.S. economy is only 9 times larger.

    The question is, what happens to the U.S. economy if it cannot continue to import 75% of the world's capital flows? What occurs is a Sudden Stop.

    The situation is unique. In the past, nations that enjoyed reserve currency status were net capital exporters. One can only speculate, but some version of a currency and debt crisis as has occurred in other countries under these circumstances is more likely than a stag-deflation as Japan, a net capital exporter, has experienced.


    Leave a comment:


  • Morelia
    replied
    Re: Does USA 2009 = Argentina 2001? Part I: Falling economy reaches terminal velocity - Eric Janszen

    EJ wrote:

    > Argentina
    and Ka-Poom Theory

    > We had not re-visited the case of Argentina since 1998
    > when we developed our now ten-year-old Ka-Poom Theory.

    "Poom: A random or not so random exogenous event that [blah, blah, blah] exposes the true level of risk [blah, blah, blah] causing lenders to loose confidence in the future purchasing power of the dollar and seek alternative reserve assets."

    10 years of misspelling "lose" does not inspire confidence, either.

    Please correct this ASAP.

    Leave a comment:


  • surfersdsb
    replied
    Re: Does USA 2009 = Argentina 2001? Part I: Falling economy reaches terminal velocity - Eric Janszen

    Mr. Jantzen I am a believer in your analysis and have structured my portfolio accordingly. I am reading a number of different well respected journals and articles that differ on the short and intermediate effects of inflation. They point to a number of factors that if the stock market weakens or moves sideways that deflation is the primary fear.

    Below is a part of a report which I believe lays out some very cogent arguments.


    Below I have laid out the link between Fed actions and the economy is far more indirect and complex than the simple conclusion that Federal asset growth equals
    inflation. The price level and, in fact, real GDP are determined by the intersection of the aggregate demand (AD) and aggregate supply (AS) curves. Or, in economic parlance, for an increase in the Fed’s balance sheet to boost the price level, the following conditions must be met:

    1) The money multiplier must be flat
    or rising;
    2) The velocity of money must be
    flat or rising; and
    3) The AS or supply curve must be
    upward sloping.
    The economy and price changes are moving downward because none of these conditions are currently being met; nor, in our judgment, are they
    likely to be met in the foreseeable future.


    Total U.S. debt as a percent of GDP surged to 375% in the first quarter, a new post 1870 record, and well above the 360% average for 2008.
    Therefore, the economy became more leveraged even as the recession progressed. An over-leveraged economy is one prone to deflation and stagnant growth. This is evident in the path the Japanese took after their stock and real estate bubbles began to implode in 1989. At that time Japanese debt as a percent of GDP was 269% (Chart 5). This percentage actually continued to move higher until 1998 when it peaked at 345%, below the current level in the U.S. While the Japanese increased leverage for nine years after the bubble highs, neither highly inflated stock and real estate prices nor economic performance could be sustained as debt repayment became more burdensome.

    Of the pieces that I have read there is little concern of dollar devaluation. The argument that they have used is that as long as the bank reserves are not released into the economy inflation given the above factors will have a hard time gaining ground.


    As a long term wall street oil trader one thing I have learned is don't fall in love with your position and be open to all information.

    Thanks in advance for your response.

    Leave a comment:


  • bart
    replied
    Re: Does USA 2009 = Argentina 2001? Part I: Falling economy reaches terminal velocity - Eric Janszen

    Originally posted by Jay View Post
    Do I read this as you use velocity to confirm other leading central bank pumping indicators, or as the leading indicator itself? I would guess it is the former. Also, does a more normal velocity indicate a soft landing, or impending high inflation (or both :eek!
    Yes, it is the former. Virtually all of my velocity measures have some central bank monetary measure as part of them.

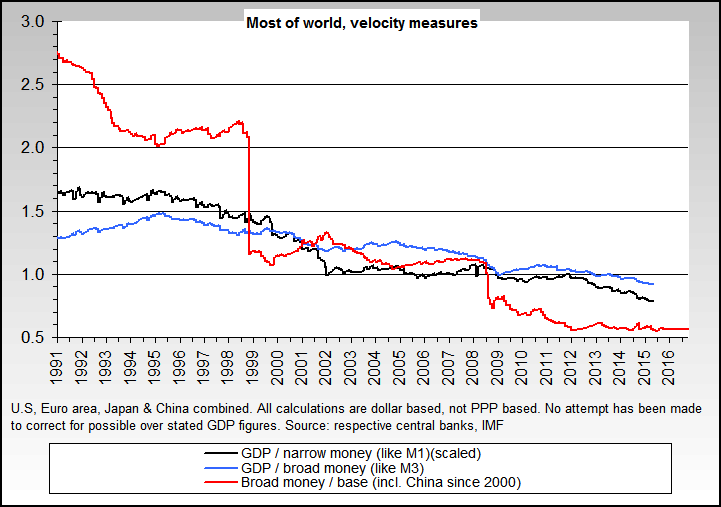
    We're back to a semantic or definition issue with "more normal". In other words, the closer it gets to what it was two or so years ago the more it points to impending high inflation.

    It is, best guess, currently back to levels of the late 1960s & early 1970s, which is about 10% higher than it was at the stock market peak in the late 1920s.


    And for my next trick, here's a brand new update of my world velocity tracking.

    Leave a comment:


  • Jay
    replied
    Re: Does USA 2009 = Argentina 2001? Part I: Falling economy reaches terminal velocity - Eric Janszen

    Originally posted by bart View Post
    The main reason to me of tracking velocity today is to track any leading indicators of central bank pumping that will lead back to a more normal velocity - the "soft landing" scenarios, or a signal that the Fed is truly serious about creating some inflation.
    Do I read this as you use velocity to confirm other leading central bank pumping indicators, or as the leading indicator itself? I would guess it is the former. Also, does a more normal velocity indicate a soft landing, or impending high inflation (or both :eek!

    Originally posted by bart View Post
    The Jedi Master would be Finster. He kindly loans me a few beasties from the Manor dungeon now & then to help keep the charting force strong... ;)
    Thems good beasties.

    Leave a comment:


  • bart
    replied
    Re: Does USA 2009 = Argentina 2001? Part I: Falling economy reaches terminal velocity - Eric Janszen

    Originally posted by Jay View Post
    So, by inference, this chart shows that in Weimar, people started spending first?
    Mostly no. In my opinion, the relative dip between late 1922 and mid/late 1923 was an adjustment period where there still was some small hope that things wouldn't get worse, and the late blowoff stage was when virtually everyone know it was all over for the Reichsmark.

    Keep in mind that the political context was a huge factor - German "pride" and nationalism and the feelings about the Versailles ripoff were *very* strong.

    If I had all the data before 1919, you'd also see other spikes based on WWI and then another on the Versailles penalty box agreement. The huge majority of the time with high inflation or hyperinflation, an actual event leads velocity - much like the "event" of Bear Stearns led the period when velocity collapsed resulting in disinflation/deflation.

    The main reason to me of tracking velocity today is to track any leading indicators of central bank pumping that will lead back to a more normal velocity - the "soft landing" scenarios, or a signal that the Fed is truly serious about creating some inflation.


    Originally posted by Jay View Post
    So, if you hypothetically possessed PM's ;), hold them until the US black market is created.... ;):eek: and hopefully don't piss off the govmint in the interim...
    A US black market in our future? :eek:
    Oh the (hypothetical) humanity!... :eek: :rolleyes: ;)

    In my opinion, eBay & craigslist are mild evidence of what's to come. The average premium on PMs is pretty steep, even for significant sized bars etc.

    An example with gold, silver has higher premiums on average.


    Originally posted by Jay View Post
    Probably the best compliment I could get here, from the jedi master himself... awesome.
    The Jedi Master would be Finster. He kindly loans me a few beasties from the Manor dungeon now & then to help keep the charting force strong... ;)

    Leave a comment:


  • Jay
    replied
    Re: Does USA 2009 = Argentina 2001? Part I: Falling economy reaches terminal velocity - Eric Janszen

    Originally posted by bart View Post
    In other words, the answer to your question is that it doesn't always lag but usually does.


    So, by inference, this chart shows that in Weimar, people started spending first?

    Originally posted by bart View Post
    Argentina wise, I'm unaware of any special PM laws enacted but the prices skyrocketed within a very short time.
    Also keep in mind that Argentina and most other countries in the area have seen hyperinflation in relatively recent times, and have active black & grey markets so a PM law wouldn't be very effective.
    So, if you hypothetically possessed PM's ;), hold them until the US black market is created.... ;):eek: and hopefully don't piss off the govmint in the interim...

    Originally posted by bart View Post
    By the way, cool table on poverty rates. You saved me some time in creating a chart.
    Probably the best compliment I could get here, from the jedi master himself... awesome.

    Leave a comment:


  • bart
    replied
    Re: Does USA 2009 = Argentina 2001? Part I: Falling economy reaches terminal velocity - Eric Janszen

    Originally posted by Jay View Post
    It would make sense that in a typical "currency event" velocity takes off after the inciting event , i.e. once the populace, who are behind the insiders time wise, realize there is a problem they start spending like mad to get what they can when they can. But the big wigs are out in front of the initial event getting their moolah out of dodge first. So it makes sense to me that velocity would lag the inciting event. Is that also typical in other cases? If that is so, as you have said, watch the gold price and don't be caught short handed. Did Argentina invoke any restrictive PM laws at the time? Thanks Bart.
    You can look at US financial flows data to see that bigwigs are already getting out of dodge, have been for some time and without fanfare.

    One of the things that makes velocity so difficult to nail down is that its primarily a confidence thing and therefore based on human opinion - notoriously fickle and changing.
    Since there isn't sufficient historical data as far as I know to put together a real Weimar velocity chart, I punted one together a while back by playing fast & loose with a definition just so I could see an example of its variability (and this is its first public appearance). In other words, the answer to your question is that it doesn't always lag but usually does.


    Argentina wise, I'm unaware of any special PM laws enacted but the prices skyrocketed within a very short time.
    Also keep in mind that Argentina and most other countries in the area have seen hyperinflation in relatively recent times, and have active black & grey markets so a PM law wouldn't be very effective.


    By the way, cool table on poverty rates. You saved me some time in creating a chart.

    Leave a comment:

Working...
X