 |
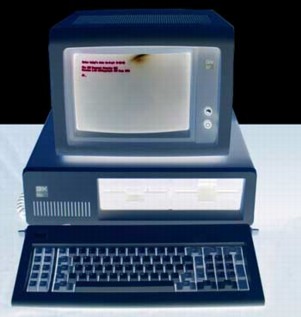
It’s October 1981, the year IBM launched personal computer, air traffic controllers went on strike and were fired by President Reagan, and Israeli jets destroyed a nuclear plant in Iraq. The annual inflation rate in September was over 12%, a 30 year Treasury bond carried a constant maturity rate of 14.68%, and the Effective Fed Funds Rate hit 15.5% as the Paul Volcker Fed stood on the brake pedal, determined to crash the economy to cut off multiple simultaneous inflation channels -- energy cost-push, supply shock, and the reckless monetary policy of the previous administration.
Thing is, no one believed it.
A risk-free government bond promised 14.68% interest for 30 years but no one wanted them. Gold traded between $432 and $453, or $1011 and $1063 in 2009 dollars, well below a peak of $850 – nearly $2000 2009 dollars -- on January 21, 1980.
With perfect 20/20 hindsight we ask, what was going on the heads of investors then? That 30 year bond produced stellar after-inflation returns for decades, and on a risk-adjusted basis was the best investment of a generation.
No one wanted it.
Why did investors collectively not see that the inflation rate was destined to fall? Few believed that the U.S. government was serious about putting the economy through two massive recessions, earning the certain wrath of voters, in order to wring inflation expectations out of the economy. Fixed income investment professionals didn’t believe it, stock market investors didn’t believe it, and certainly the gold bugs didn’t believe it. Some held on for 20 years as gold went down, down, down.
Just about everyone expected the politicians to chicken out and let inflation go on forever.
The majority were wrong.
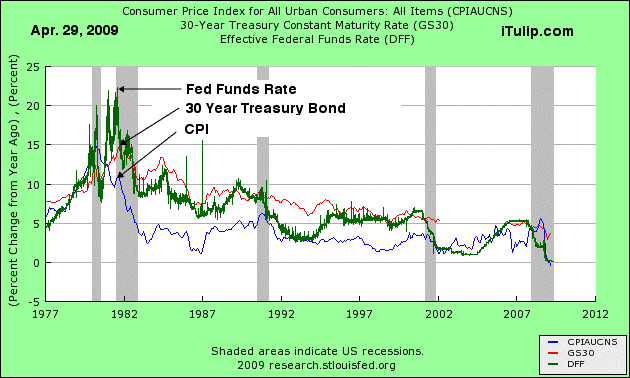
Today, the situation is a near perfect reverse of the situation investors faced in 1981. The annual inflation rate in March was a deflationary -1.7%, a 30 year Treasury bond carries a rate of 3.64%, the Effective Fed Funds Rate is close to 0%. Today just as few investors believe that central banks and governments are serious about, and capable of, halting deflation as expected the exact opposite of the same institutions 28 years ago – not this year, nor next year, nor in ten years, or even twenty.
The Great Divide
Humans extrapolate the recent past into the infinite future. But the history of transitions from inflation to deflation and back to inflation again is a story of discontinuous asset price responses to fiscal and monetary inputs.
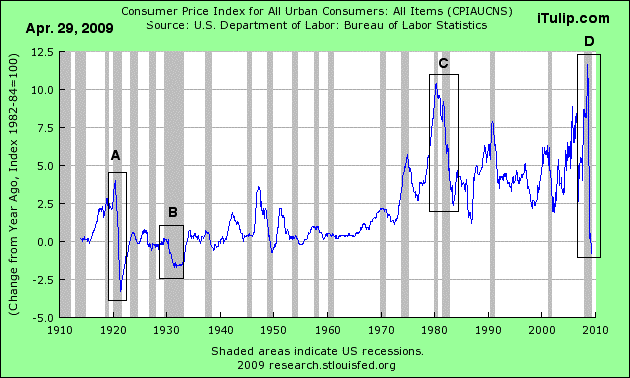
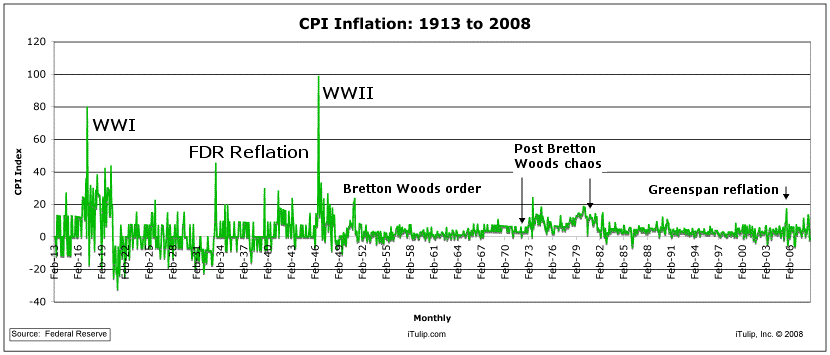
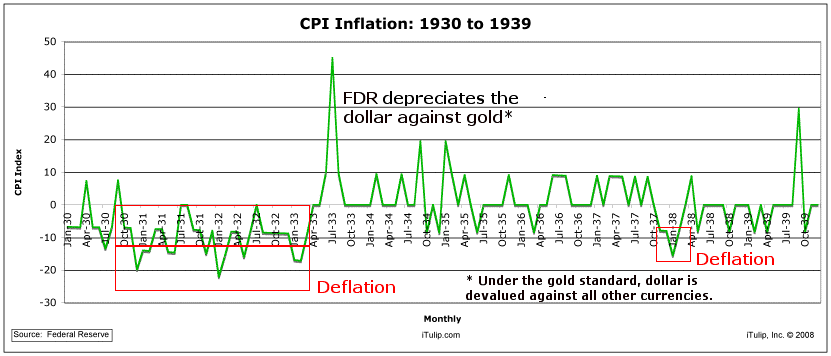
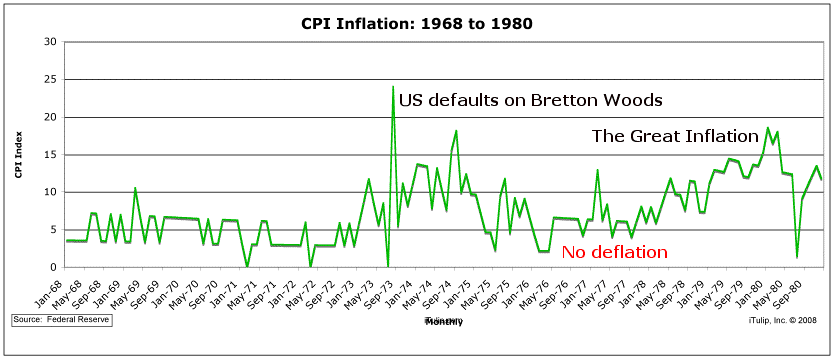
The current deflation period D shares more in common with the early 1920s depression period A than The Great Depression period B and bears no similarity to the disinflation created by the Fed in the early 1980s period C. Neither The Great Depression nor the depression that followed the end of WWI were intended as the 1981 and 1983 recessions were. Note the very quick reversal of deflation in 1921, and also the sharp reversal in 1933 when the U.S. devalued the dollar 69% against gold.
Deflation expectations have over the past two quarters become so deeply embedded in investor’s minds that they now see a deflationary pricing environment persisting for decades, this despite the fact that only a year ago they could not shake the prospect of ever rising inflation, fed as it was by cost-push energy import prices, in turn driven by a weak dollar. Markets also expect central banks, as the economy climbs out of recession, to move quickly to respond to any sign of inflation with rate hikes before inflation price cycles set in.
In other words, the vast majority of investors believe that central banks and governments have so fine tuned fiscal stimulus and monetary policy that the economy can grow out of recession without significant inflation and also that our government is willing to risk sending the economy back into recession in order to halt inflation, if it re-emerges.
We think investors have it wrong again. Big time. We see a collective miscalculation as great as 1981, but in reverse.
We believe the current Fed and administration will embrace a nominal economic recovery, even if real growth is negative, that is, even at the cost of high inflation. As usual, the inflation will be hidden by the government’s inflation data indexing and computation methodology, and manipulation of Treasury bond yields across the curve, but evidence will be apparent all around us. The benchmark 10 year Treasury bond price is now overtly manipulated by Fed. But commodity markets generaly are not. So while the bond markets are now pricing in a real economic recovery with very slow growth and near zero inflation for the foreseeable future, commodity investors are pricing in negative real growth just ahead. Call it The Great Divide.
Inflation inflection indicators
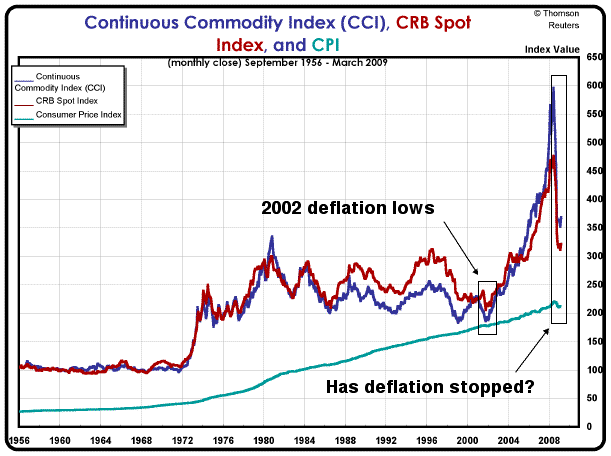
The anomaly in, then, in our model of current period as the negative image of the 1981 period are commodity prices, especially oil, and metals, including gold.
During the last period of deflation, these traded well below prices we see today.
The $2.2 trillion in global fiscal stimulus committed by governments over the past six months, with the U.S. and China leading the pack with 5.5% and 7.5% of GDP spent respectively, dedicated to demand creation plus trillions more in cash from central banks into the banking system to boost credit creation has at last halted the deflationary process in its tracks. Many falling trends, from retail sales to personal consumption expenditures, have either slowed their decline or even reversed. The euphoria that markets are expressing may be short lived, either because the growth will turn out to be unreal in the sense that it is self-sustaining or that it cannot be self-sustaining without also being inflationary and not real.
Our thesis since the middle of last year is that inflation will arise by late 2009 to early 2010 from three channels. One, a reduction in supply of raw, intermediate, and finished goods relative to demand due to the impact of the credit crunch on producers and retailers (see Fed cuts dollar, Fire sales and F.I.R.E. sales, Duh-flation, and the Bezzle is shrinking... again). Two, the inevitable impact of excessive money growth with lag effects (see Ka-Poom Theory deflation-inflation two-step: Too complex for deflationsts to grasp?). Three, a weakening dollar once global deleveraging ends (see Confusion reigns: A crisis-driven global rush to dollar liquidity is not deflation). We review these forecasts below.
Inventory Drop
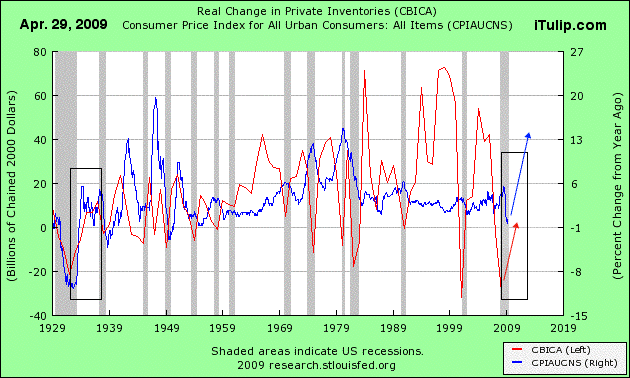
Yesterday the market rallied on decline in inventories. Again, the communal thought process is that this is a recession like any other since WWII and the decks are now cleared for inventory rebuilding. But as I have explained since at least 2005, this depression is nothing like any of the Fed induced recessions that have occurred since the end of WWII.
As previously noted, starting in Q3 2009 we should start to see the inflationary impact of the credit crunch induced supply crash. In this context, low inventories reflect a lack of availability of credit to float inventory. Persistent low inventories will cause prices to rise as Keynesian demand side stimulus succeeds while output and supply remain constrained.
Dollar Peaking
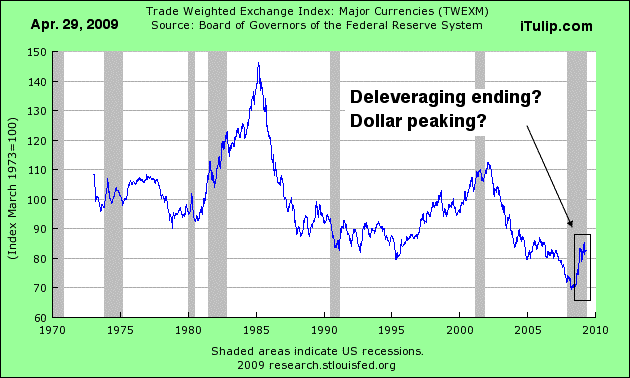
A period of global deleveraging began last year that drove up demand for dollar denominated assets and with them the dollar itself. In July 2008, we estimated that the period of deleveraging to last for approximately six months. In line with that forecast, the dollar rally produced by safe haven flight appears to be ebbing.
Money Growth
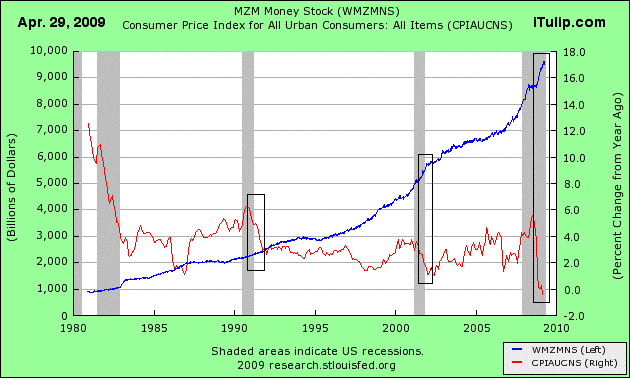
Money at Zero Maturity shows the Fed still standing on the gas. The long-term correlation between the money supply and inflation is irrefutable.
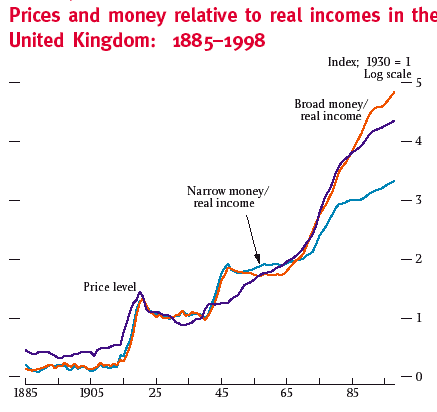
If the Fed keeps ramping the money supply in this fashion, inflation is inevitable.
Note we do not talk about velocity of money in this analysis. As Dr. Peter Warburton reminded me in a call yesterday, velocity is volatile – changes diection quickly -- and has zero predictive value, unlike the money supply itself. Using the velocity of money to try to detect the future direction of inflation is like running through the woods at full speed with your eyes closed and your arms extended in hopes of avoiding injury.
Summary
As the period of rising inflation arrives, the U.S. economy will appear to recover -- and will in nominal terms, but not in real terms. The commodity markets are wise to this; unlike the 1981 period, the bond market investors are not. As the 1981 era, the equity markets are confused, not knowing whether to price in inflation or deflation, as the credit crunch reduces supply (inflationary), creates industry consolidation (inflationary), while weak demand weighs on earnings (deflationary). The cross-currents in our view weigh in favor of a general price inflation in coming quarters.
In Everyone is wrong, again – 1981 in Reverse Part II: Nine Signs of Inflation we review a recent paper by Dr. Warburton following our interview with him yesterday.
 |
($ubscription)
There we were, slaving away on a new macro analysis, trying to navigate our post FIRE Economy, post-market world, with its fiscal spending boom and bust cycles, and the Fed buying benchmark 10 year Treasury bonds, messing with the world's sea level measure of inflation, U.S. sovereign bond yields.
Despite taking an approach to disprove our own theory of impending inflation, all the data kept leading us back to our conviction that we will see significant inflation arising in the U.S. as soon as Q4 2009 but no later than early 2010 due to a combination of three factors: one, credit crunch induced supply shock meets Keynesian fiscal spending based aggregate demand stimulus; two, persistent money supply growth after lag effects; and three, cost-push price inflation as we experienced in the 2004 to 2008 period, the last time the dollar weakened, once the bid for dollars slows after the end of global debt deleveraging in Q1 2009.
__________________________________________________
To receive the iTulip Newsletter or iTulip Alerts, Join our FREE Email Mailing List
Copyright © iTulip, Inc. 1998 - 2007 All Rights Reserved
All information provided "as is" for informational purposes only, not intended for trading purposes or advice. Nothing appearing on this website should be considered a recommendation to buy or to sell any security or related financial instrument. iTulip, Inc. is not liable for any informational errors, incompleteness, or delays, or for any actions taken in reliance on information contained herein. Full Disclaimer


Comment