
U.S. Marines landing at Inchon as battle rages during Korean Civil War.
Location: Inchon, Korea
Date taken: 1950
Photographer: Hank Walker
Life Images
Post-credit bubble, pre-war economy
Sectors of the stock market speak
(This article is a continuation of Essential Trends - Part I-B: Gold in an Era of Global Monetary System Regime Change $subscription..)
Underlying the combination of depressed output and rising inflation is an increase in import prices resulting from two years of Print and Pray policy.
We're accustomed to seeing inflation in insurance, health care, education and other non-traded services that have been inflated via the sector-specific credit-money of the rent seeking institutions of the FIRE Economy. In 2006 we created an inflation chart that shows how we experience inflation int he U.S. The price of traded durable goods, such as autos, have remained flat or even declined due to a combination of increased mechanization of manufacturing and low wage manufacturing in Asia and Latin America. (By non-traded we mean that goods and services purchased domestically that are not subject to foreign competition.)
The price of non-durable goods, such as clothing, declined while the prices of non-traded services, especially health care, insurance, and housing, continued to climb at double-digit annual rates. The combination of the two, deflation in the prices of traded goods and inflation in non-traded services and some goods (e.g., housing), produces the benign CPI number that the BEA has printed since 1990. Starting in 2001, oil prices pushed up the price of all energy-related items, such as food, a process interrupted by the crash of 2008. However, energy and food prices are left out of the CPI as being "too volatile" to include. I argue that 10 years of energy price increases does not constitute a short-term trend. At some point persistent cost-push inflation from high energy prices will have to be figured into the CPI.
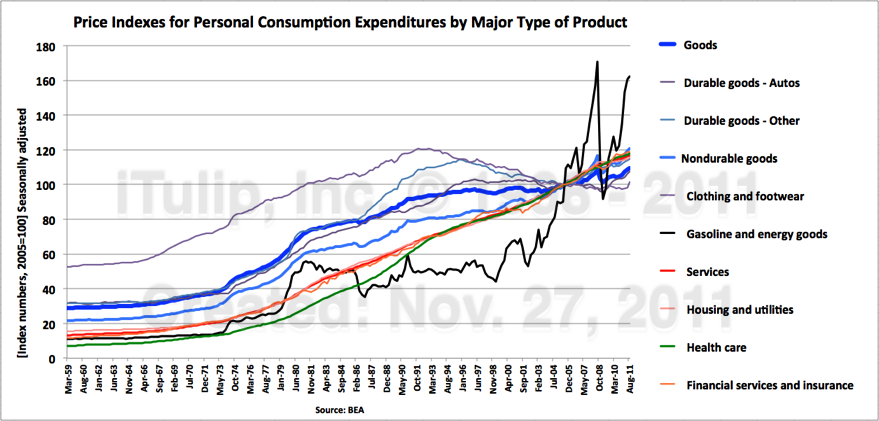
Declining or flat traded goods prices + Rising non-traded services prices - "volatile" energy prices = Benign CPI
The question we have asked since 2006 is this: what happens to headline inflation if the U.S. loses the good deflation component of the pricing regime because something occurs to increase the prices of imported durable and non-durable goods?
The "something" that happened was the collapse of the housing bubble and the Print and Pray reflation policies adopted by the Bernanke Fed to cope with its macroeconomic impact.
We promised you inflation before the end of 2011 due to misguided asset price inflation policy. Bernanke and company delivered.
Cars and Houses
Housing and autos are the two largest consumption items of the U.S. economy. There has never been a recovery in U.S. history that did not also produce a major increase in both auto and home sales. These two economic bellwethers highlight the failure of Print and Pray: both housing and auto sales remain depressed, but while home prices are still falling auto prices are rising.
From 1999 to 2008, we counted housing among the major consumer costs that grew due to sector-specific credit-money inflation. Housing prices inflated to consume more than 40% of personal consumption expenditure by 2008. That has changed dramatically over the past several years.
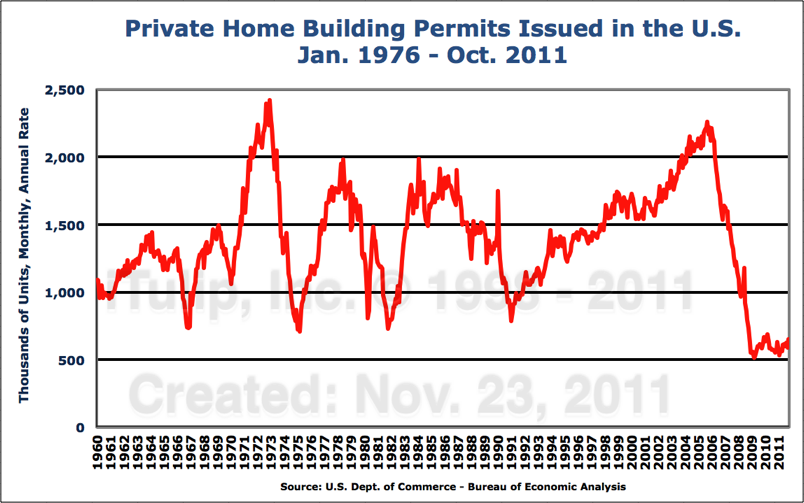
Issuance of building permits for new homes is the lowest on record.
Demand for new homes has never been lower since records began in 1960. Which housing markets have suffered the most? High, mid, or low end?
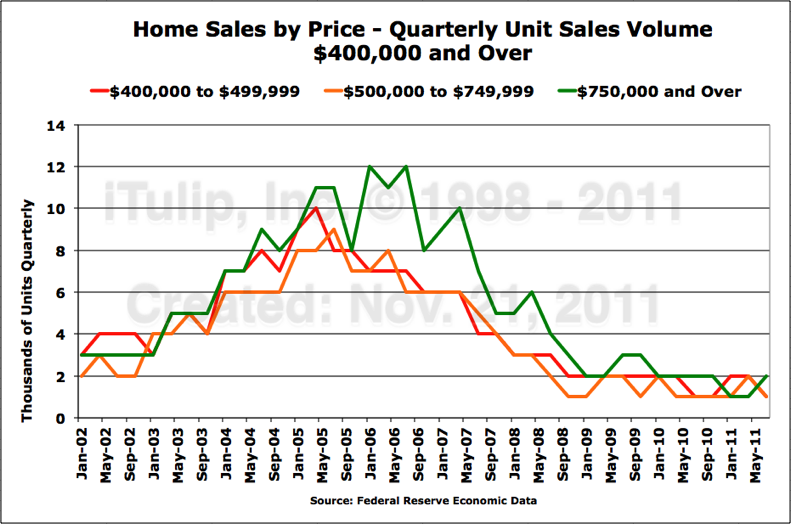
Thousands of homes sold per quarter. The high end is off by a factor of 12.
The market for homes over $750,000 is virtually dead. At the peak of the bubble in 2006, at the time we called a top in the housing bubble, 12,000 such homes old in a three month period. Across the entire United States, fewer than 1,000 homes in that price range sold in Q2 2011. Before the bubble, even during the output gap of 2003, approximately three times that many sell in a quarter.
While the high end of the housing market has seen a greater decline in unit sales than at the mid and low end housing market, the mid-range is still off 50% to 85% from the peak.
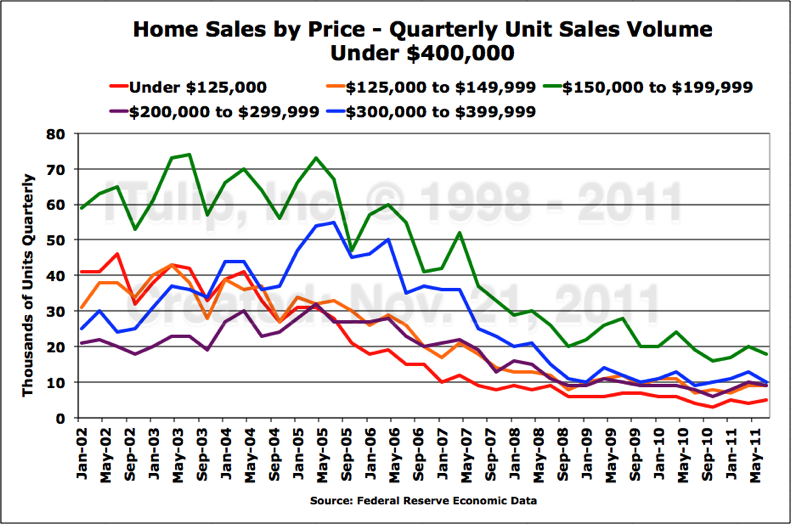
Home sales in the mid-range is off by a factor of three from the peak and the low end by a factor of eight.
Sales in the previously hot $150,000 to $200,000 market has fallen from over 70,000 units in Q2 2005 to under 20,000 in Q3 2011 despite focused attention by banks and government to reflate the bread and butter of the U.S. housing market.
The very low end of the market is almost as bad off as the very high end. It peaked at 40,000 units per quarter in the spring of 2004, only to collapse to 5,000 in Q3 2011.
Needless to say, home prices continue to decline. We maintain our conviction on our early 2006 forecast for a 10 to 15 year period for U.S. home prices to revert to the pre-bubble mean.
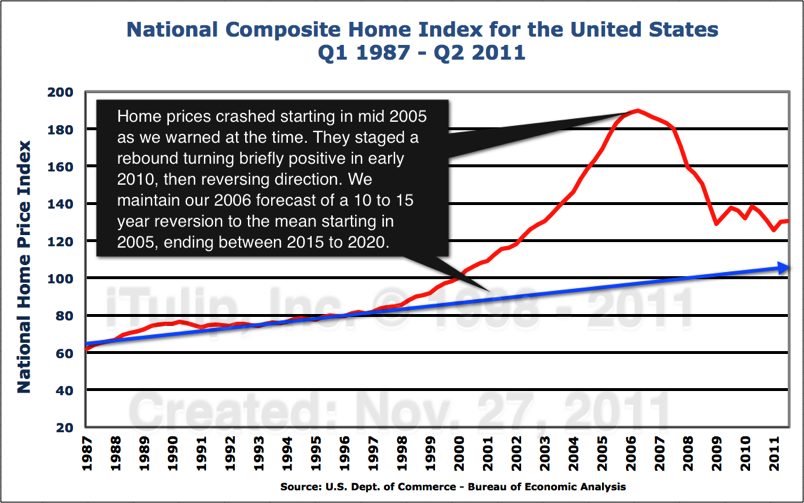
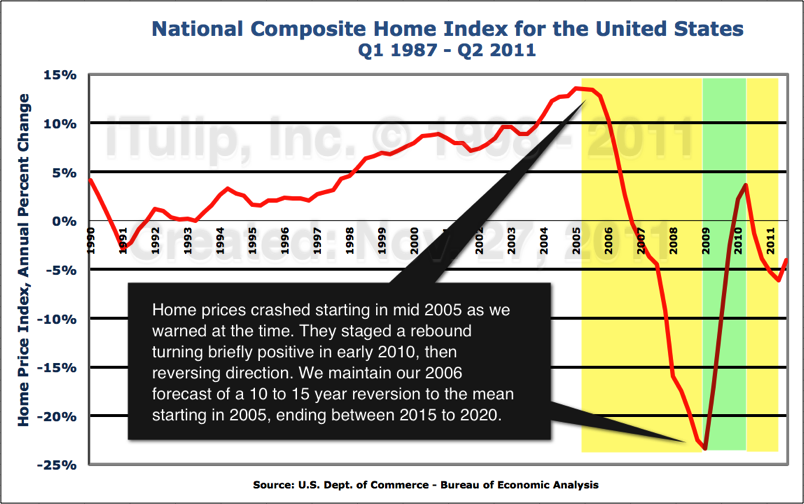
The futility of the Fed's effort to reflate home prices by manipulating mortgage rates downward by purchasing long bonds is as predictable as the outcome of the housing bubble itself. The Fed cannot possibly hope to compensate for the collapse of the asset-backed securities market that financed the housing bubble. Equally predictable is the Fed's attempt to compensate for debt deflation in the household sector, the tendency of households to repay old debt faster than they take on new debt during an output gap.
Asset Price Reflation policy ignites goods price inflation but not wages
Asset price deflation in housing is the obvious and predictable consequence of a dearth of housing credit-money needed to re-inflate housing prices; its engine -- the asset-backed securities market -- is still on a central bank respirator. But credit-money inflation does not account for rising prices of durable and non-durable goods. Revolving credit continues to contract.
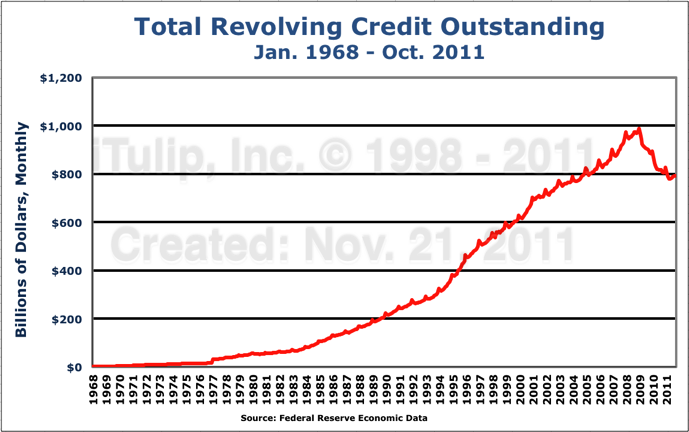
Revolving credit = credit card and auto loans. The epic declines since 2008
are at the heart of the Output Gap Trap story.
As energy price inflation rises to near early 2008 levels, we'd expect price inflation in (more $Subscription...)
iTulip Select: The Investment Thesis for the Next Cycle
Copyright © iTulip, Inc. 1998 - 2011 All Rights Reserved
All information provided "as is" for informational purposes only, not intended for trading purposes or advice. Nothing appearing on this website should be considered a recommendation to buy or to sell any security or related financial instrument. iTulip, Inc. is not liable for any informational errors, incompleteness, or delays, or for any actions taken in reliance on information contained herein. Full Disclaimer