
Funhouse Mirrors #1: Personal Savings Rate
So how is the US economy doing, anyway? Hard to say. Using government stats to size up the economy is like trying to gauge the results of your diet by standing on a rigged scale in front of a funhouse mirror.
This is the first of a random series of brief treatments we call "Funhouse Mirrors." Today: the Personal Savings Rate.
Definition
The BEA's National Income and Product Accounts (NIPA) definition of personal saving is the difference between personal disposable income and personal spending. Personal income includes wages, asset income (dividends and interest), rental income and supplements to wages, including pension and 401(k) contributions, including pension contributions made by employers to traditional defined benefit plans as though they were individual income--but not the subsequent gains (or losses) they might incur. NIPA excludes capital gains--both from investments (including investments within retirement plans).
Simple, right? Nope. Here come the warped mirrors.Software: A New Calculus for the New Economy
Business Week 1999
The Commerce Dept. also rejiggered the composition of the national savings accounts, raising personal savings while lowering government savings by an equal amount. That's because of a new way of accounting for government pension plans, contributions to which are now considered a form of personal rather than governmental savings.
The reshuffling means that the personal savings rate is now calculated as 3.7% for 1998 instead of a previously reported 0.5%. The new methodology will undoubtedly turn the current personal savings rate from negative to positive. But since the government's savings fell by a corresponding amount, the reshuffling had no impact on the overall national savings rate. And the downward trend in personal savings is still in place. By the new measure, the personal savings rate declined from 10.9% in 1982 to 3.7% last year, instead of from 9% to 0.5% as had been previously reported.
Even after this new "formulation" the personal savings rate still declined into negative territory, frustrating the government's effort to make an ugly statistic pretty. Business Week 1999
The Commerce Dept. also rejiggered the composition of the national savings accounts, raising personal savings while lowering government savings by an equal amount. That's because of a new way of accounting for government pension plans, contributions to which are now considered a form of personal rather than governmental savings.
The reshuffling means that the personal savings rate is now calculated as 3.7% for 1998 instead of a previously reported 0.5%. The new methodology will undoubtedly turn the current personal savings rate from negative to positive. But since the government's savings fell by a corresponding amount, the reshuffling had no impact on the overall national savings rate. And the downward trend in personal savings is still in place. By the new measure, the personal savings rate declined from 10.9% in 1982 to 3.7% last year, instead of from 9% to 0.5% as had been previously reported.
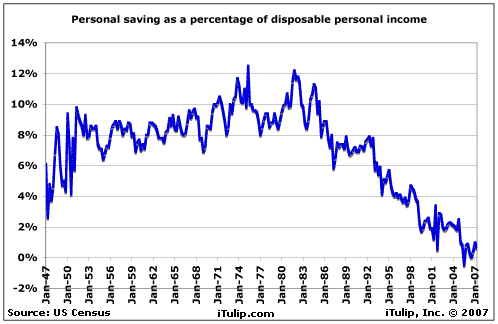
Where are we now?
"Personal saving as a percentage of disposable personal income was a -0.5% in February, the same as in January. Negative personal saving reflects personal outlays that exceed disposable personal income."
-U.S. Commerce Department, Bureau of Economic Analysis (BEA), June 2006
Makes you wonder what the rate would have been by the old rules. Let's see. If 3.7% in 1999 by the new rules was 0.5% in 1999 by the old rules, what's negative -0.5% in 2007 by the old rules? Negative 3.3%? Yikes.-U.S. Commerce Department, Bureau of Economic Analysis (BEA), June 2006
If personal saving is so negative, how are wage earners making ends meet? Are they making up the difference using income from capital gains, which are not counted as personal saving?
For the top 5% of households, capital gains are indeed a significant portion of income.
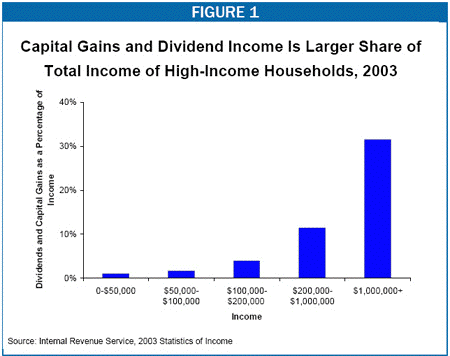
These tend to be households of persons of retirement age who are no longer employed and are living off their retirement savings income. However, this income is not counted in the BEA's savings numbers because the net of personal disposable income from capital gains and personal spending are the result of earlier savings that were already counted as saving back when they were working.
What does that leave as a source of funds to make up the delta between disposable income and spending?
Debt, of course.
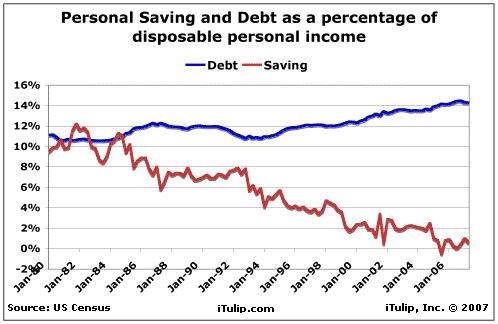
Which begs the question: Why is it getting harder for wage earners to save? The answer: Inflation. Not wage inflation, but goods and services price inflation.
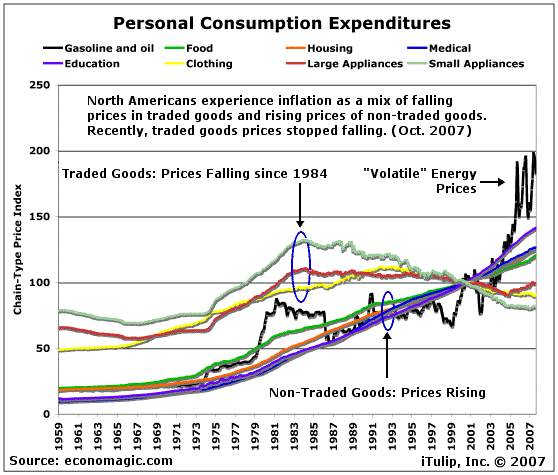
We go into the topic of inflation in detail in Funhouse Mirrors #2. Briefly, here's the deal.
We typically see consumer price inflation reported via the Consumer Price Index or CPI. Like the personal savings rate, the CPI is a complicated and ever-changing formulation itself that increasingly stretches credulity. You may shake your head when you read that CPI inflation has only increased a few percentage points this year even as your food, gasoline, insurance, and tuition bills go through the roof.
In addition to the exclusion of "volatile" components, such as energy, from the "core" reported CPI number, the main reason the CPI doesn't relate to your experience is that the CPI is a composite of traded goods and services that are mostly imported and non-traded goods and services that are largely domestically produced or provided with no practical price competition. In other words, you have a dozen different stores to go to and vendors to chose from when you buy a cell phone made in Japan. But you aren't going to fly to Korea for a cheaper MRI, or fly home to Mexico every night because housing is cheaper there–travel costs outweigh the goods or service price advantage.
Since the early 1980s, prices of traded goods such as clothing and small appliances and electronics from Asia have been falling while the prices of non-traded goods and services, such as education and health care, have been rising. Inflation in the prices of the latter are a function of domestic credit production, that is, the Fed and the credit markets. Inflation in the prices of the former are offset by low wage rates and currency management by goods exporting countries, especially China. Guess which items you tend to spend the most on? That's right. You're never going to spend as much in total on imported electronics and clothes, which prices are falling, as you spend in total on tuition, insurance, housing and other items that pick up all the monetary inflation which manifests as rising prices. Combine that with the exclusion of gasoline and other items with "volatile" prices from the CPI are and you can understand why a low CPI reads like nonsense.
But don't expect the situation to improve much. As Asia and other exporting areas of the world grow more wealthy, wage rates are rising, and as Asian currencies strengthen against the dollar, import prices will rise. That means the long era of "cheap" imports is coming to a close, and even the "core" CPI will soon begin to rise along with long term interest rates.
What about wage inflation? If credit is driving up the prices of goods and services, aren't wage earners' wages rising just as fast?
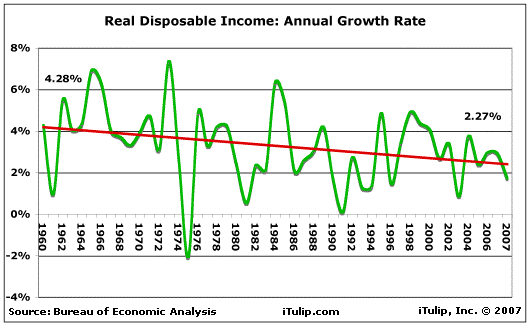
No. BEA data clearly show the growth rate of real (inflation adjusted) disposable income steadily declining, from an annual growth rate of 4.28% in 1960 to 2.27% last year. The annual growth in disposable income varies significantly year to year but as the chart trend line shows, the long term trend has been downward for decades.
Conclusion
In the government funhouse mirrors, the US economy appears to be healthy. Taking away the personal savings rate mirrors reveals a nation of individuals who are not earning enough to offset the rising cost of living, even with cheap imports. Wages may be rising, but not as fast as the prices of goods and services, and you are spending more on items that are rising in price than you are on items that have been falling in price. Wage earners are making up the difference by increasing their borrowing.
This describes what you actually experience when you look around you and talk to your friends and neighbors, and what you experience yourself, doesn't it?
The message is this: you are not crazy. The numbers are crazy, the way they are collected and analyzed by the government. You're just fine.
Next we'll dig into the inflation numbers. When we're done, you won't feel like you've lost your mind when you read the Fed say "inflation is moderating" just after you've ordered Chinese take-out off the forth menu with new prices you've seen this year. The problem isn't you. The problem is your government.
iTulip Select: The Investment Thesis for the Next Cycle™
__________________________________________________
For a book that explains iTulip concepts in simple terms see americasbubbleeconomy
For the safest, lowest cost way to buy and trade gold, see The Bullionvault
To receive the iTulip Newsletter or iTulip Alerts, Join our FREE Email Mailing List
Copyright © iTulip, Inc. 1998 - 2007 All Rights Reserved
All information provided "as is" for informational purposes only, not intended for trading purposes or advice. Nothing appearing on this website should be considered a recommendation to buy or to sell any security or related financial instrument. iTulip, Inc. is not liable for any informational errors, incompleteness, or delays, or for any actions taken in reliance on information contained herein. Full Disclaimer
We typically see consumer price inflation reported via the Consumer Price Index or CPI. Like the personal savings rate, the CPI is a complicated and ever-changing formulation itself that increasingly stretches credulity. You may shake your head when you read that CPI inflation has only increased a few percentage points this year even as your food, gasoline, insurance, and tuition bills go through the roof.
In addition to the exclusion of "volatile" components, such as energy, from the "core" reported CPI number, the main reason the CPI doesn't relate to your experience is that the CPI is a composite of traded goods and services that are mostly imported and non-traded goods and services that are largely domestically produced or provided with no practical price competition. In other words, you have a dozen different stores to go to and vendors to chose from when you buy a cell phone made in Japan. But you aren't going to fly to Korea for a cheaper MRI, or fly home to Mexico every night because housing is cheaper there–travel costs outweigh the goods or service price advantage.
Since the early 1980s, prices of traded goods such as clothing and small appliances and electronics from Asia have been falling while the prices of non-traded goods and services, such as education and health care, have been rising. Inflation in the prices of the latter are a function of domestic credit production, that is, the Fed and the credit markets. Inflation in the prices of the former are offset by low wage rates and currency management by goods exporting countries, especially China. Guess which items you tend to spend the most on? That's right. You're never going to spend as much in total on imported electronics and clothes, which prices are falling, as you spend in total on tuition, insurance, housing and other items that pick up all the monetary inflation which manifests as rising prices. Combine that with the exclusion of gasoline and other items with "volatile" prices from the CPI are and you can understand why a low CPI reads like nonsense.
But don't expect the situation to improve much. As Asia and other exporting areas of the world grow more wealthy, wage rates are rising, and as Asian currencies strengthen against the dollar, import prices will rise. That means the long era of "cheap" imports is coming to a close, and even the "core" CPI will soon begin to rise along with long term interest rates.
What about wage inflation? If credit is driving up the prices of goods and services, aren't wage earners' wages rising just as fast?
No. BEA data clearly show the growth rate of real (inflation adjusted) disposable income steadily declining, from an annual growth rate of 4.28% in 1960 to 2.27% last year. The annual growth in disposable income varies significantly year to year but as the chart trend line shows, the long term trend has been downward for decades.

Conclusion
In the government funhouse mirrors, the US economy appears to be healthy. Taking away the personal savings rate mirrors reveals a nation of individuals who are not earning enough to offset the rising cost of living, even with cheap imports. Wages may be rising, but not as fast as the prices of goods and services, and you are spending more on items that are rising in price than you are on items that have been falling in price. Wage earners are making up the difference by increasing their borrowing.
This describes what you actually experience when you look around you and talk to your friends and neighbors, and what you experience yourself, doesn't it?
The message is this: you are not crazy. The numbers are crazy, the way they are collected and analyzed by the government. You're just fine.
Next we'll dig into the inflation numbers. When we're done, you won't feel like you've lost your mind when you read the Fed say "inflation is moderating" just after you've ordered Chinese take-out off the forth menu with new prices you've seen this year. The problem isn't you. The problem is your government.
iTulip Select: The Investment Thesis for the Next Cycle™
__________________________________________________
For a book that explains iTulip concepts in simple terms see americasbubbleeconomy
For the safest, lowest cost way to buy and trade gold, see The Bullionvault
To receive the iTulip Newsletter or iTulip Alerts, Join our FREE Email Mailing List
Copyright © iTulip, Inc. 1998 - 2007 All Rights Reserved
All information provided "as is" for informational purposes only, not intended for trading purposes or advice. Nothing appearing on this website should be considered a recommendation to buy or to sell any security or related financial instrument. iTulip, Inc. is not liable for any informational errors, incompleteness, or delays, or for any actions taken in reliance on information contained herein. Full Disclaimer

Comment