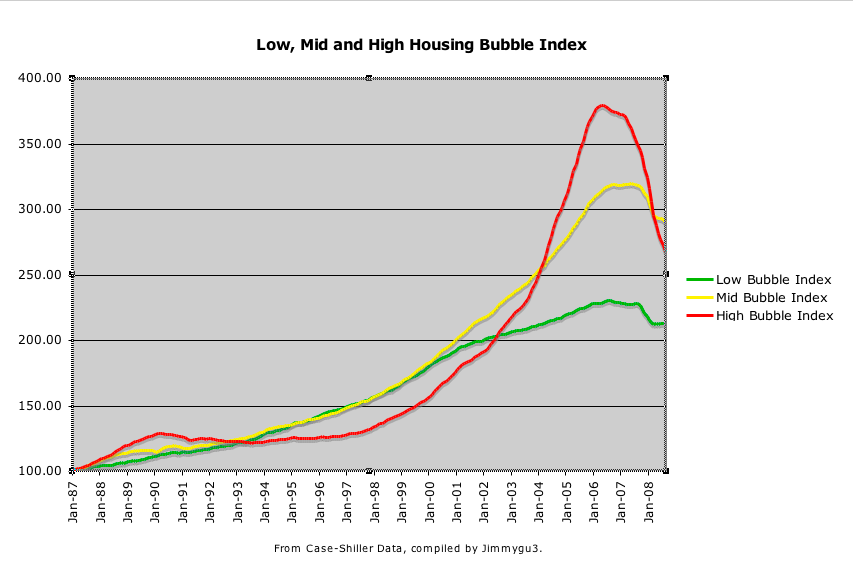
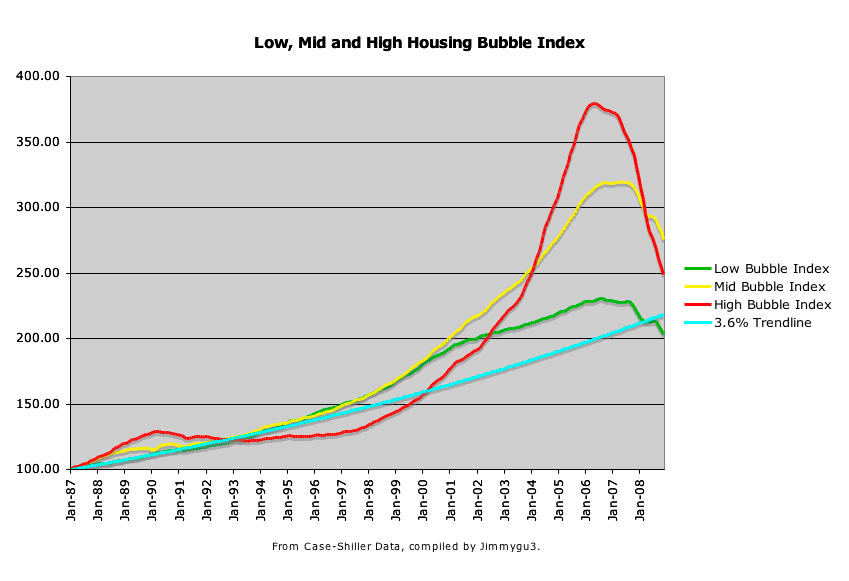
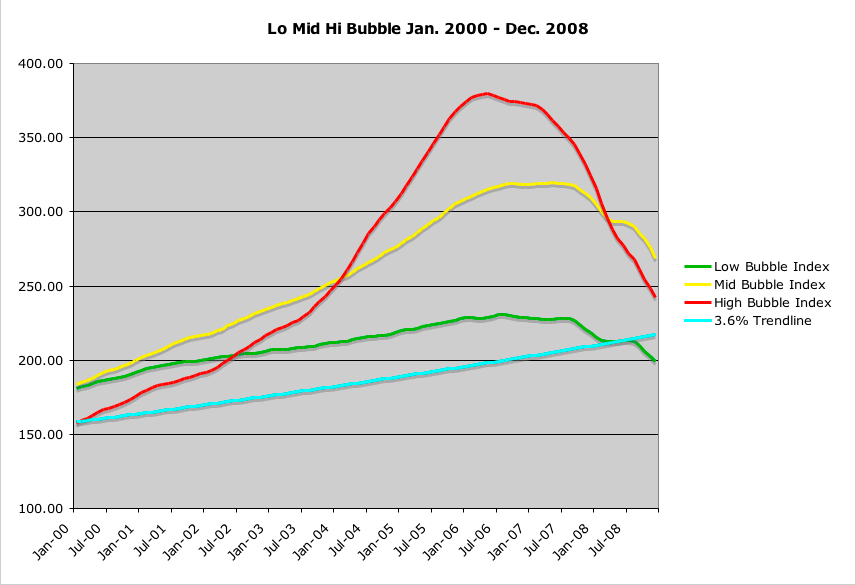
This chart breaks down the Case-Shiller Housing data into 3 groups: Low Bubble (less than 6% annual housing price growth during 2000-2006 bubble period), Mid Bubble (6-10% annual growth during bubble period), and High Bubble (over 10% average annual growth during bubble).
Lo Bubble: Denver, Atlanta, Detroit, Charlotte, Cleveland, Dallas
Mid Bubble: Chicago, Boston, Minneapolis, Portland, Seattle
High Bubble: Phoenix, Los Angeles, San Diego, San Francisco, DC, Miami, Tampa, Las Vegas, New York
The data has also been seasonally adjusted based on historical annual cycles which bottom in February and peak in August. The most recent data available at this time is the May 2008 Case-Shiller report.
One thing you may notice is that the Low Bubble index has been flat for 3 months. Detroit is pulling down on that index while the other cities are showing some strength. Mid Bubble has begun to reduce its rate of decline and High Bubble is still dropping like crazy.
Another noteworthy observation is that the High Bubble cities all had flat or declining prices for a significant period in the '90s. That snowball got pushed up the hill and then was released, picked up momentum and grew faster than the others, creating the biggest bubble. Or...snowman.
June data is due out next Tuesday. Look for many Low and Mid Bubble cities to post positive month-to-month gains. Keep in mind that the seasonal adjustment for May is -.04%, while June is -.36%. So any city or index posting greater than .32% month-to-month increase is showing a real positive trend.
We are due for 3 months of cyclical increases and the MSM will play it up to be the end of the housing bubble based on the growing number of markets that will no longer be declining. Then we'll have the down trend through Feb '09. I'll keep updating the chart to try to sort out what is just seasonal fluctuations and what is a real change of trend.
Jimmy


Comment