 |
With the S&P up 23% from March 2009 lows, gold up 23% from October 2008 lows, and oil up 42% from December 2008 lows, we bid farewell to the “deflation” that barely was. We’d make the farewell fond but it wasn’t around long enough for us to get intimate. You missed it entirely if you dozed off as the snow fell at the end of 2007 positioned as we were in Treasury bonds and gold to awake in the spring of 2009, yawning and sniffing the daffodils, crocuses, and Krugerrands.
In 1999 we adopted the term “disinflation” to describe these blink-you-missed-it inflation dips that trail behind the collapse of the latest bigger than the last macro-economy scale asset bubble. In the cycle of asset price inflations that has gone on for more than 20 years, post-bubble disinflation ends when the monetary and fiscal stimulus reaction of government kicks in, even if real economic growth does not. With each systemic bailout of a finance-based FIRE Economy more desperately enormous than the last, the concept of “real” goes beyond the usual meaning of growth adjusted for consumer price inflation to include adjustments for asset price inflation, as well.
For the current bubble cycle that started in 2001 when we piled into gold, we took then aspiring Federal Reserve Chairman Ben Bernanke at his word when he promised in his now famous speech Deflation: Making Sure "It" Doesn't Happen Here to let slip the dogs of inflation should a deflation spiral threaten our economic shores. He assured us the Fed will apply every tried and true monetary tool, and a dozen untested and experimental—nay, lunatic—methods as well, should a self-reinforcing process of debt deflation, falling asset and commodity prices menace the brazenly over-indebted U.S. economy.
Not that Bernanke will ever admit the U.S. was brazenly over-indebted. To a central banker an economy can never have too much debt, only not enough nominal cash flows to pay it off. In retrospect Bernanke’s 2002 speech reads like a public job interview aimed at members our financial oligarchy who were in the market for the right man to take the FIRE Economy’s monetary policy driver’s seat after their boy Greenspan left the post in 2006—and the nation’s financial system on the precipice of collapse.
Bernanke gushed, “I am confident that the Fed would take whatever means necessary to prevent significant deflation in the United States and, moreover, that the U.S. central bank, in cooperation with other parts of the government as needed, has sufficient policy instruments to ensure that any deflation that might occur would be both mild and brief.”
Deflation mild and brief... You can say that again
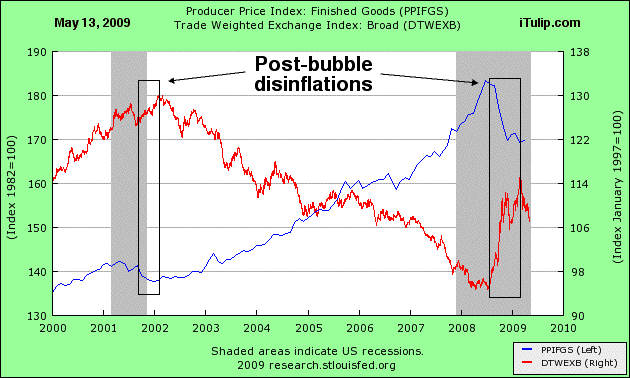
Post bubble disinflations
Post bubble disinflation: dollar rises, inflation falls, but not for long. The lastest disinflation has ended. Now comes inflation. But what kind? The kind produced by the kind of re-inflation the government is pursuing.
This latest financial system crash had the Bernanke Fed stomping both feet on the monetary gas pedal to rev up the sputtering credit-financed engine of the FIRE Economy, breaking age old barriers by cutting short term interest rates to zero, then pouring nitro and oxygen directly down the FIRE Economy’s intake manifold via “non traditional monetary tools.” The Fed took trillions of dollars in unmarketable commercial and investment bank assets, in simpler and more honest times called “bad debts,” onto its balance sheet, lent hundreds of billions through the discount window to banks run by hacks and miscreants, and launched a program of quantitative easing, the policy of issuing new fiat money without so much as a whiff of hope of redemption in debt issued by a bankrupt government.
This latest financial system crash had the Bernanke Fed stomping both feet on the monetary gas pedal to rev up the sputtering credit-financed engine of the FIRE Economy, breaking age old barriers by cutting short term interest rates to zero, then pouring nitro and oxygen directly down the FIRE Economy’s intake manifold via “non traditional monetary tools.” The Fed took trillions of dollars in unmarketable commercial and investment bank assets, in simpler and more honest times called “bad debts,” onto its balance sheet, lent hundreds of billions through the discount window to banks run by hacks and miscreants, and launched a program of quantitative easing, the policy of issuing new fiat money without so much as a whiff of hope of redemption in debt issued by a bankrupt government.
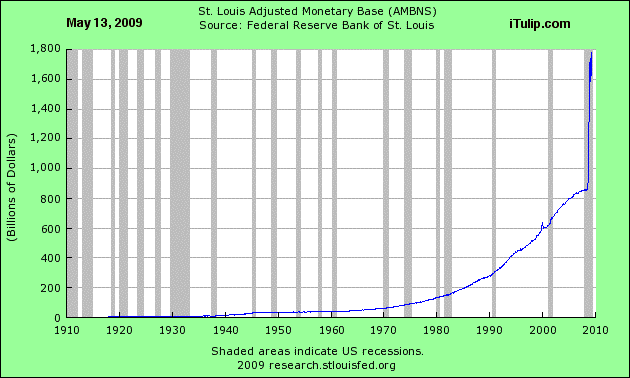
The Fed expanded the monetary base like crazy
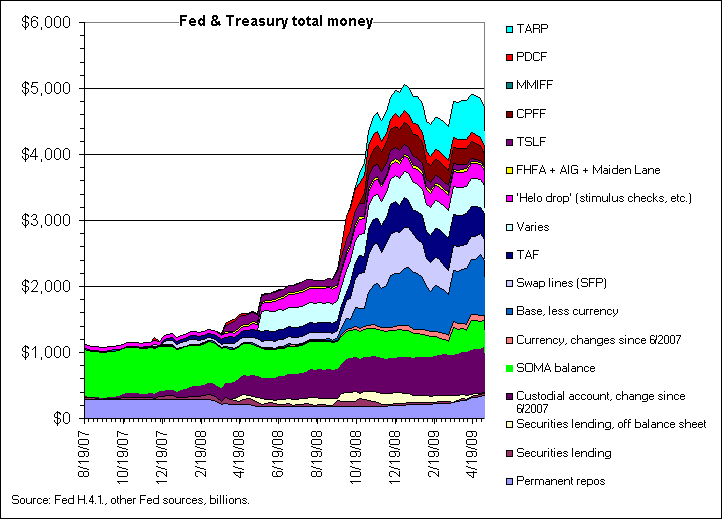
The Fed and Treasury issued new kinds of money, and lots of it
Source: Nowandfutures.com
“Other parts of government” cooperated with the Fed’s rabid re-inflation project by pumping nearly a trillion dollars into the economy via tax cuts and Congressman-ready deficit spending programs. Or is that “shovel-ready”? You need some kind of shovel to get through the tortured explanations of Fed and Treasury maneuverings of private debt to public account on behalf of campaign contributors.
We forecast in Road to Ruin, Final Stretch that the government’s April 2009 tax take for FY2008 will come in well below forecasts because income from capital gains from collapsing asset prices fell at the same time as incomes from rising unemployment.
We forecast in Road to Ruin, Final Stretch that the government’s April 2009 tax take for FY2008 will come in well below forecasts because income from capital gains from collapsing asset prices fell at the same time as incomes from rising unemployment.
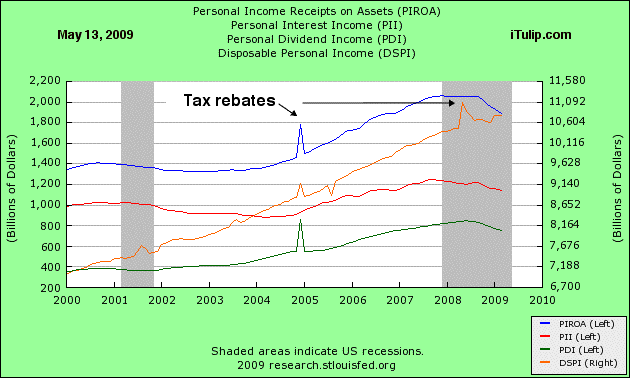
Personal income fell
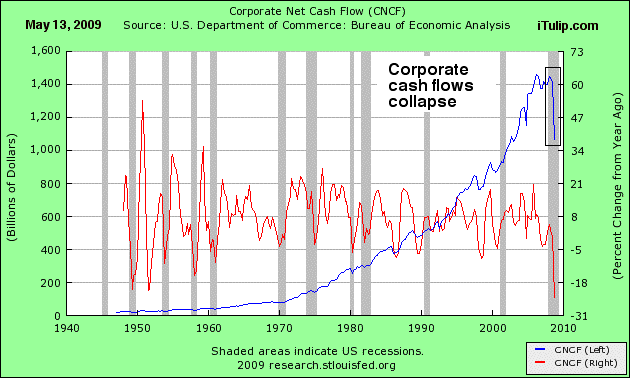
Corporate profits and cash flows collapsed
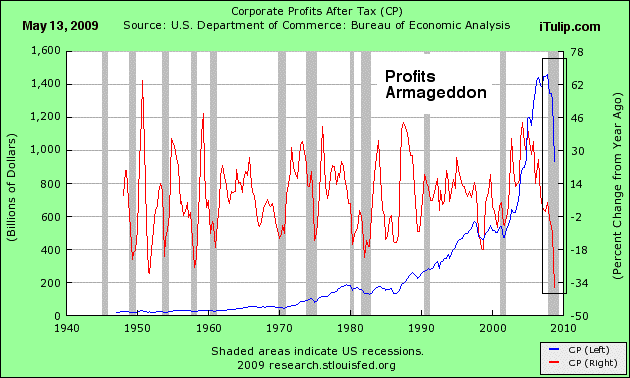
Falling personal income and corporate profits means less money to pay the taxman.
We forecast a fiscal deficit/GDP ratio above 10%. As usual, we were overly optimistic. The ratio will turn out to be well over 13% and perhaps as high as 15%, as Diapason Asset Management reports. (Hat tip to member LargoWinch)
We forecast a fiscal deficit/GDP ratio above 10%. As usual, we were overly optimistic. The ratio will turn out to be well over 13% and perhaps as high as 15%, as Diapason Asset Management reports. (Hat tip to member LargoWinch)
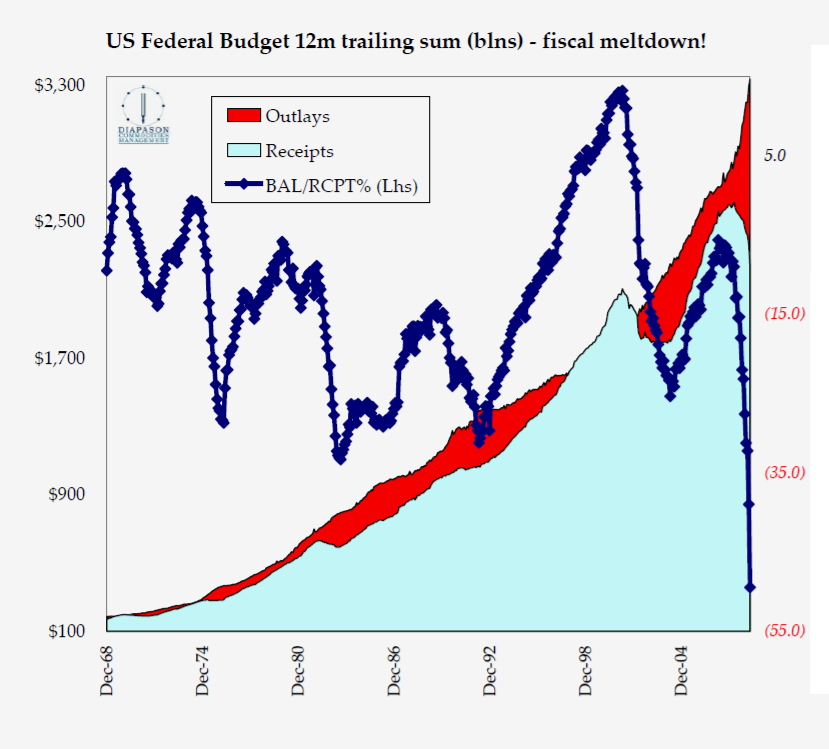
A 13% plus fiscal deficit to GDP ratio puts the U.S. in a league of its own, putting downward pressure on the dollar.
Deflation spiral nipped in the bud
So swift and extreme were the Fed’s printing and pumping operations that commodity prices barely registered half the price declines of the previous 2001 to 2002 disinflation cycle, despite a horrific demand crash that the FIRE Economy’s 2008 collapse produced.
Deflation spiral nipped in the bud
So swift and extreme were the Fed’s printing and pumping operations that commodity prices barely registered half the price declines of the previous 2001 to 2002 disinflation cycle, despite a horrific demand crash that the FIRE Economy’s 2008 collapse produced.
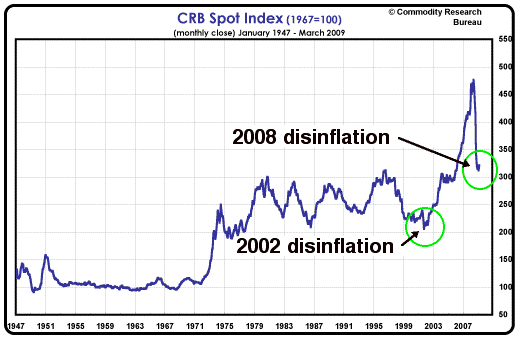
Deflation spiral fear mongers, who heckled us relentlessly since 2006, forecast collapsing commodity prices with apocalyptic flourish. Sell oil! Sell metals! Sell gold! The end is nigh!
Even those who bought our argument for inflation as the eventual outcome of the central banks’ debt deflation battle hid behind forecasts over the past year for gold to correct to $600 or even $400 before rising again. These equivocal forecasts, while well meaning, caused investors to wait for a bottom-picking gold price correction that never came. Well-intentioned warnings that gold prices do correct 20% or more in the deflationary down drafts caused by normal economic corrections don’t fly in the kind of bull market in government folly that we are in today, that only occur once in a generation.
Even those who bought our argument for inflation as the eventual outcome of the central banks’ debt deflation battle hid behind forecasts over the past year for gold to correct to $600 or even $400 before rising again. These equivocal forecasts, while well meaning, caused investors to wait for a bottom-picking gold price correction that never came. Well-intentioned warnings that gold prices do correct 20% or more in the deflationary down drafts caused by normal economic corrections don’t fly in the kind of bull market in government folly that we are in today, that only occur once in a generation.
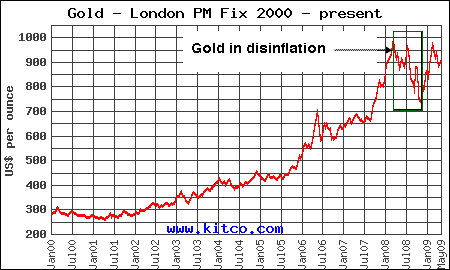
Not only is the 28 year old FIRE Economy collapsing, the entire premise of more than 60 years of central banking has been called into question. Pity the average hard working American whose misguided faith in American market regulatory institutions cost them their retirement savings in the stock and housing markets. They ought to have at least some exposure to gold to hedge their remaining wealth against future losses created by the most concerted effort by government in history to wreck a great nation’s sovereign credit and currency. Hinting they should wait for a drastically cheaper price was unkind.
Yes, the end was nigh in late 2008—the end of deflation, that is. No $400 gold or $20 oil as in 2002, even though this time around after the largest credit bubble in history collapsed global demand for commodities, unlike 2002. Commodities prices crashed, but recently they stopped falling, coincident with a lot of other changes. We think it’s because Bernanke in fact didn’t let “it” happen.
Yes, the end was nigh in late 2008—the end of deflation, that is. No $400 gold or $20 oil as in 2002, even though this time around after the largest credit bubble in history collapsed global demand for commodities, unlike 2002. Commodities prices crashed, but recently they stopped falling, coincident with a lot of other changes. We think it’s because Bernanke in fact didn’t let “it” happen.
Note the strong positive correlation today even among commodity indexes that are not normally correlated. What are they all correlating to now?
Disinflation, bonds, and the dollar
Treasury bond prices leapt to 40-year highs as the global financial system caved in in 2008 as the flight to safety instinct sent investors after U.S. government debt like reanimated zombies staggering back to the mall after a virus ate their brains. They clawed at the doors to the U.S. Treasury growling, “Dollars.... Dollars... We want dollars...”
Misguided deflation spiral believers misread the impulse of investors’ reptilian brains, and the carefully carved by the Fed yield curve, and a short-term spike in the dollar all together as confirmation of a deflation spiral. They extrapolated a few months’ data to decades of slow growth and low inflation as Japan experienced from 1992 until today, and will continue to suffer until, eventually, the yen collapses.
Soon enough—current course and speed—U.S. Treasury bonds and the currency in which they are denominated will register the full extent of the Fed’s and Treasury’s mad experiment to rescue the doomed FIRE Economy.
Around the same time that commodity prices stopped falling, the long Treasury bond yields began to rise. Meanwhile, trillions were poured into the U.S. agency-debt based mortgage market to hold down mortgage rates. The result, long term Treasury bond yields headed temporarily in opposite direction as 30-year mortgage rates. We have a pretty good idea which one of the two will change direction to re-correlate and bet you do, too.
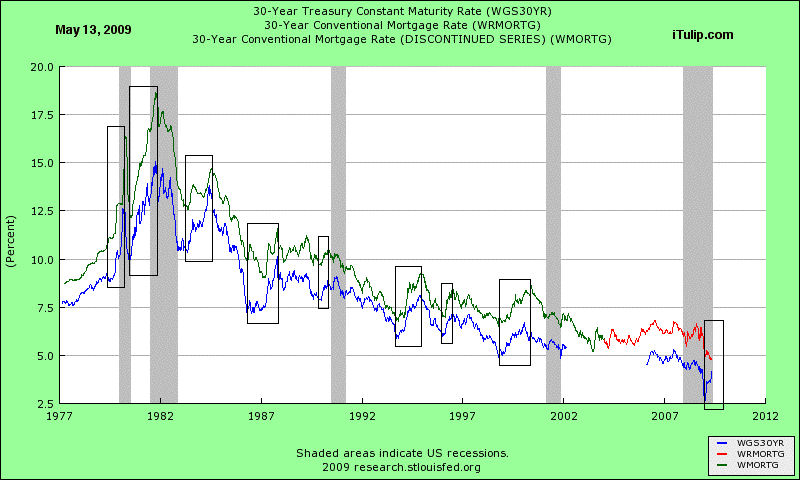
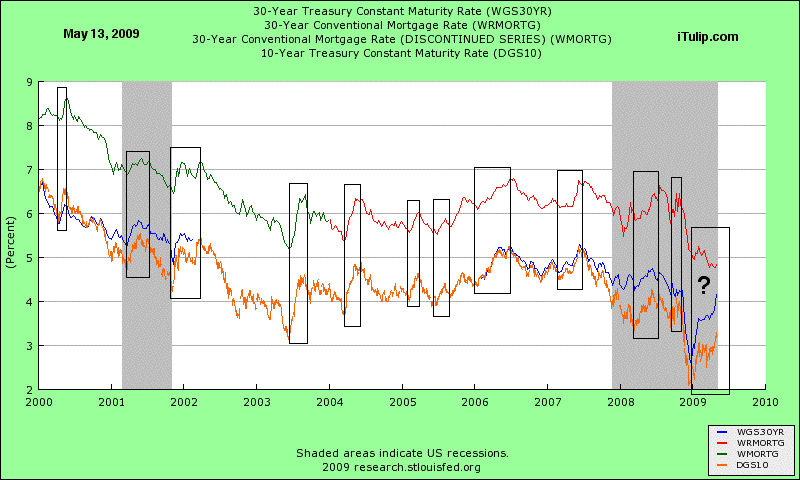
In the first quarter of 2009 the foundation of the FIRE Economy, the U.S. housing market, lay damp and smoldering despite the government pouring on every monetary accelerant imaginable, and applying a quantitative easing flame-thrower for good measure. It refused to relight. The 10-year bond measures the conviction of the Fed to hold the benchmark rate low enough to keep the Treasury Department’s bastard child, the 95% government financed mortgage market, from going out completely.
The $45 trillion gamble
The non-agency market for mortgages remains “dead,” in the words of George Soros’ business partner Alan L. Boyce. (Hat tip to iTulip’s John Serrapere.)
The $45 trillion gamble
The non-agency market for mortgages remains “dead,” in the words of George Soros’ business partner Alan L. Boyce. (Hat tip to iTulip’s John Serrapere.)
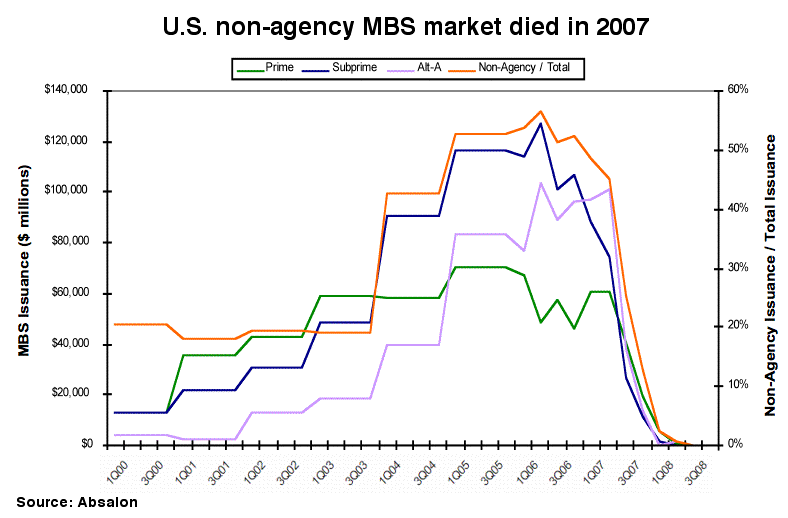
Boyce, at a meeting put on by the FDIC in NYC to a passel of U.S. housing market stake-holders, from Bank of America, Capital One, American Express, Citigroup, J.P. Morgan Chase to Chinese sovereign wealth funds, presented “Alternate Model for Mortgage Backed Securities.”
There is virtually no private market for mortgage-backed securities in the U.S. today. Boyce says:
But will the debt be written off? Not likely. Instead, the insanity of trying to manipulate housing prices back up to bubble price levels by fixing interest rates will continue.
If the nation’s mortgage debt is now 95% government backed, how much mortgage debt is that exactly? Here Boyce explains.
There is virtually no private market for mortgage-backed securities in the U.S. today. Boyce says:
The old system is GONE, not to come back anytime soon
He describes the problem with housing market as follows.- Over 95% of new mortgages in past six months are government guaranteed
- Fannie and Freddie are de facto nationalized
We are in the midst of the bursting of several related bubbles
He proposes as the basis of a solution:- The epicenter of the crisis is the complex and poorly financed US housing market
- The ripple effects will continue to spread until the original problem is resolved
- The risks from rising interest rates is poorly understood and dangerous
Comprehensive mortgage reform is required, with four key elements:
We disagree. The problem with the housing market is not that housing prices are falling. That’s what markets do to over-priced assets. The problem is not that interest rates are too high. If anything they are too low, and anyway we cannot get them lower without pouring even more good money after bad. The problem is that total mortgage debt payments are too high relative to corporate cash flows of the businesses that pay the salaries of mortgage borrowers. High debt levels are an artifact of mortgages taken out and refinancing done during the 2002 to 2006 housing bubble period. Debt levels must be brought down to post housing bubble housing price levels. All attempts to lower mortgage debt payments will cause side effects that are worse than the illness they are meant to cure. Adding liquidity to lower interest rates will create new bubbles. Instead, mortgage debt must be written off. - Reducing interest rates for ALL mortgage borrowers
- Directly reducing the number of homes with negative equity
- Introducing a transparent new mortgage system that properly aligns incentives
- Building counter-cyclicality into financial products before it is too late
But will the debt be written off? Not likely. Instead, the insanity of trying to manipulate housing prices back up to bubble price levels by fixing interest rates will continue.
If the nation’s mortgage debt is now 95% government backed, how much mortgage debt is that exactly? Here Boyce explains.
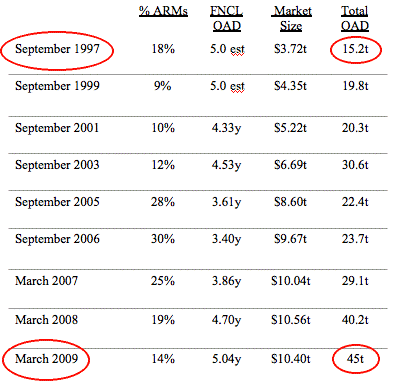
You read that right. That’s a $45 trillion mortgage liability to U.S. banks that the Fed has backstopped, up from $15.1 only 12 years ago.
Markets up? What markets?
How does one invest in financial markets of a finance-based economy that’s running government money? This financial reporter at the Wall Street Journal gets it.
After each period of disinflation, as the post-bubble re-inflation stimulus kicks in a chorus of “Recovery! Recovery! Recovery!” arises from sea to shining sea--as if money injected into an economy by government is like money generated by profitable economic activity in honest markets.
Economic reflation—monetary stimulus and fiscal spending—without economic restructuring is proven disaster. In 1929 the U.S. had an industrial economy with GDP 75% driven by consumer spending, even more than today. By the end of 1933, unemployment stood at 25%, bank credit was off by 40%, and inflation had fallen 26%. Now that’s deflation. Between 1934 and 1936 the first Keynesian experiment in substituting government for private sector spending to stimulate demand was tried on a live patient: the U.S. economy. It was already dead, so why not? Besides, the process was working well for Nazi Germany.
After depreciating the dollar and running large deficits the economy “recovered” except when it fell back into depression in 1937 after the government money spigot was tightened following the 1936 mid-term elections. It only recovered—green shoots growing into trees—after the ultimate industrial demand booster came in the form of WWII.
Markets up? What markets?
How does one invest in financial markets of a finance-based economy that’s running government money? This financial reporter at the Wall Street Journal gets it.
Government Holds Strings to Markets
May 11, 2009 (Wall Street Journal – Mark Gongloff)
For all of the excitement about improving financial markets, most are still on some form of government life support and the evidence so far is they can't yet function normally on their own.
Last fall, markets froze and interest rates soared as investors dumped stocks and corporate bonds and banks cut back on lending to their customers and to each other. In response, the Federal Reserve sharply cut interest rates and established a Scrabble game's worth of acronymic lending and insurance programs to reassure investors and jump-start markets.
Those programs have helped return markets to near normal. Lending has resumed, and many key rates are back to where they were before the peak of the crisis. But in cases where the government has pulled back its support, markets have trembled. Given that history, officials will likely err on the side of intervening too much and for too long.
"When the recovery is self-reinforcing and cash flow is picking up for companies and banks, then financial assets will grow on their own without any need for government involvement," says Tony Crescenzi, chief bond strategist at Miller Tabak. "We are nowhere near that self-reinforcing state."
In one sign of lingering credit-market anxiety, interest rates not under direct Fed control -- corporate bonds, for example -- haven't fallen as sharply as overnight lending rates, over which the Fed has the greatest power.
Ghastly green shoots May 11, 2009 (Wall Street Journal – Mark Gongloff)
For all of the excitement about improving financial markets, most are still on some form of government life support and the evidence so far is they can't yet function normally on their own.
Last fall, markets froze and interest rates soared as investors dumped stocks and corporate bonds and banks cut back on lending to their customers and to each other. In response, the Federal Reserve sharply cut interest rates and established a Scrabble game's worth of acronymic lending and insurance programs to reassure investors and jump-start markets.
Those programs have helped return markets to near normal. Lending has resumed, and many key rates are back to where they were before the peak of the crisis. But in cases where the government has pulled back its support, markets have trembled. Given that history, officials will likely err on the side of intervening too much and for too long.
"When the recovery is self-reinforcing and cash flow is picking up for companies and banks, then financial assets will grow on their own without any need for government involvement," says Tony Crescenzi, chief bond strategist at Miller Tabak. "We are nowhere near that self-reinforcing state."
In one sign of lingering credit-market anxiety, interest rates not under direct Fed control -- corporate bonds, for example -- haven't fallen as sharply as overnight lending rates, over which the Fed has the greatest power.
After each period of disinflation, as the post-bubble re-inflation stimulus kicks in a chorus of “Recovery! Recovery! Recovery!” arises from sea to shining sea--as if money injected into an economy by government is like money generated by profitable economic activity in honest markets.
Economic reflation—monetary stimulus and fiscal spending—without economic restructuring is proven disaster. In 1929 the U.S. had an industrial economy with GDP 75% driven by consumer spending, even more than today. By the end of 1933, unemployment stood at 25%, bank credit was off by 40%, and inflation had fallen 26%. Now that’s deflation. Between 1934 and 1936 the first Keynesian experiment in substituting government for private sector spending to stimulate demand was tried on a live patient: the U.S. economy. It was already dead, so why not? Besides, the process was working well for Nazi Germany.
After depreciating the dollar and running large deficits the economy “recovered” except when it fell back into depression in 1937 after the government money spigot was tightened following the 1936 mid-term elections. It only recovered—green shoots growing into trees—after the ultimate industrial demand booster came in the form of WWII.
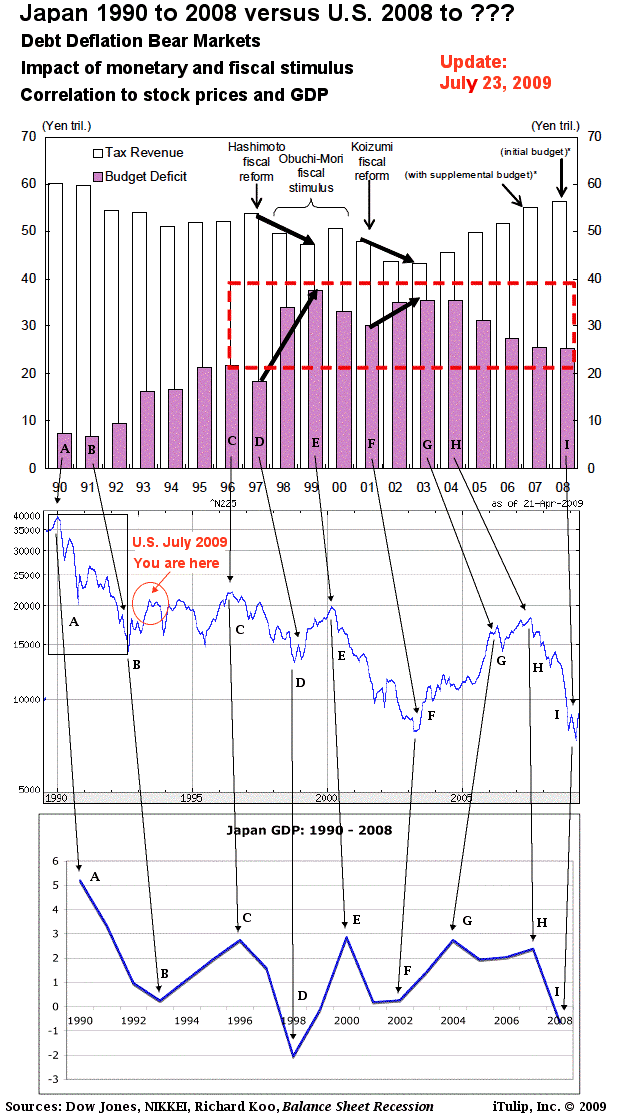
The Nikkei registers cycles of government financed economic growth. The economy never catches, while deficits grow and grow.
Another horror awaiting the U.S. economy if it fails to restructure its debts is a return to a negative falling household savings rate. During asset price inflations, households stop engaging in traditional forms of saving and allow asset price inflation to do the saving for them, and they take on debt which is measured as dissaving. After the asset bubble pops, households briefly increase savings as they pay down debt, as is occurring in the U.S. today, but soon enough they are back to dissaving but because they are broke.
Another horror awaiting the U.S. economy if it fails to restructure its debts is a return to a negative falling household savings rate. During asset price inflations, households stop engaging in traditional forms of saving and allow asset price inflation to do the saving for them, and they take on debt which is measured as dissaving. After the asset bubble pops, households briefly increase savings as they pay down debt, as is occurring in the U.S. today, but soon enough they are back to dissaving but because they are broke.
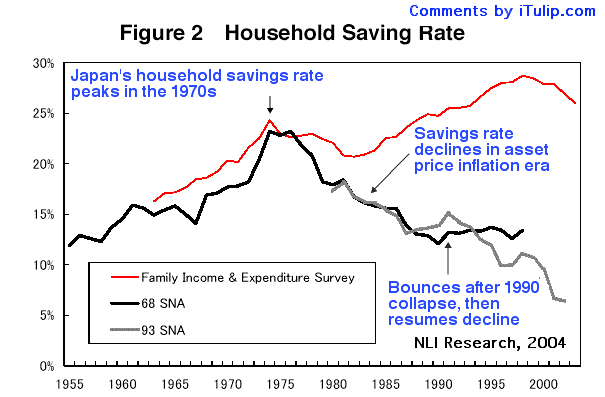
The fallacy of the high saving Japanese household is dispelled by this data from the bank of Japan in a paper by NLI Research.
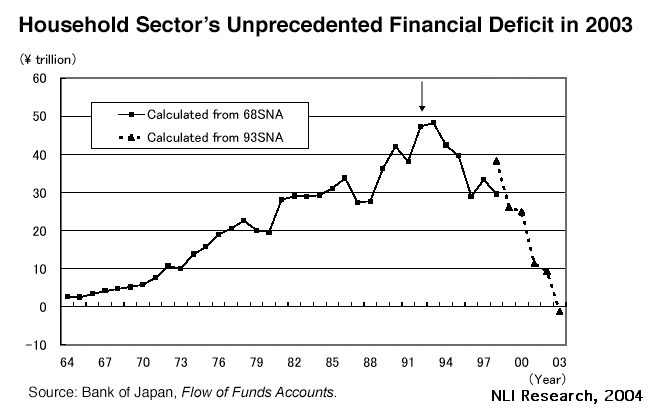
The Japanese have been at the deficit spending without restructuring game for nearly 20 years. Each time the government money ran out or a more fiscally conservative government was elected to reduce public spending, the economy sank back into recession. Japan’s public debt today is 195% of GDP, better than Zimbabwe but worse than Jamaica.
But the U.S. 1934 and Japan 1992 are best-case scenarios for using monetary and fiscal stimulus to fight debt deflation. The U.S. doesn’t have an industrial economy as in the 1930s or Japan has today, nor does it have a growing global economy to export to as Japan has had since 1992. Since the early 1980s the U.S. economy became dominated by the finance, insurance, and real estate industries, a FIRE Economy. When government pours money into a FIRE Economy new asset bubbles and further crowding out of productive industries results. Each cycle of asset bubble crash and re-inflation produces a more perverse and bizarre economic relationship between finance and production.
Next bubbles
In The Next Bubble published in February 2008 I hypothesized a next bubble in energy and infrastructure once the government succeeded in re-inflating the U.S. economy out of the collapse of the housing and other 2002 to 2008 bubbles. The article was written mid-2007, back when a forecast of recession resulting from a collapse of the housing bubble was far-fetched. The idea that such a recession might be serious enough to require New Deal style government spending programs was considered off the wall. A specific forecast of energy and infrastructure as the focus for government spending to tackle a depression resulting from the collapse of the FIRE Economy elicited derision from more than one reviewer. Yet here we are.
Will the Fed's reflation produce a "next bubble"? A brief review of the previous re-inflation will help answer that question.
Last time we saw this movie was in 2002. The script went like this. The Fed denied the existence of a bubble, asserting bubbles are identifiable only after the fact. Next, the bubble collapsed. Then the Fed denied the collapse will cause an economic recession. Next, a recession occurred but was not acknowledged until after it was a year old. Then the Fed cried “Deflation! Deflation! Deflation” while pumping money out like there was no tomorrow. A few analysts fell for it and went along with the ruse.
The Fed then crammed short-term interest rates down to 1%. LIBOR—known affectionately in the hedge fund community as LIE-BOR for the dubious accuracy of the interest rate data its contributors volunteer—fell to 2.5%. Teaser rates on ARMs fell to 3.5%, fueling the historic last leg of the housing bubble from 2002 to 2006 as too much credit chased too few houses and condos.
Housing asset price inflation made Americans feel rich again and also let them borrow against their homes to consume. This kept personal consumption expenditures (PCE) from falling even though capital spending did. The excess credit fueled housing asset price inflation and financed consumption without inflation spilling over into commodity prices. The Fed’s actions neatly channeled new credit-money channel asset price inflation without producing commodity price inflation. Greenspan thought his place in history as a central banking genius was assured.
Inflation beyond asset prices came only much later when the dollar fell as global markets discounted the future purchasing power of the currency of the world’s most indebted country. U.S. policy makers welcomed the weak dollar as it drove GDP from exports to nearly 20% of GDP, assisting the recovery. U.S. trade partners tolerated the weak dollar for a few years but it also drove up global energy prices. After a few years of this, energy, an input cost into almost every economic activity, fed a cost-push commodity price inflation that peaked in 2008 with hedge fund money piling on at the end, driving oil from $100 to nearly $150.
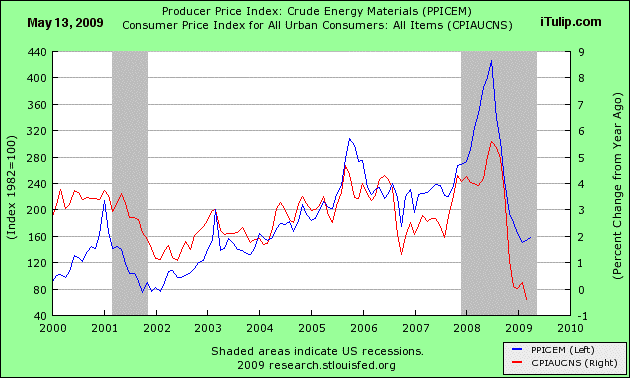
Consumer price inflation lags energy prices by six to 12 months
By late 2007 the S&P hit 1570, regaining its nominal losses from the 2000 to 2002 crash that sent the index tumbling from 1520 to 835. But significant energy cost push inflation produced by the weak dollar caused the S&P to fall in real terms even if it beat its old nominal high. Gold investors fared much better with nominal prices rising nearly four times versus two times for stocks, from $260 to over $1000 over the same period, beating inflation.
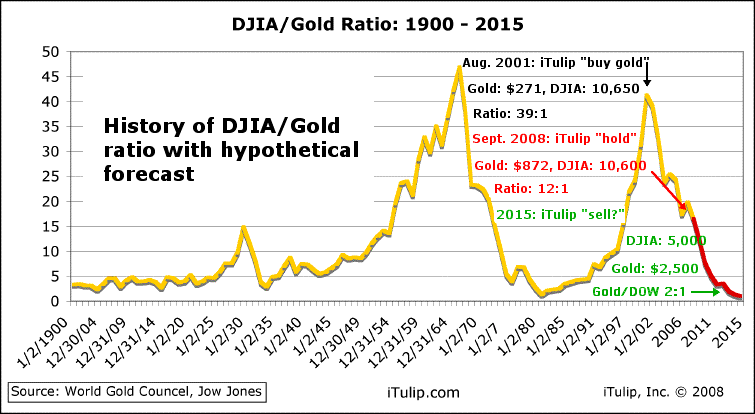
Most stock market investors didn’t notice that they were getting nowhere in the so-called stealth bear market of 2002 to 2008. The NASDAQ bear market was decidedly less stealthy; ground zero for the 1996 to 2000 technology stock bubble, the once bubbly tech stock index still trades 80% in real terms below its peak nine years ago. Back in 2004 we forecast that 10 to 15 years after the peak of the housing bubble the housing market will be in a similarly awful condition as the NASDAQ is today. We stand by that forecast.
As the flood of liquidity pushed interest rates down, global investors desperate for yield net of energy cost-push inflation piled into anything that moved more than a few basis points over the true versus official inflation rate. In his April 2007 newsletter, Jeremy Grantham offered up a gnarly looking inverted risk curve and coined the phrase “bubbles in everything.” The entire perverse, liquidity driven inverted risk pyramid collapsed starting with securitized mortgage debt market in Q1 2007. Debt deflation via loan defaults and asset liquidation was in full swing by early 2008.
What’s different this time compared to the last re-inflation cycle?
The most critical difference between now and 2002 is that U.S. trade partners are in better shape for recovery now than they were then and the U.S. is in decidedly worse shape. The greatest risk facing the U.S. today is that deficit spending consumes the nation's credit in a failed effort to restart the FIRE Economy.
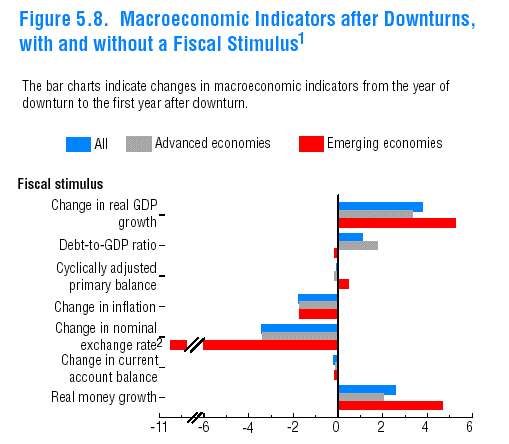
A recent IMF study shows that 18 months to two years after the fiscal expansion is applied to an economy, if combined with monetary stimulus, on average inflation will rise by 2.5%.
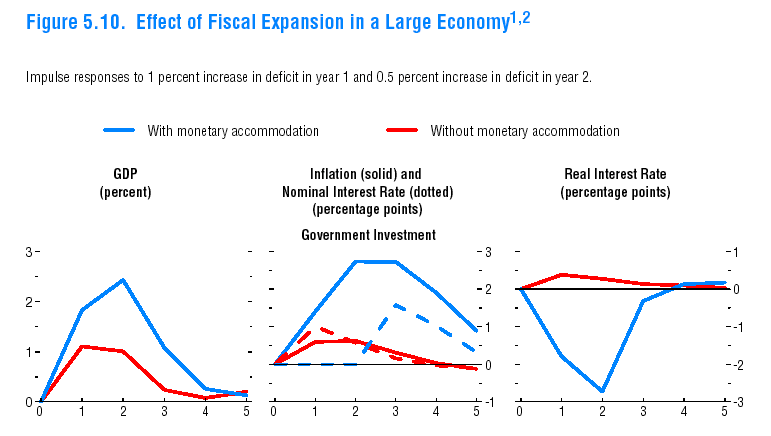
Said stimulus can also be expected to have a negative impact on the exchange rate value of the dollar.
 |
Following the collapse of the credit bubble, the brief period of deflation that we call disinflation has ended. Fed Chairman Ben Bernanke succeeded in his bid to prevent debt deflation from developing into a macro-economic price deflation spiral. The ongoing effort to prevent debt deflation via debt monetization will cause commodity price inflation through several channels that we identified in Everyone is wrong, again – 1981 in Reverse Part II: Nine Signs of Inflation. Five of these inflationary factors are the most relevant for near term inflation:
- Credit crunch induced supply shock
- Weakening dollar and cost-push inflation from energy imports
- Inflationary impact of excessive money growth
- Inflationary institutional policy bias
- Bankruptcies induced industrial concentration
Result: Rising PPI by Q3 2009 and rising CPI by Q4 2009 but no later than Q1 2010.
When and how will the monetary and fiscal re-inflation show up as inflation? How will the housing, stock, commodity, and bond prices be affected? We review the likely after effects of re-inflation one asset class at a time to develop an new investment thesis for our new post-bubble world where government heavily influence economies and asset prices. Our interest is not in trading but in making investment decisions we can stick with for a decade or more, as with our move out of stocks and into U.S. Treasury bonds in 2000 and into gold in 2001. more... ($ubscription)
See also:
Re-inflation Rally Part I: Falsehoods, fantasies, fabrications, and fake-outs - Eric Janszen
Re-inflation rally Part II: Prospects for self-sustained economic growth - Eric Janszen
Everyone is wrong, again – 1981 in Reverse Part I: The Great Divide – Eric Janszen
Everyone is wrong, again – 1981 in Reverse Part II: Nine Signs of Inflation – Eric Janszen
iTulip Select: The Investment Thesis for the Next Cycle™
__________________________________________________
To receive the iTulip Newsletter or iTulip Alerts, Join our FREE Email Mailing List
Copyright © iTulip, Inc. 1998 - 2007 All Rights Reserved
All information provided "as is" for informational purposes only, not intended for trading purposes or advice. Nothing appearing on this website should be considered a recommendation to buy or to sell any security or related financial instrument. iTulip, Inc. is not liable for any informational errors, incompleteness, or delays, or for any actions taken in reliance on information contained herein. Full Disclaimer


Comment