Essential Trends - Part II-A: The End of Engineered Stagflation

• Why did stocks markets plummet more last week than during any Thanksgiving week since 1942?
• Why are oil prices rising as the global economy slows?
• Why did global central banks buy more gold in Q3 than any period since the collapse of Bretton Woods in 1971?
Last week of the Bureau of Economic Analysis released revised U.S. GDP numbers for 2011. They reveal a U.S. economy destined for a new recession before the economy recovers from the last one, a mid-gap recession in iTulip terminology.
That hasn't happened since 1938.
Yet price inflation is rising across the board, even in goods like apparel and autos. Inflation indexes for these items have remained flat or declined since the early 1990s due to increased mechanization of production and foreign competition with low wage rate countries. Now they are rising as a direct result of the Fed's failed Print and Pray policies aimed at reflating home prices and the Treasury's unofficial Weak Dollar policy that creates cost-push inflation via rising import prices. The price of a car in the U.S. has gone up more over the past two quarters than at any time since the early 1970s, even though units sales of autos, hammered by the recession, remains depressed at early 1980s unit sales volumes.
As the prices of goods and services rise in a weak labor market, real wages fall. The broadest index of wage costs printed a -1.5% real decline in October, as the U.S. economy remains stubbornly stuck in an output gap of 7% of GDP where it landed in early 2009. Two and a half years and trillions of stimulus and bailouts and QEs later, the gap is still 7%. We got nowhere.
The American Financial Crisis of 2008 that led to The Great Recession resulted from a collision of the first Peak Cheap Oil Cycle with a 30-year-old credit bubble as it reached peak risk and hubris in late 2007 with over a trillion in excess mortgage credit financed with bogus asset-backed securities, now on the Fed's books. The next U.S. economic crisis will also be triggered by an oil price related external event. Current course and speed, our staggering economy, barely maintaining forward momentum, stuck in an Output Gap Trap smaller but no less inescapable than in the 1930s, will trip over a spike in oil prices, sending the economy back into recession in 2012.
The reason for the oil spike: the inexorable escalation of Syria's civil crisis into civil war and regional conflict.
Two previously identified crises outside America's boarders that present risks to the weakened U.S. economy are the collapse of China's property bubble and Europe's sovereign debt quagmire. But these are likely to deescalate next year, at least they will take a back seat to oil.
China is in the midst of the credit bubble collapse crisis we forecast a year ago when the People's Bank of China began a program of rate hikes intended to create a soft landing for the nation's property bubble. We predicted a crash by Q3 2011. We also forecast massive and immediate fiscal and monetary reflation by the People's Bank of China and the legislature leaving no opportunity to short the event, even if we did get the timing right. China's uniquely mercantile, centrally planned FIRE Economy will once again come through with the necessary financing to keep the game going, as it has for 35 years, to maintain continuous growth, to justify unelected rule, much to the benefit of commodity exporting countries around the world. Tip for Jim Chanos: Never short China's Great Wall of Money. It's even more hazardous than shorting U.S. Treasury bonds.
The imminent demise of the euro has been widely forecast for more than two years since the euro crisis started with the not so surprising announcement by Greece's new socialist government in November 2009 that the previous administration had been lying about the nation's budget deficit. But reversion to national currencies is not an option for euro zone countries. They locked themselves in a monetary cage and threw away the key a decade ago. They have no choice but to clean up the mess they've made inside it since then. We are betting they will, eventually, but it will be a long and painful process. Europe, forced forward toward greater federalization by the prospect of a collapse of the euro and economic calamity will instead choose fiscal integration and, later, the implementation of an integrated tax and fiscal policy authority. The cost of the alternative -- a collapse of the euro and a total loss on euro bond debts of debtor nations in the zone -- is higher. They will choose the cheaper route, but they will take it in fits and starts.
U.S. re-entry into recession in 2012 is inevitable, followed by a new round of economic stimulus via deficit spending. Meanwhile, oil prices will spike as high or higher than in 2008, as regional instability in the Middle East worsens the stagflation that the Fed has engineered as its answer to preventing another Great Depression with Print and Pray.
How can the U.S. use this new crisis to escape its Output Gap Trap? I argue that the U.S. will over the next two to three years undertake a bold program of new infrastructure development in response to a new energy crisis arising from a regional conflict in the Middle East. The political attitude toward inflation will shift to a level of tolerance of inflation reserved for wartime. New Energy Crisis economic policy will replace the policy of Print and Pray in place since early 2009 to produce an output surplus that finally closes the output gap created by The Great Recession.
We begin our investigation close to home.
The American Output Gap Trap
You wouldn't know the U.S. economy was still in trouble by reading this year's holiday season shopping news. Black Friday retails sales jumped 26% year over year, the reports note optimistically.
Let's put the news in context.
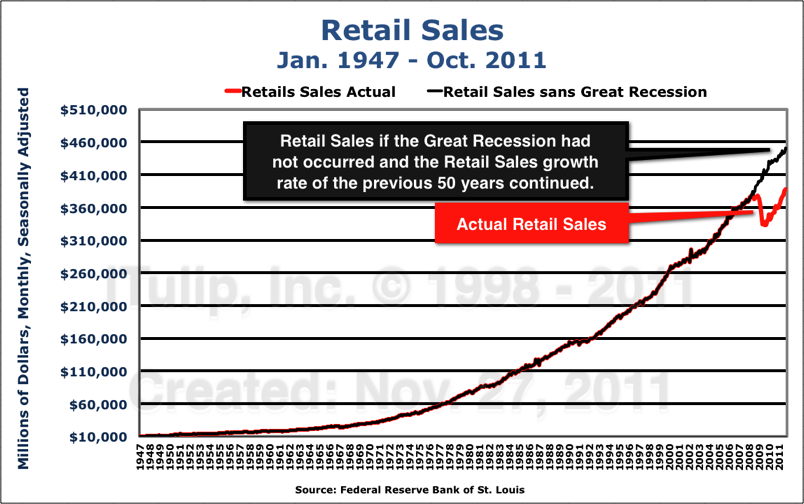
Retails sales on the Black Friday weekend are up 26% from last year, logging $52.4 billion during the four-day weekend,
up from $45 billion last year, the National Retail Federation says. But that $7.4 billion of year-over-year growth
won't make up for the $62 billion in potential retail sales lost to The Great Recession.
It will take more than a weekend spending binge to close an epic output gap.
Our Output Gap Trap charts put the latest GDP news into context. First, a restatement of the theory.
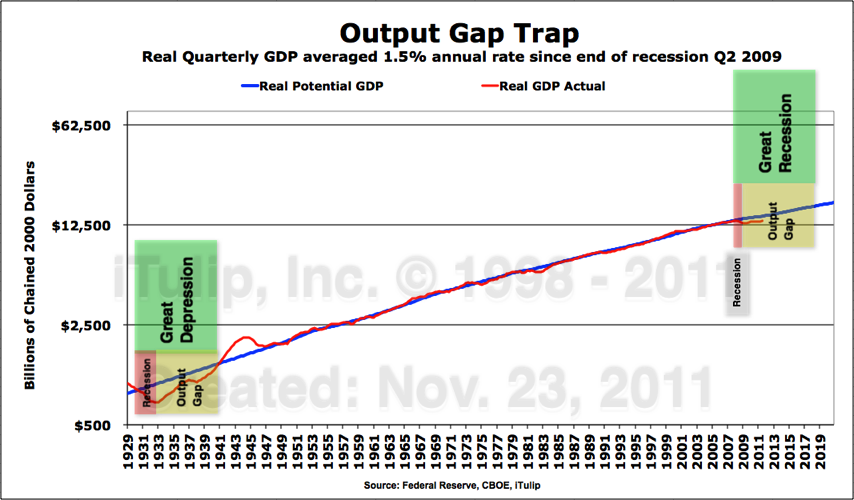
Deep Recession + Persistent Output Gap = Depression (Log scale base 5 shows relative severity)
The current depression is a milder version of the 1930s, but shares a similarity of dynamics.
Note gigantic output surplus during WWII after The Great Depression.
A large and persistent output gap creates long-term unemployment.
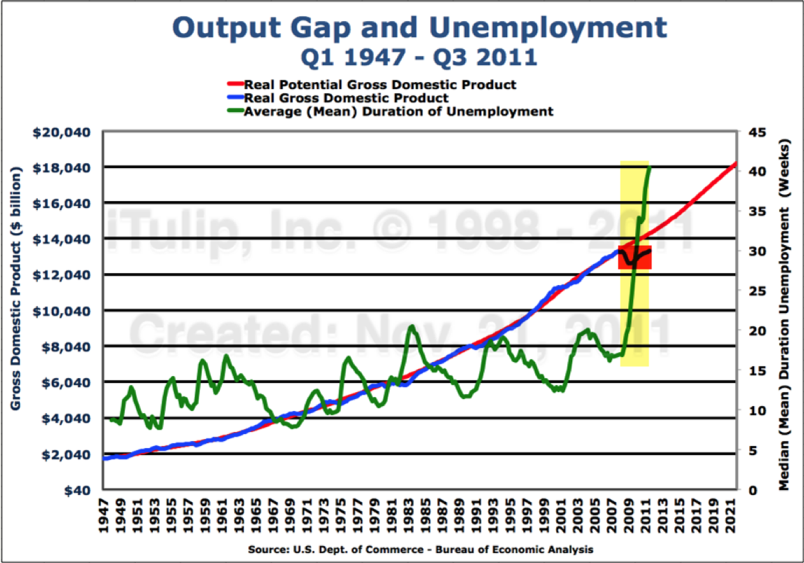
The bigger the output gap, the worst long-term unemployment gets.
Have we made any progress out of our Output Gap Trap since Q2 2009 when the recession officially ended? Unfortunately, not.
The next chart is from our previous July 2011 Output Gap Trap update with quarterly GDP data as reported then for Q1 and Q2 2011.
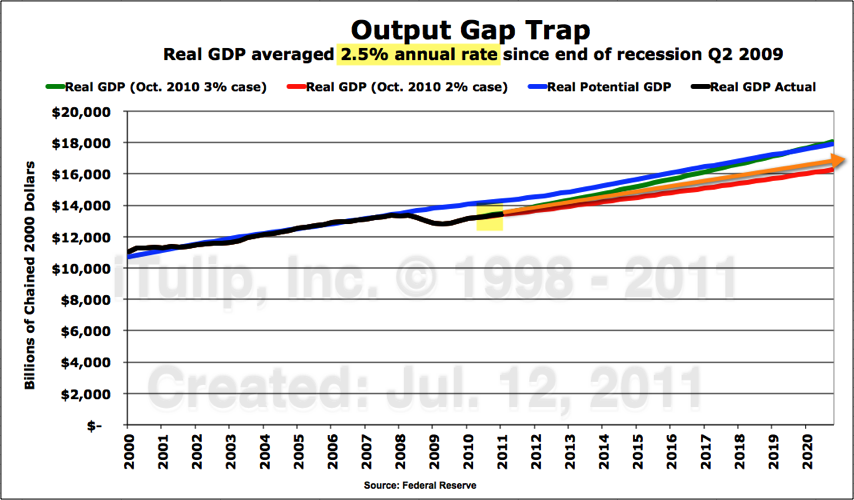
Using GDP data from the BEA in July 2011, growth since the end of the recession averaged 2.5% (orange arrow).
The chart shows that at a 3% growth rate the output gap will close by 2019, assuming no recessions occur before then. At a 2% growth rate the gap will never close. The actual 2.5% rate as of July 2011 put economic growth on parallel track to potential output, albeit lower. Call it a "New Normal" if you like. But the latest data show that even the New Normal is not holding.
Here is the same chart updated with last week’s revisions to Q1 and Q2 data and new Q3 GDP data. Yellow highlights the range of data that the BEA revised.
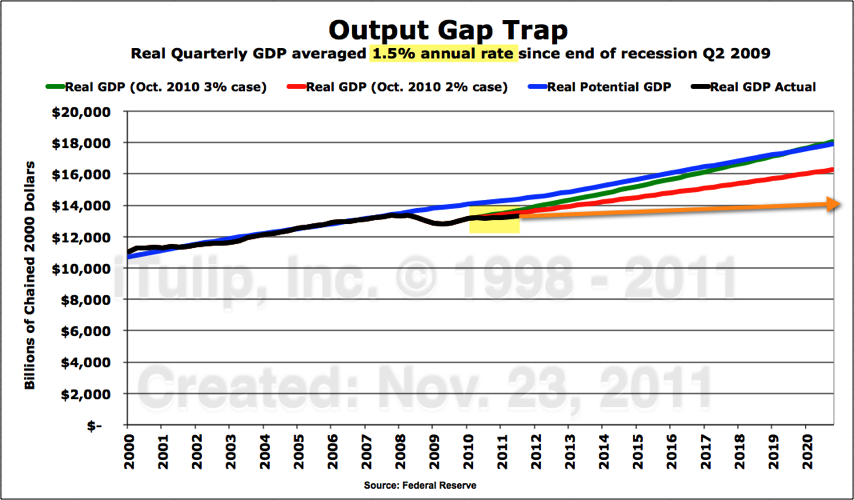
Average annual economic growth since the end of the recession revised from 2.5% to 1.5% (orange arrow).
With this new data, we see the average annual growth rate since the end of the recession has been cut from 2.5% to 1.5%. The output gap remains stuck at around 7% of GDP with no improvement after two years of fiscal and monetary stimulus.
According to standard economic theory, a persistent output gap is supposed to produce deflation because a weak labor market weighs on demand. But U.S. economic policy makers have engineered stagflation instead, as I predicted they would in my book The Postcatastrophe Economy: Rebuilding America and Avoiding the Next Bubble .
.
In this analysis, we found price inflation across the board, even in goods that we think of as cheap. For example, apparel.
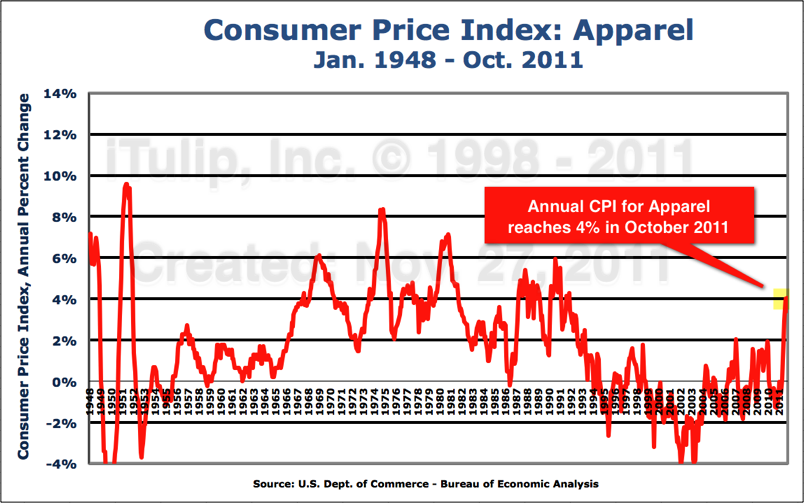
The primary tool of inflation creation since early 2009 has been dollar depreciation, as predicted here in 2007; the Fed and Treasury were to choose the Foolproof Way out of deflation in the form of a weak dollar policy. The mechanism is cost-push inflation from imports that produces an out-sized impact on prices in the domestic economy.
It worked. As the chart below shows, a two year, 7% of GDP output gap has not kept inflation from rising beyond the Fed's 2% target zone.
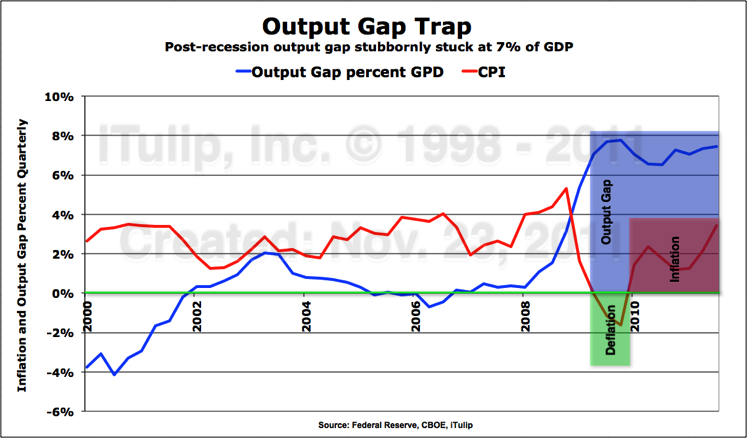
Output Gap + Inflation = Stagflation
Print and Pray is a policy choice: for an over-indebted economy, a modicum of nominal growth with moderate inflation is better than zero or negative nominal growth and no inflation.
Japan's bouts of deflation since the mid 1990s have been blamed on the series of output gaps that Japan has gone through since 1993. The Japanese economy has escaped only twice since then: from 1996 to 1997 and briefly in 2007. Japan is unable to use currency depreciation to promote inflation, for reasons we won't go into here that have to do with the net negative impact of such a policy for country like Japan that runs a current account surplus; currency depreciation is self-defeating.
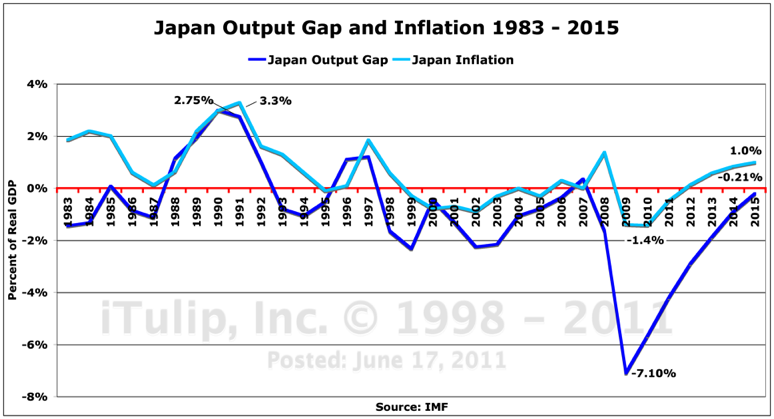
Output Gaps and inflation in Japan, 1983 to 2015 -- as optimistically projected by the IMF in 2011.
The worst case scenario was The Great Depression when massive output gaps produced a deflation spiral. Deflation reached double digits in some quarters in the early 1930s. WWII launched the U.S. back out of its Output Gap Trap in 1939 with a gigantic 34% of GDP output surplus and high inflation. Three smaller output surplus periods between 1965 and 1980 produced The Great Inflation that peaked in 1980. We'll go into the history of output gaps and surpluses, inflation, and deficits and the implications in Part II.
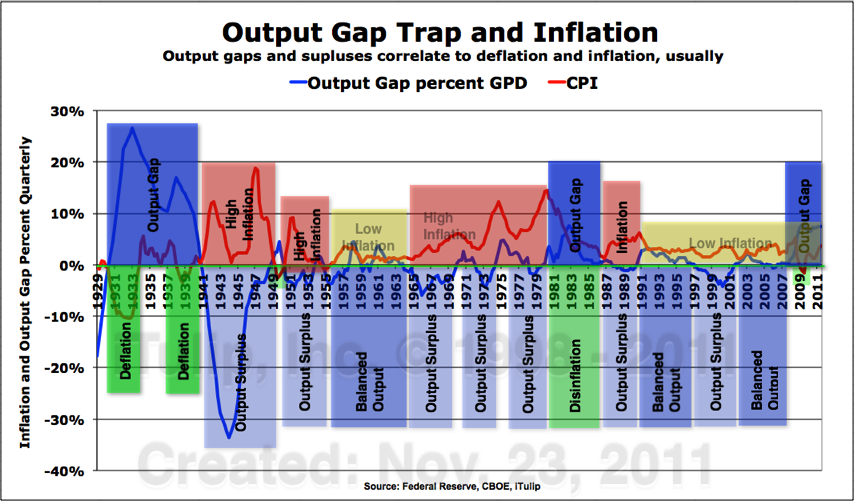
Output and inflation nirvana has occurred only twice in the U.S. since 1929, from 1955 to 1965 and again
from 1991 to 2007. At all other times, output was in surplus, producing undesirably high inflation.
What's going in below the surface of an economy that is operating far below potential yet is at the same time experiencing inflation? What will happen to the U.S. economy is, as we expect, oil prices rise in response to an escalation of Syria's civil conflict into war, and civil war into a regional conflict? How might U.S. policy makers take advantage of this development to close the output gap created during the last recession?
Essential Trends - Part II-B: War Economy Theory
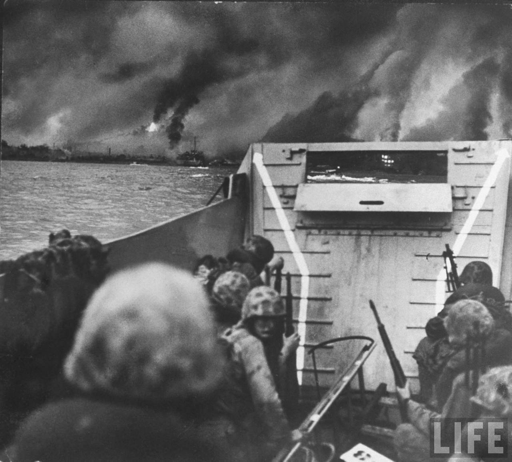
U.S. Marines landing at Inchon as battle rages during Korean Civil War.
Location: Inchon, Korea
Date taken: 1950
Photographer: Hank Walker
Life Images
• Inside an engineered stagflation
• Post-credit bubble, pre-war economy
• Sectors of the stock market speak
(This article is a continuation of Essential Trends - Part I-B: Gold in an Era of Global Monetary System Regime Change)
Underlying the combination of depressed output and rising inflation is an increase in import prices resulting from two years of Print and Pray policy.
We're accustomed to seeing inflation in insurance, health care, education and other non-traded services that have been inflated via the sector-specific credit-money of the rent seeking institutions of the FIRE Economy. In 2006 we created an inflation chart that shows how we experience inflation int he U.S. The price of traded durable goods, such as autos, have remained flat or even declined due to a combination of increased mechanization of manufacturing and low wage manufacturing in Asia and Latin America. (By non-traded we mean that goods and services purchased domestically that are not subject to foreign competition.)
The price of non-durable goods, such as clothing, declined while the prices of non-traded services, especially health care, insurance, and housing, continued to climb at double-digit annual rates. The combination of the two, deflation in the prices of traded goods and inflation in non-traded services and some goods (e.g., housing), produces the benign CPI number that the BEA has printed since 1990. Starting in 2001, oil prices pushed up the price of all energy-related items, such as food, a process interrupted by the crash of 2008. However, energy and food prices are left out of the CPI as being "too volatile" to include. I argue that 10 years of energy price increases does not constitute a short-term trend. At some point persistent cost-push inflation from high energy prices will have to be figured into the CPI.
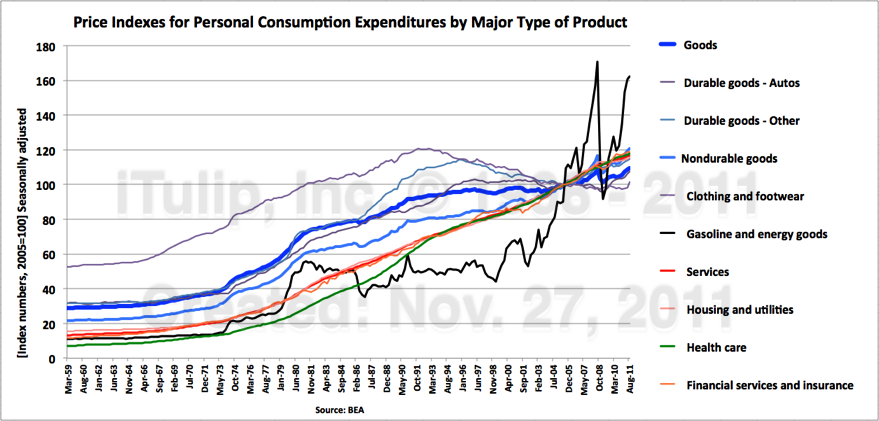
Declining or flat traded goods prices + Rising non-traded services prices - "volatile" energy prices = Benign CPI
The question we have asked since 2006 is this: what happens to headline inflation if the U.S. loses the good deflation component of the pricing regime because something occurs to increase the prices of imported durable and non-durable goods?
The "something" that happened was the collapse of the housing bubble and the Print and Pray reflation policies adopted by the Bernanke Fed to cope with its macroeconomic impact.
We promised you inflation before the end of 2011 due to misguided asset price inflation policy. Bernanke and company delivered. more... $subscription
iTulip Select: The Investment Thesis for the Next Cycle™
__________________________________________________
To receive the iTulip Newsletter or iTulip Alerts, Join our FREE Email Mailing List
Copyright © iTulip, Inc. 1998 - 2011 All Rights Reserved
All information provided "as is" for informational purposes only, not intended for trading purposes or advice. Nothing appearing on this website should be considered a recommendation to buy or to sell any security or related financial instrument. iTulip, Inc. is not liable for any informational errors, incompleteness, or delays, or for any actions taken in reliance on information contained herein. Full Disclaimer

• Why did stocks markets plummet more last week than during any Thanksgiving week since 1942?
• Why are oil prices rising as the global economy slows?
• Why did global central banks buy more gold in Q3 than any period since the collapse of Bretton Woods in 1971?
Last week of the Bureau of Economic Analysis released revised U.S. GDP numbers for 2011. They reveal a U.S. economy destined for a new recession before the economy recovers from the last one, a mid-gap recession in iTulip terminology.
That hasn't happened since 1938.
Yet price inflation is rising across the board, even in goods like apparel and autos. Inflation indexes for these items have remained flat or declined since the early 1990s due to increased mechanization of production and foreign competition with low wage rate countries. Now they are rising as a direct result of the Fed's failed Print and Pray policies aimed at reflating home prices and the Treasury's unofficial Weak Dollar policy that creates cost-push inflation via rising import prices. The price of a car in the U.S. has gone up more over the past two quarters than at any time since the early 1970s, even though units sales of autos, hammered by the recession, remains depressed at early 1980s unit sales volumes.
As the prices of goods and services rise in a weak labor market, real wages fall. The broadest index of wage costs printed a -1.5% real decline in October, as the U.S. economy remains stubbornly stuck in an output gap of 7% of GDP where it landed in early 2009. Two and a half years and trillions of stimulus and bailouts and QEs later, the gap is still 7%. We got nowhere.
The American Financial Crisis of 2008 that led to The Great Recession resulted from a collision of the first Peak Cheap Oil Cycle with a 30-year-old credit bubble as it reached peak risk and hubris in late 2007 with over a trillion in excess mortgage credit financed with bogus asset-backed securities, now on the Fed's books. The next U.S. economic crisis will also be triggered by an oil price related external event. Current course and speed, our staggering economy, barely maintaining forward momentum, stuck in an Output Gap Trap smaller but no less inescapable than in the 1930s, will trip over a spike in oil prices, sending the economy back into recession in 2012.
The reason for the oil spike: the inexorable escalation of Syria's civil crisis into civil war and regional conflict.
Two previously identified crises outside America's boarders that present risks to the weakened U.S. economy are the collapse of China's property bubble and Europe's sovereign debt quagmire. But these are likely to deescalate next year, at least they will take a back seat to oil.
China is in the midst of the credit bubble collapse crisis we forecast a year ago when the People's Bank of China began a program of rate hikes intended to create a soft landing for the nation's property bubble. We predicted a crash by Q3 2011. We also forecast massive and immediate fiscal and monetary reflation by the People's Bank of China and the legislature leaving no opportunity to short the event, even if we did get the timing right. China's uniquely mercantile, centrally planned FIRE Economy will once again come through with the necessary financing to keep the game going, as it has for 35 years, to maintain continuous growth, to justify unelected rule, much to the benefit of commodity exporting countries around the world. Tip for Jim Chanos: Never short China's Great Wall of Money. It's even more hazardous than shorting U.S. Treasury bonds.
The imminent demise of the euro has been widely forecast for more than two years since the euro crisis started with the not so surprising announcement by Greece's new socialist government in November 2009 that the previous administration had been lying about the nation's budget deficit. But reversion to national currencies is not an option for euro zone countries. They locked themselves in a monetary cage and threw away the key a decade ago. They have no choice but to clean up the mess they've made inside it since then. We are betting they will, eventually, but it will be a long and painful process. Europe, forced forward toward greater federalization by the prospect of a collapse of the euro and economic calamity will instead choose fiscal integration and, later, the implementation of an integrated tax and fiscal policy authority. The cost of the alternative -- a collapse of the euro and a total loss on euro bond debts of debtor nations in the zone -- is higher. They will choose the cheaper route, but they will take it in fits and starts.
U.S. re-entry into recession in 2012 is inevitable, followed by a new round of economic stimulus via deficit spending. Meanwhile, oil prices will spike as high or higher than in 2008, as regional instability in the Middle East worsens the stagflation that the Fed has engineered as its answer to preventing another Great Depression with Print and Pray.
How can the U.S. use this new crisis to escape its Output Gap Trap? I argue that the U.S. will over the next two to three years undertake a bold program of new infrastructure development in response to a new energy crisis arising from a regional conflict in the Middle East. The political attitude toward inflation will shift to a level of tolerance of inflation reserved for wartime. New Energy Crisis economic policy will replace the policy of Print and Pray in place since early 2009 to produce an output surplus that finally closes the output gap created by The Great Recession.
We begin our investigation close to home.
The American Output Gap Trap
You wouldn't know the U.S. economy was still in trouble by reading this year's holiday season shopping news. Black Friday retails sales jumped 26% year over year, the reports note optimistically.
Let's put the news in context.

Retails sales on the Black Friday weekend are up 26% from last year, logging $52.4 billion during the four-day weekend,
up from $45 billion last year, the National Retail Federation says. But that $7.4 billion of year-over-year growth
won't make up for the $62 billion in potential retail sales lost to The Great Recession.
It will take more than a weekend spending binge to close an epic output gap.
Our Output Gap Trap charts put the latest GDP news into context. First, a restatement of the theory.
iTulip Output Gap Trap Summary: An economic recession produces a gap between actual economic growth and the output potential of an economy at full employment with low inflation -- an output gap. If the gap is small enough and the recovery strong enough, the gap closes in a few years and the economy returns to "normal." But if the recession is severe and the gap it creates is large, it may not close before the next recession opens it anew. The Great Recession produced an output gap greater than 7% of GDP. In order for the economy to recover to potential in five years requires an economic recovery growth rate that averages 4% annually. At an average of only 3% annual growth the economy will take 20 years to recover to potential, during which time a new recession will inevitably open the gap further; the economy cannot recover to potential and enters a self-reinforcing downward spiral, an Output Gap Trap. The U.S. economy fell into an Output Gap Trap 1930s and escaped during WWII when federal government deficit spending grew public debt from 60% to 130% of GDP and created a 34% output surplus and annual inflation that exceeded 18% in some quarters during and after the war. The U.S. entered another credit bubble and crash induced Output Gap Trap in 2009 with an output gap of 7% of GDP.
A depression, contrary to popular use of the term, is not simply a very bad recession. A recession is a period of economic contraction that lasts from as little as two quarters, as in the case of the 2001 recession, to as much as three years as from 1930 to 1933. Combine the early 1930s recession with the seven years of output gap that followed the recession and you have the decade of The Great Depression. By comparison, the misnamed Great Recession has been exceedingly mild. It stated with a year-and-a-half long recession versus three, an output gap of 7% versus 25%, and only a few months of deflation versus several years. But as we shall see the output gap portion of the current economic depression may prove just as intractable as The Great Depression version. 
Deep Recession + Persistent Output Gap = Depression (Log scale base 5 shows relative severity)
The current depression is a milder version of the 1930s, but shares a similarity of dynamics.
Note gigantic output surplus during WWII after The Great Depression.
A large and persistent output gap creates long-term unemployment.

The bigger the output gap, the worst long-term unemployment gets.
Have we made any progress out of our Output Gap Trap since Q2 2009 when the recession officially ended? Unfortunately, not.
The next chart is from our previous July 2011 Output Gap Trap update with quarterly GDP data as reported then for Q1 and Q2 2011.

Using GDP data from the BEA in July 2011, growth since the end of the recession averaged 2.5% (orange arrow).
The chart shows that at a 3% growth rate the output gap will close by 2019, assuming no recessions occur before then. At a 2% growth rate the gap will never close. The actual 2.5% rate as of July 2011 put economic growth on parallel track to potential output, albeit lower. Call it a "New Normal" if you like. But the latest data show that even the New Normal is not holding.
Here is the same chart updated with last week’s revisions to Q1 and Q2 data and new Q3 GDP data. Yellow highlights the range of data that the BEA revised.

Average annual economic growth since the end of the recession revised from 2.5% to 1.5% (orange arrow).
With this new data, we see the average annual growth rate since the end of the recession has been cut from 2.5% to 1.5%. The output gap remains stuck at around 7% of GDP with no improvement after two years of fiscal and monetary stimulus.
According to standard economic theory, a persistent output gap is supposed to produce deflation because a weak labor market weighs on demand. But U.S. economic policy makers have engineered stagflation instead, as I predicted they would in my book The Postcatastrophe Economy: Rebuilding America and Avoiding the Next Bubble
 .
. In this analysis, we found price inflation across the board, even in goods that we think of as cheap. For example, apparel.

The primary tool of inflation creation since early 2009 has been dollar depreciation, as predicted here in 2007; the Fed and Treasury were to choose the Foolproof Way out of deflation in the form of a weak dollar policy. The mechanism is cost-push inflation from imports that produces an out-sized impact on prices in the domestic economy.
It worked. As the chart below shows, a two year, 7% of GDP output gap has not kept inflation from rising beyond the Fed's 2% target zone.

Output Gap + Inflation = Stagflation
Print and Pray is a policy choice: for an over-indebted economy, a modicum of nominal growth with moderate inflation is better than zero or negative nominal growth and no inflation.
Japan's bouts of deflation since the mid 1990s have been blamed on the series of output gaps that Japan has gone through since 1993. The Japanese economy has escaped only twice since then: from 1996 to 1997 and briefly in 2007. Japan is unable to use currency depreciation to promote inflation, for reasons we won't go into here that have to do with the net negative impact of such a policy for country like Japan that runs a current account surplus; currency depreciation is self-defeating.

Output Gaps and inflation in Japan, 1983 to 2015 -- as optimistically projected by the IMF in 2011.
The worst case scenario was The Great Depression when massive output gaps produced a deflation spiral. Deflation reached double digits in some quarters in the early 1930s. WWII launched the U.S. back out of its Output Gap Trap in 1939 with a gigantic 34% of GDP output surplus and high inflation. Three smaller output surplus periods between 1965 and 1980 produced The Great Inflation that peaked in 1980. We'll go into the history of output gaps and surpluses, inflation, and deficits and the implications in Part II.

Output and inflation nirvana has occurred only twice in the U.S. since 1929, from 1955 to 1965 and again
from 1991 to 2007. At all other times, output was in surplus, producing undesirably high inflation.
What's going in below the surface of an economy that is operating far below potential yet is at the same time experiencing inflation? What will happen to the U.S. economy is, as we expect, oil prices rise in response to an escalation of Syria's civil conflict into war, and civil war into a regional conflict? How might U.S. policy makers take advantage of this development to close the output gap created during the last recession?
Essential Trends - Part II-B: War Economy Theory

U.S. Marines landing at Inchon as battle rages during Korean Civil War.
Location: Inchon, Korea
Date taken: 1950
Photographer: Hank Walker
Life Images
• Post-credit bubble, pre-war economy
• Sectors of the stock market speak
(This article is a continuation of Essential Trends - Part I-B: Gold in an Era of Global Monetary System Regime Change)
Underlying the combination of depressed output and rising inflation is an increase in import prices resulting from two years of Print and Pray policy.
We're accustomed to seeing inflation in insurance, health care, education and other non-traded services that have been inflated via the sector-specific credit-money of the rent seeking institutions of the FIRE Economy. In 2006 we created an inflation chart that shows how we experience inflation int he U.S. The price of traded durable goods, such as autos, have remained flat or even declined due to a combination of increased mechanization of manufacturing and low wage manufacturing in Asia and Latin America. (By non-traded we mean that goods and services purchased domestically that are not subject to foreign competition.)
The price of non-durable goods, such as clothing, declined while the prices of non-traded services, especially health care, insurance, and housing, continued to climb at double-digit annual rates. The combination of the two, deflation in the prices of traded goods and inflation in non-traded services and some goods (e.g., housing), produces the benign CPI number that the BEA has printed since 1990. Starting in 2001, oil prices pushed up the price of all energy-related items, such as food, a process interrupted by the crash of 2008. However, energy and food prices are left out of the CPI as being "too volatile" to include. I argue that 10 years of energy price increases does not constitute a short-term trend. At some point persistent cost-push inflation from high energy prices will have to be figured into the CPI.

Declining or flat traded goods prices + Rising non-traded services prices - "volatile" energy prices = Benign CPI
The question we have asked since 2006 is this: what happens to headline inflation if the U.S. loses the good deflation component of the pricing regime because something occurs to increase the prices of imported durable and non-durable goods?
The "something" that happened was the collapse of the housing bubble and the Print and Pray reflation policies adopted by the Bernanke Fed to cope with its macroeconomic impact.
We promised you inflation before the end of 2011 due to misguided asset price inflation policy. Bernanke and company delivered. more... $subscription
iTulip Select: The Investment Thesis for the Next Cycle™
__________________________________________________
To receive the iTulip Newsletter or iTulip Alerts, Join our FREE Email Mailing List
Copyright © iTulip, Inc. 1998 - 2011 All Rights Reserved
All information provided "as is" for informational purposes only, not intended for trading purposes or advice. Nothing appearing on this website should be considered a recommendation to buy or to sell any security or related financial instrument. iTulip, Inc. is not liable for any informational errors, incompleteness, or delays, or for any actions taken in reliance on information contained herein. Full Disclaimer
Comment