iTulip Portfolio Strategy – Section 1, Part I: The Past Ten Years
Reallocating our year 2000 ``Holy crap! Our political economy is broken!’’ portfolio
Why did I build a portfolio composed only of gold and Treasury bonds ten years ago, why did it outperform moderate risk benchmark portfolio allocations since then, and why won’t it work for the next ten years?
This is the story of how I traded my own account since 1998 and shared the positions and my reasons for taking them with my friends here at iTulip. I don't offer investment advice, just my opinions on the markets and economy. Some of you may have adopted all of, part of, or none of my arguments over the years, depending on your take on my analysis. Some of you are 100% gold. Some of you have no gold at all. Some of you think Treasury bonds are a bubble about to pop and own stocks instead.
What follows is an analysis of a hypothetical portfolio that paralleled the one discussed here since 2000. For those of you who have the same allocations as I have had all these years, here’s your chance to see how the portfolio performed. If you didn't and your portfolio mirrored a standard "moderate risk" portfolio allocation, well, read 'em and weep.
The Hypothetical iTulip Portfolio (HIP)
Below we compare the performance of a mythical iTulip portfolio manager running a hypothetical iTulip investment portfolio, or HIP, allocated as follows:
- From 2000 to 2001, 25% cash, 75% 10-year Treasury bonds
- From 2001 to Aug. 2010, 10% cash, 15% gold, 75% 10-year Treasury bonds
My friends at Twin Focus Capital Partners, who are not lazy, plugged this portfolio into a modeling tool called Zephyr StyleADVISOR and compared it to two benchmarks, the Morningstar Moderate Allocation and the Balanced Fund Index composed of 60% S&P 500 Index and 40% Barclays Capital Aggregate Bond Index.
We tell the story of the HIP's relative performance to the benchmark portfolios through a conversation over beers at the Wallstreet Pub between a fictitious iTulip portfolio manager named Fred, of course, and a benchmark portfolio manager we’ll call Franky. Any resemblance between our fictitious portfolio manager characters and real humans is purely coincidental.
Franky the benchmark portfolio manager: The market’s kicking my ass again.
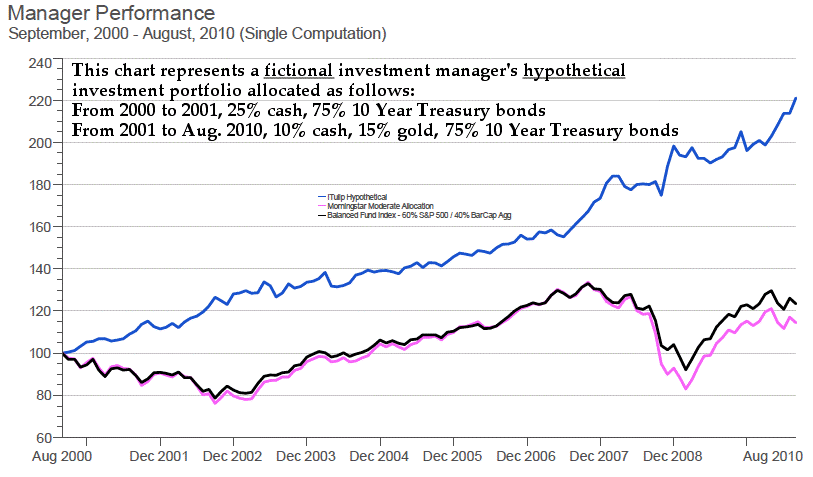
Fred the HIP manager: Sorry to hear that. We just had our ninth up year out of the past ten relative to you. Last year was the only year you beat us.
Franky: No kidding. Show me.
Fred: You got it!

I killed both benchmarks over the past ten years.
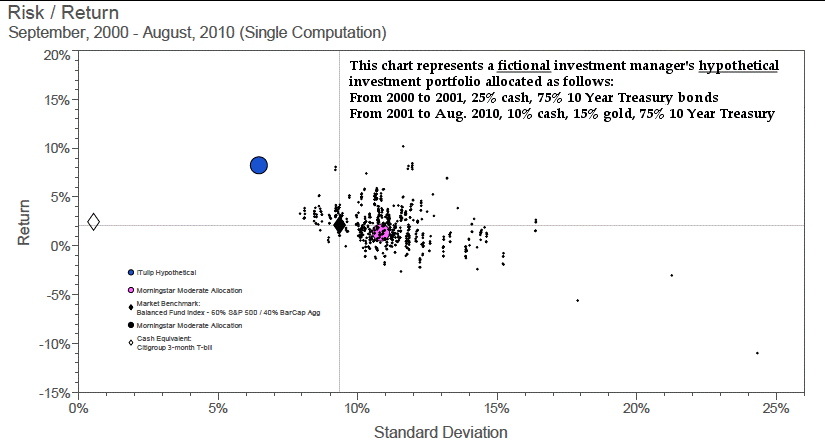
Franky: Very nice. Those are great relative returns, but what about return on risk? Gold is risky. No way those returns came without a lot of risk.
Fred: Not so, Franky. Take a look.

The big blue dot on this Risk/Return chart is the HIP.
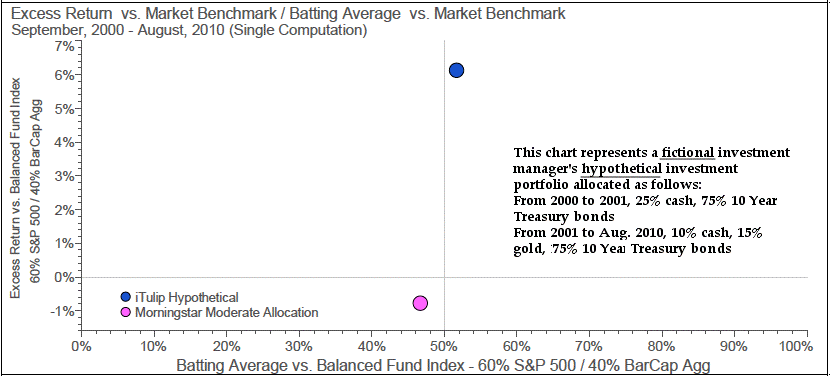
Franky: Okay, maybe the HIP produced great returns and wasn’t risky, but what about consistency? How well did you perform relative to the market?
Fred: Glad you asked. The best way to measure that is batting average.
According to investopedia.com:
“The batting average measures the manager's ability to meet or beat the market consistently. It is calculated by diving the number of quarters (or months) in which the manager beats or matches the index by the total number of quarters (or months) in the period. A manager who outperforms the market one-half of the time will have a statistical batting average of 50. The longer the time period analyzed, the more statistically significant the measure becomes.”
Franky: Yeh, yeh. I know what portfolio manager “batting average” is. Get on with it.Fred: You might want another beer before you see this one.

I had a batting average of 52% versus you who beat it less than 46% of the time. Not only that, but I produced a 6.4% excess return versus your -1% excess return. You did a lot of work for less than nothing. I did nothing and kicked ass.
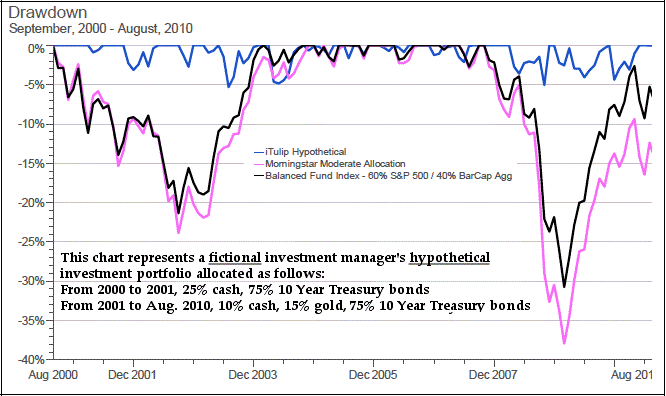
Frank: Okay, wiseguy. But I bet your drawdowns were deep. Gold was all over the place the past ten years.
Fred: Well, then you’re in for a surprise!

Franky: Aw, crap! Are you kidding me? You got those returns and your drawdown never exceeded 5%? Get me a shot of Cutty Sark.
Fred: When did you start drinking that stuff.
Franky: Since I stopped be able to afford single malt.
We have nine more charts to go that we go over next in Section 1, Part II where we go into how we developed the HIP. Next month, in iTulip Portfolio Strategy – Section 2, Part I: The Next Ten Years, we explore various options for moving out of Treasury bonds while holding a gold position.
iTulip Portfolio Strategy – Section 1, Part II: The Devil’s in the Details
How did I know to sell stocks in early 2000, go 75% into ten year Treasury bonds at 6.4% and 25% cash, then move 15% out of cash into gold in 2001 at $270? And then, the even harder part, how did I stick with it for ten years without trading in and out of the position? How will our learnings from the past decade help us prepare for the next but this time in a very different kind of macro environment, one not driven by the cycle of asset inflations, deflations, and reflations but the complex set of monetary, political, and economic dynamics described in The Postcatastrophe Economy: Rebuilding America and Avoiding the Next Bubble
 ?
?Let's start with the reasoning behind the Hypothetical iTulip Portfolio HIP. Digging back into the iTulip archives, here’s a summary of my reasoning.
First of all, you have to remember the times. It’s the year 2000. Everyone in the stock market is a genius and Alan Greenspan is the hero. After all, everyone was getting rich. I said he was destined for the goat rodeo. Six years later in my 2006 April Fool’s joke posting “Greenspan Apologizes for Wrecking World Economy” I used humor to lay out events I foresaw happening two years later. Reading it today, it’s not all that funny. In fact, it’s eerily similar to the events that followed.
iTulip Select: The Investment Thesis for the Next Cycle™
__________________________________________________
For a concise, readable summary of iTulip concepts read Eric Janszen's September 2010 book The Postcatastrophe Economy: Rebuilding America and Avoiding the Next Bubble
 .
.To receive the iTulip Newsletter/Alerts, Join our FREE Email Mailing List
To join iTulip forum community FREE, click here for how to register.
Copyright © iTulip, Inc. 1998 - 2010 All Rights Reserved
All information provided "as is" for informational purposes only, not intended for trading purposes or advice. Nothing appearing on this website should be considered a recommendation to buy or to sell any security or related financial instrument. iTulip, Inc. is not liable for any informational errors, incompleteness, or delays, or for any actions taken in reliance on information contained herein. Full Disclaimer


Comment