Debt-deflation Bear Market Update - Part I: First Bounce officially over (really)
Why stock markets, oil prices, but not precious metals prices are falling
• FIRE Economy re-start flames out
• Housing bust recession not over
• Fed selling deflation, again
Only 27 days? Feels like years since the DOW stood more than 1000 points taller back when we published The Next Crash on April 28. Not a forecast of an imminent correction. For that you needed to heed our man Finster's April 21 post Correction Due Shortly. By coincidence stocks did “flash crash” a week later on May 6. As is our tradition here since 1998—an old age home, by Internet standards—we poured a bucket of cold water over fevered bullishness that was beginning to infect our modest home to fans of dispassionate economic and market analysis.
Several took me out to the woodshed in the comments area for failing to direct them back into the stock market like a good stock salesman in March 2009 when we trumpeted the start of the First Bounce of the Debt Deflation Bear Market. Not that we did anything to stop them. But let’s just say we were not encouraging, announcing an end to the rally several times as our way of trying to keep them out of harm's way.
The din of protests soon quieted to a hush a week after we posted as fear of losing money pushed aside the fear of losing out on a rally based on half-true data, wishful thinking, momentum, debt, money growth, and reversible capital flows. But a context-free, event driven media cuts and pastes facts and fantasy together into a Photoshop quasi-reality that changes hourly, so 27 days feels like another era.
The long decay
Officially, we’ve been out of the stock market since March 2000 when the S&P500 traded 45% higher than today in real terms. I tried explaining this to an investor radio show host last week but he didn’t want to hear it. Or, more to the point, his listeners didn’t and he knew it; a society buried in fallacies up to its eyeballs cannot afford to hear facts. His audience believes the half-truth that stocks had made “new highs” in December 2007, not coincidentally at the month when we issued our second warning to readers in ten years to get the hell out.
New highs? Really? Go to any inflation calculator site. Enter the peak price of the S&P500 March 24, 2000 of 1527. That’s 1924 in today’s dollars. Seven years later in 2007 the index reached a new nominal high 1560. The S&P500 closed at 1073 yesterday.
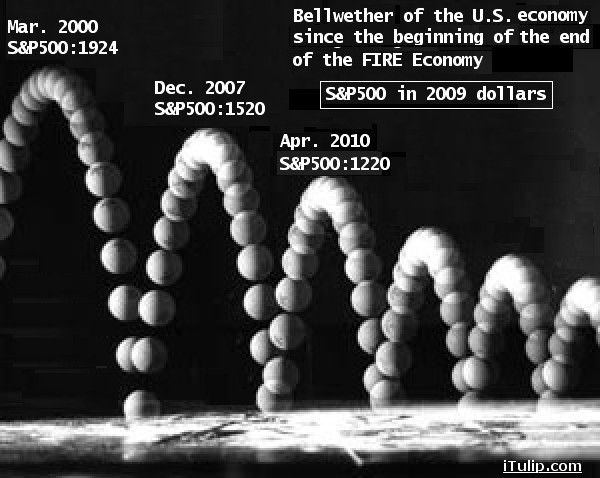
S&P500 in 2009 dollars: March 2000 to May 2010
Behold the entire sordid process graphed as a bouncing ball that starts with a drop in the early 1980s when the Volcker Fed inadvertently launched the FIRE Economy. Tall Paul did a toaster reset on the U.S. economy with double-digit interest rates but not until after double-digit inflation did the work of wiping out a generation’s debts. Public debt, too; the nation didn’t have much to speak of, a fact that many forget who today hope for the U.S. to repeat the austerity of those good old days, as if the United States didn’t live off capital flows from foreign investors to finance not only its trade deficit--a flow of funds that is balanced by its capital account--but up to 70% of its government spending in some years. Why do foreign investors do this? Perhaps the crisis unfolding in North Korea will serve as a reminder why Japan needs American troops there, and to other nations why financing the U.S. military is good for the global economy. If that is the point of the showdown in Korea, the timing is ideal.
That was then. This is now.
The early 1980s austerity of high interest rates and reduced government spending set the United States up for a 20-year boom. If attempted today the same measures will trigger a sudden stop. This is why we find Volcker these days tromping around Capital Hill pressing the value of a VAT to cut our public debt. The irony of a Volcker plan to dial inflation into the economy to pay down debt is not lost on us; it's the inevitable end result of a finance-based economy that libertarian policies set in motion so many years ago when national economic policy was ceded to Wall Street.
The FIRE Economy boom reached its epic high with the technology stock bubble peak in March 2000. The dwindling purchasing power of the S&P500, bellwether of the U.S. economy, chronicles the degeneration of the U.S. economy ever since as each new real market peak ends lower than the previous one.
But these are mere facts. This paint pealed pantry lined with cans of soup and bags of beans is no match for the slick Photoshop image of a happy debt addicted economy we see day in, day out, its denizens eating food on credit and plowing the highways in cars they can’t afford—they had to borrow money to buy them, in violation of the ancient old law of household finance to avoid using debt to purchase depreciating assets.
Fake facts conflate with the provable, all bobbled into an adulterated mash that looks real enough to the casual observer, but completely insane on close inspection.
Close inspection? Who has the time?

We all want to believe in the stock market. It’s un-American not to. Stocks measure the tenacity of our nation’s business leaders; stock prices are the market's scoreboard.
The figure of the unstoppable American entrepreneur is half accurate. Steve Jobs and Jeff Bezos are its flesh and blood. But what of the entrepreneurs who are raking in the big dough selling liar loans and securitized dog shit? Wall Street firms prey on our wish that our economy is 80% the former and 20% the latter even if on a total payments basis the statistically accurate fact is the reverse.
Our wish to see what we want to see demands this half-real Photoshop depiction of our economy. Bogus messages delivered with high production values, ubiquity, the patina of authority and legitimacy, and repetition, repetition, repetition does the rest.
Two economies not one
Much of the confusion stems from the bi-polar nature of our economy, for ours is not one economy but two. One production-based, governed by the stern rules of profit and loss. The other financed with capital gains and guided by the mutable laws of finance. Political influence on the former is direct and visible, such as through tax policy, the latter through inscrutable regulations, or lack of enforcement thereof, that results first in private debt, then in public when the private over-indebtedness leads to financial crisis. Public debt is nothing more than today’s taxes collected tomorrow, plus interest.
Who shall pay? In Greece, as elsewhere in Europe, not those who signed the papers that created the debt in order to finance the European lifestyle to which the nation states of the euro zone have become accustomed. Public borrowing beyond the level that produces a real return on investment is a bribe for votes. The structure of that system of bribery in Europe is layered on top of a half-currency, the euro. Without a central euro bond debt issuing or tax collecting authority, there is no way to resolve debt crises or convince creditors that sovereign debt is backed by sufficient tax receipts. But when the euro came together there was no operational provision made to revert to the old system of multiple national currencies should this obviously flawed system fail. For example, and an important one: modifying the banking computer systems and networks took years of coordinated effort leading up to the 1999 euro launch. A reversion to multiple currencies could be reasonably expected to be uncoordinated or, more to the point, chaotic. Think of it as a currency Y2K+10.
Thoughts of an orderly retreat from the euro are misguided. The euro zone member states locked themselves in a cage in 1999 and threw away the key. A fire erupted in the cage after elections in Greece last fall. The new administration revealed that the nation’s debts were twice as large as previously reported. The panic spreads as euro bond-holders doubt that the Greek government was the only one lying. There is no disinterested authority to bring them all to account.
Euro zone capital flight that began last week intensified this week. It flees into gold, pushing prices up even as stock markets tumble. It also flees into dollars, where it is not wanted; the United States needs its weak dollar to maintain export sector growth, and high oil prices to send inflation signals into the over-indebted economy to forestall debt-deflation in the FIRE Economy. Is it working?
FIRE Economy behind the curtain
Who knows? Or rather, how can we know? The performance of the productive economy is measured six ways from Sunday. Data on unemployment, inflation, productivity, and output are dutifully reported by the business media. We question its veracity, but what of measures of the health of the FIRE Economy? Where are the monthly reports on the ratio of mortgage debt to household income? What of measures of asset price inflation and deflation? How much household cash flow is pledged to pay interest on debt?
At least the last one we can calculate.
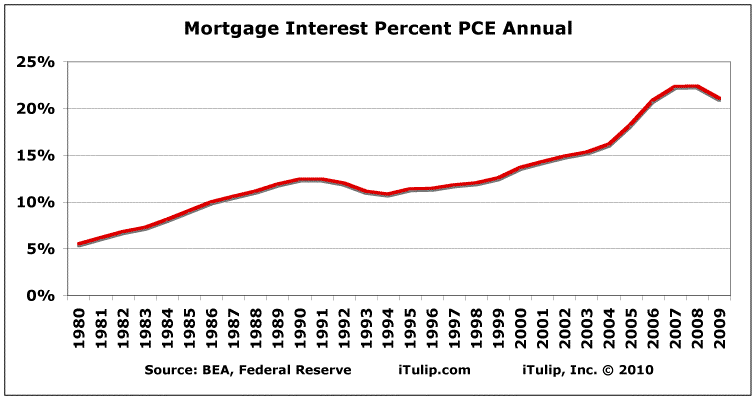
Interest on mortgages is now over 20% of personal consumption expenditure
versus 5% in 1980 before the FIRE Economy. This despite the fact that
60% of housing is owned outright and mortgages only apply to less than
half of households.
versus 5% in 1980 before the FIRE Economy. This despite the fact that
60% of housing is owned outright and mortgages only apply to less than
half of households.
Given the foregoing, we have part of the answer to the question: Why have stocks performed so badly while gold has performed so well?
But no one ever asks the question, because the fact is virtually unknown.

Jeremy Grantham recently dipped a toe into the gold market after deriding the yellow metal through the whole asset bubble period. He went on record in 2002 saying, “I can say with a clear conscience that I have never made a mistake in gold because I have never had an opinion on gold," he said in a 2002 interview with Barron's. "I have completely and assiduously avoided it. I feel uncomfortable with gold. It has no yield."
That was one year after we looked at the same data and decided that gold was cheap, the economy was in deep trouble, and bought gold.
Nine years later, in a May 19 Fortune blog entry incongruously titled “One man vs. the gold bubble” Grantham said, “I hate gold. It does not pay a dividend, it has no value, and you can't work out what it should or shouldn't be worth. It is the last refuge of the desperate."
Well, if Grantham “hates gold” then he should have read the my America’s Bubble Economy chapter “Gold for people who hate gold” published in October 2006 when the metal that “has no value” traded at less than half of today’s price.
In any case, we welcome Jeremy to the market even if he is nine years late.
Why (nearly) everyone hates gold
The premise of articles on gold in the business press, as we explained in Lessons of the American Lost Decade – Part 1: The gold bugs were right, is that stocks trounce gold. More volatile. No yield. Stocks are a better inflation hedge. Blah, blah, blah. The perpetuation of these myths has been entirely effective.
Stop an American citizen, I mean, consumer on the street and ask him if he knows that a portfolio composed of gold and Treasury bonds has trounced a stock portfolio for over 12 years. Ask him if he knows that gold out-performed stocks every single year since 2005, including this year—at least so far. He'll look at you as if he's just heard someone tell him that a herd of buffalo was discovered on the moon.
The first time we posted these charts in How to make $301% in six years with low volatility January 2008, we were up 301%. Today: 417%.
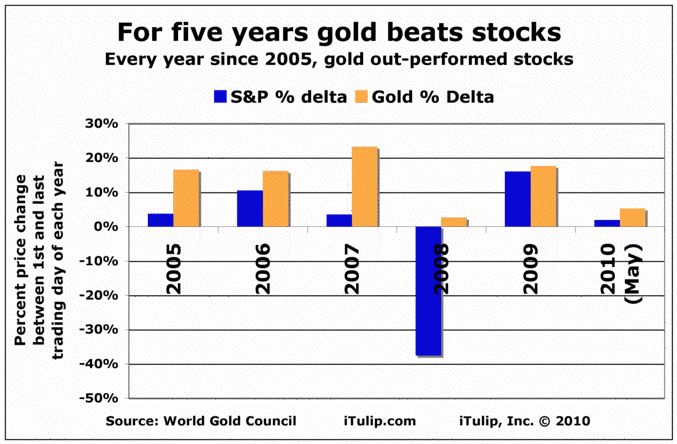
Since 2005, gold has outperformed stocks every single year
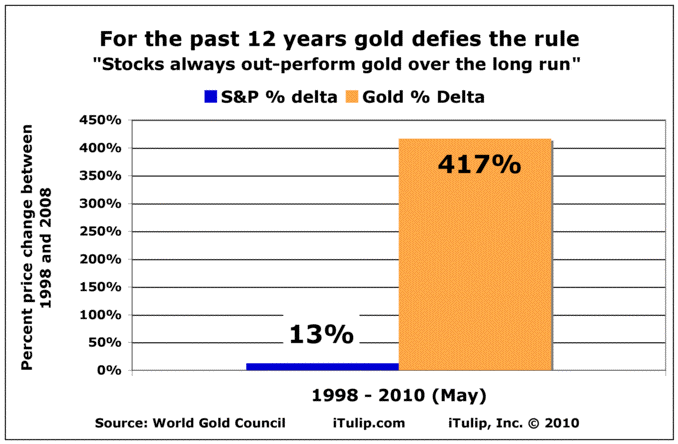
Since 1998, the S&P has gained 13% while gold has gained 417%
There you have it. The real reason why gold is so derided. It makes fools out of even the most sophisticated, contrarian, and independent market analysts. How many tens of billions have been spent on fees and taxes and other transaction costs in pursuit of the returns that buying gold and doing nothing for ten years delivered?
Gold, an uncouth contestant on a trivia game show with a high school diploma and a checkered past getting all the answers right while his Ivy League business school competition gets them wrong.
Gold, an old man tooling his 1983 Jeep Cherokee past a $80,000 Infiniti SUV stuck in a snow bank.
Gold, a tattoo painted, steel studded teenager on a street corner jeering a Newman suited investment banker who’s slipped and fallen into a puddle of poodle poop.
Goddamn gold! Winning. Winning. Winning.
Bad facts
For readers who insist on participating in the Asylum Markets of the post FIRE Economy by playing the First Bounce rally, The Next Crash was intended as a reminder that, “Market participants can’t differentiate between an organic, private-sector-led economic recovery and a government-financed recovery,” as we noted last November, repeating an idea that we first proposed in 2008 before the First Bounce began. Portions of the productive economy may be recovering briskly, others not, while bits of the FIRE Economy respond to government subsidies while others flame out.
Japan has since 1990 gone through a related, albeit different process, since the early 1990s.
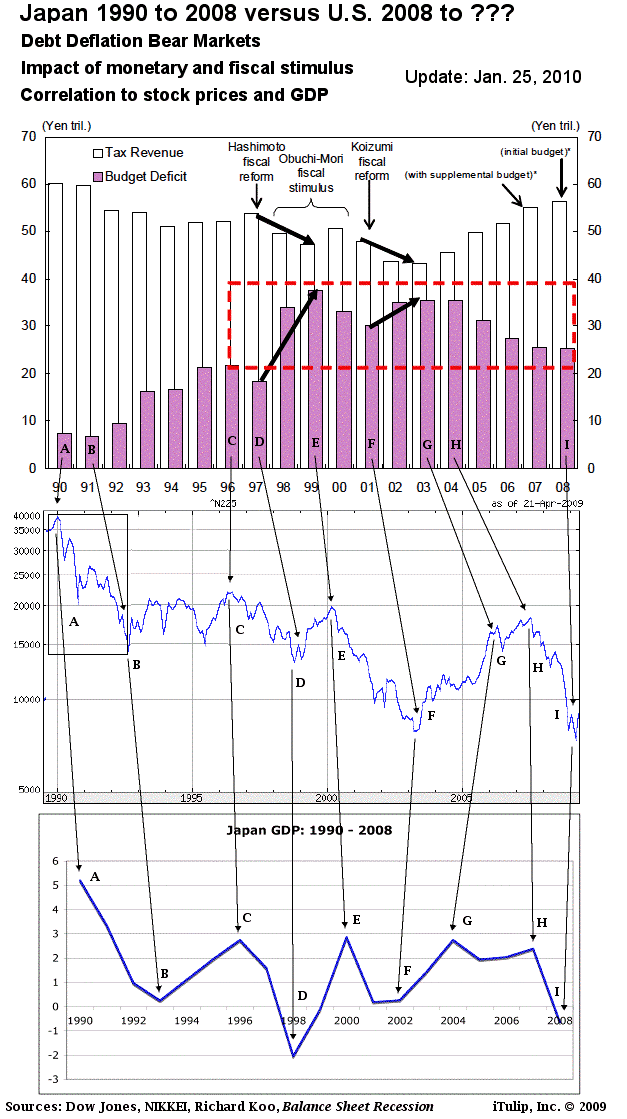
The three charts show the relationship between post-bubble reflation policy, GDP, and stock prices in Japan since the start of Japan's debt-deflation period in 1990.
Once a credit bubble has collapsed, after the initial period of debt-deflation, stock markets continue to price in expectations of future performance of the economy, but the performance of the economy depends on government policy, and the impact of politics on policy, and market perception of policy. Note for example the impact of Hashimoto fiscal reforms in 1995 on GDP in 1997 and 1998 in the chart above. Today this relationship between policy and markets in a post-bubble, zero interest rate policy (ZIRP) environment is widely known, so you'd expect the markets to price in the result of policy changes before they are implemented. If the election of Rand Paul indicates a policy directional change that carries forward to the 2012 presidential elections, a fiscal reform crash may soon follow.

The so-called Great Recession was a continuation of the recession that would have occurred in 2001 had the process of debt-deflation then been allowed to run its course instead of the housing bubble FIRE Economy intervention. The partially re-inflated FIRE Economy, and its distortions of labor markets, interest rates, and inflation, produced the Photoshopped economy with its incongruous mix of recovery in one area and ongoing collapse in another.
Whatever you do, don’t bring up the NASDAQ in a discussion of the stock market. That’s bad taste. Act like there’s nothing wrong.
Debt-deflation Bear Market Update - Part II: Act like there's nothing wrong
When there are no easy solutions, there will be hard ones
• Selling deflation
• Europe’s intractable sovereign debt crisis
• Failure of public housing
• Richard Koo was right
• Right policy, wrong time
• Official end of the First Bounce
The First Bounce of the Debt Deflation Bear Market is the tail end of the now ten year process of decline of the FIRE Economy. If the 2008 financial and economic crisis was not great enough to create a political forcing function for change, then we can expect an even greater crisis in the future that will. more... $ubscription
__________________________________________________
To receive the iTulip Newsletter or iTulip Alerts, Join our FREE Email Mailing List
Copyright © iTulip, Inc. 1998 - 2010 All Rights Reserved
All information provided "as is" for informational purposes only, not intended for trading purposes or advice. Nothing appearing on this website should be considered a recommendation to buy or to sell any security or related financial instrument. iTulip, Inc. is not liable for any informational errors, incompleteness, or delays, or for any actions taken in reliance on information contained herein. Full Disclaimer
Comment