 |
After the crisis, life goes on... sort of
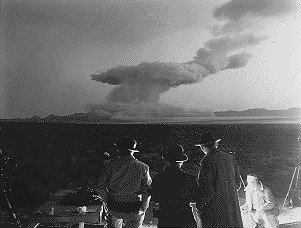
March 2010 marks two years since the market for securitized mortgage debt went critical and sent a cloud of radioactive economic fallout rolling over the land. The explosion blasted through a eggshell thin regulatory containment vessel that self-interested optimists assured us was sufficient to keep any possible, albeit unlikely, financial crisis fallout away from polluting the so-called real economy. Instead, the fiery gas of credit crisis rolled over the economy like a firestorm.
Damage report: Ten million unemployed, $11 trillion loss in household net worth, $8 trillion in real estate losses, three million home foreclosures, auto industry in a deep depression, and dozens of states, cities and towns on the brink of bankruptcy.
Emergency response: Reclassification of dozens of credit card companies and investment banks as commercial banks so they can receive more than $13 trillion in emergency federal loans, near zero Fed Funds rate, a tripling of budget deficit from a projected four percent of GDP to 13% as tax receipts collapsed and government outlays are expanded to stimulate the economy, and an explosion in government debt as trillion in new government borrowing.
Albert Einstein was once asked how many years the world might need to recover from a nuclear war. He replied, with characteristic dry humor, that the recovery rate will depend on how many lawyers survived. In our case economic recovery from the economic crisis depends on how many leaders remain under the influence of the finance, insurance, and real estate industries after the 2010 mid-term elections, to direct our public and semi-public institutions to benefit the interests of this minority over the interest of their constituency. These are the men and women who collectively and systemically created the conditions for crisis over the decades preceding the event, who are now making every effort to rebuild the firetrap, at the expense of the nation’s solvency under the banner of fiscal stimulus.
Fiscal stimulus, otherwise known as deficit spending, is a gamble that spending tomorrow’s tax revenue today during a downturn will help the economy in the long run. When private sector demand from businesses and household falters government demand can take up the slack. Once the economy gets going again, government outlays can be reduced as tax revenues rise with economic growth, and the debt taken on during the period of stimulus spending can be repaid. The trouble with the theory is that recession fighting fiscal stimulus always collides with election cycles. To increase government spending is to increase one's chances of getting elected. To cut government spending is to guarantee an election loss. This is why no administration since Eisenhower has cut the budget deficit through reductions in outlays or higher taxes during economic expansions. The Clinton administration nurtured a budget surplus with capital gains tax receipts from Greenspan's asset bubble.
In 2006, before the crisis, by way of alerting our readers to ignore the warnings of those who falsely predicted a deflationary crash, we depicted money flows in a healthy economy as follows.
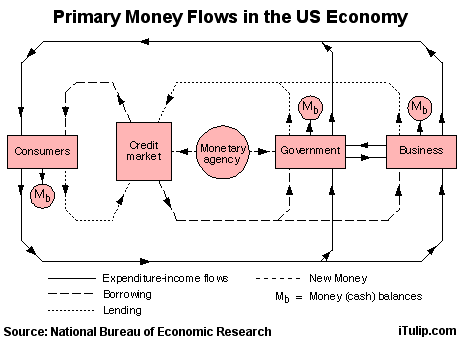
In our credit-based money system, money is borrowed into existence, whether by the public or private sector. Our forecast was for a radical rise in government spending and credit to compensate for future declines in private sector borrowing when the crash came. We expected the Fed to take the bad debts off the balance sheets of the banks, the discount window to be thrown wide open to provide hundreds of billions in cheap, short-term loans to banks to keep them afloat, a near zero Fed Funds rate to try to stimulate private spending, and trillions in government stimulus programs, such as on infrastructure projects, to “create jobs” to compensate for losses in the private sector labor market.
And so it was. We got TARP, ZIRP, the nationalization of Fannie Mae and Freddie Mac, and the $862 billion American Recovery and Reinvestment Act. As expected, with private credit markets still wobbly, money flows in the U.S. economy depend on government, and at very low interest rates. We parked our money in gold and Treasury bonds to ride out the inevitable, at least to our way of seeing things.
And so it was. We got TARP, ZIRP, the nationalization of Fannie Mae and Freddie Mac, and the $862 billion American Recovery and Reinvestment Act. As expected, with private credit markets still wobbly, money flows in the U.S. economy depend on government, and at very low interest rates. We parked our money in gold and Treasury bonds to ride out the inevitable, at least to our way of seeing things.

The policy question today, now that the acute phase of the financial crisis is over yet the fallout of structural high unemployment, crushed asset prices, and high energy prices linger, how to wean the economy off government spending and credit? This means gradually offloading the bad debts back onto the banks, raising interest rates, and reducing government spending.
None of this will happen this year, and very likely not until after mid-term elections. Increases in taxes to help cover the deficit is more likely than a reduction in outlays, with the usual result, an even more sluggish recovery than we are seeing already. Long-term, we expect to see a VAT tax in the U.S. Before we get to that, here’s is what’s behind yesterday’s surprise discount rate hike. No, it does not signal the beginning or rate hikes overall.
Fed to banks: “Step away from the window”
Yesterday the Fed raised the Primary Credit Rate by ¼ percent, from 0.5% to 0.75%. The Primary Credit Rate is the interest rate that the Fed charges banks that use primary credit facility to borrow from the Fed’s emergency lending “discount window” for emergency usually overnight loans.
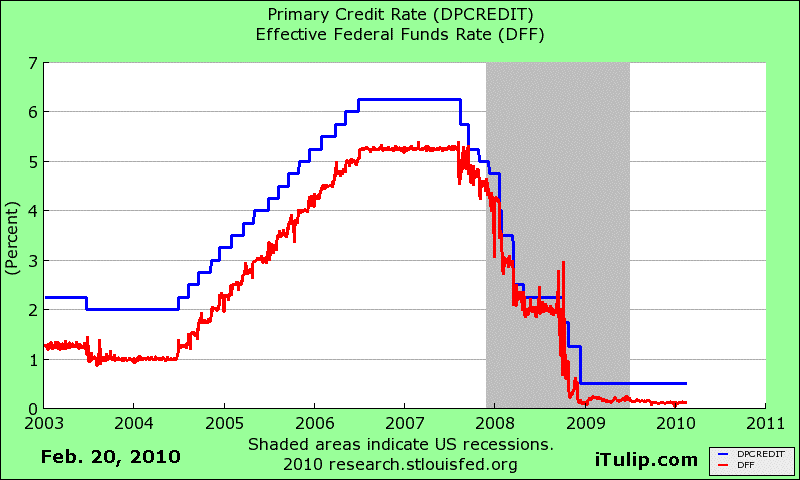
As you can see, one night leads to another. Many large banks borrowed over and over again, day after day starting at the end of 2007. As of the end of January 2010 banks borrowed a total of $150 billion in primary credit from the discount window on an “emergency” basis.
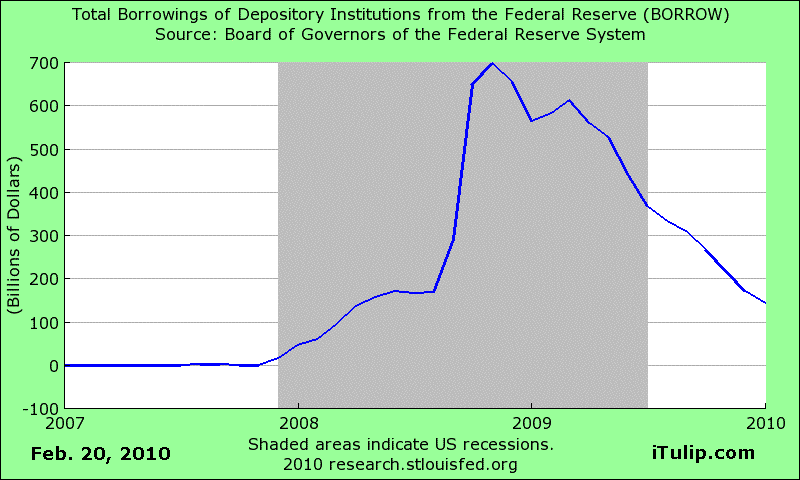
Emergency discount window borrowing is down from $700 billion at the peak of the crisis in November 2008, but $150 billion in a month is still an extraordinarily high level of “emergency” borrowing by historical measures. Discount window borrowing at the peak of the S&L crisis in the late 1980s, for example, barely shows up as a blip on the graph going back to 1919.
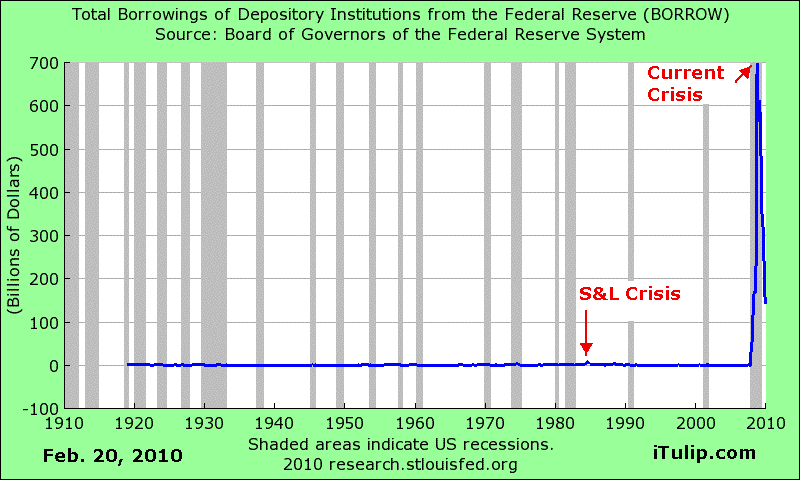
In the announcement of the hike in the Primary Credit Rate the Fed made it clear that the move in rates does not signal a tightening of credit. In fact, the opposite. The Fed is trying to expand credit not tighten it.
The theory behind the Fed’s decision to raise the cost of bank borrowing from the discount window is to motivate banks to borrow from the private credit markets instead of from the Fed, expanding private credit. A look at the liabilities side of the household balance sheet shows why.
The theory behind the Fed’s decision to raise the cost of bank borrowing from the discount window is to motivate banks to borrow from the private credit markets instead of from the Fed, expanding private credit. A look at the liabilities side of the household balance sheet shows why.
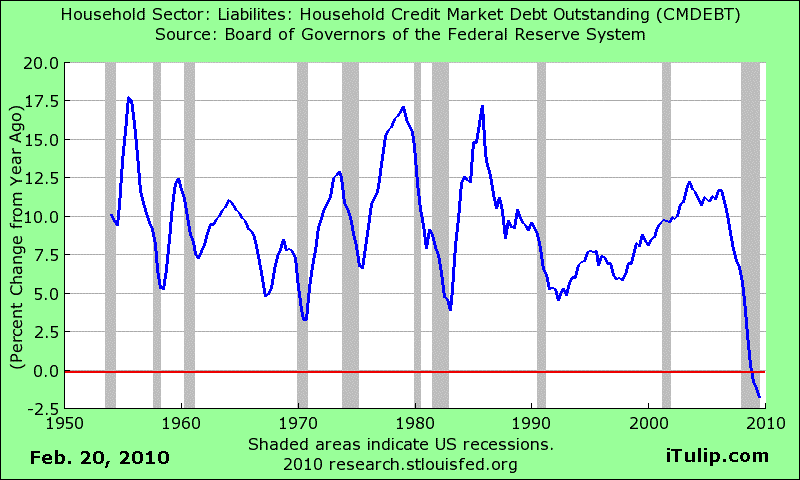
Households continue to reduce debt levels. Debt liabilities of households are the assets of banks. As household debt levels fall, so do bank assets. Unfortunately for the banks, high unemployment and a the crash in both the residential real estate market and commercial real estate, that we forecast at the peak in June 2008, means that loans keep going bad as asset prices fall. This shows up as the ratio of bank assets to ALLL, the allowance for loan and lease losses that is adequate for a bank to absorb estimated credit losses associated with the loan and lease portfolio as filed with the SEC. For the very largest banks, with assets over $10 billion, the ratio of assets to ALLL collapsed from over 90% before the crisis to 10% today.

Banks are in no condition to weather a credit tightening cycle. When the Fed says it has no plans to raise the Fed Funds rate for the foreseeable future, they’re not kidding. The Fed hopes that yesterday’s rate hike was stimulative.
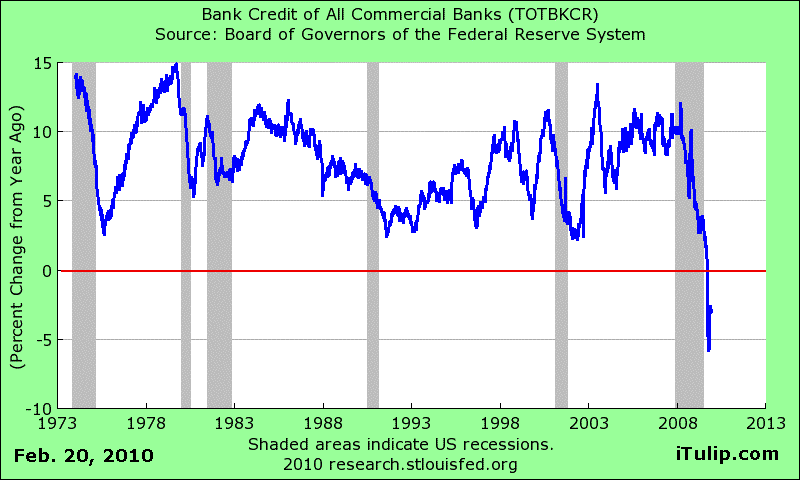
In Part II we look into our Economic Markers of housing, autos, unemployment, and inflation so that we can keep our bearings during the so-called recovery. Given those readings, and the debt data above, anyone who reads yesterday’s hike in the Primary Credit Rate as an indication of future Fed tightening is in for a nasty surprise.
Today, by sheer coincidence, the BLS announced a lower than expected CPI, signaling that the Fed will keep its promise to support the Treasury Department’s unstated weak dollar policy and continued commodity price inflation from high energy import prices.
After an initial knee-jerk reaction to the primary credit market rate hike news that sent stock futures down and the dollar up last night in Asian and European markets, market participants quickly came to their senses and deduced the Fed’s intentions. Gold market participants were not fooled even briefly. The gold price went up 1% on the news. With oil at $78, if anything we may have to abandon our hope of buying oil at $60, a price considered an indicator of an oil “bubble” as recently as 2006.
The Fed’s dilemma
Returning to our model of money and credit flows that allowed is to accurately forecast the absence of a deflation spiral following the private credit market crisis, the Fed wants to reduce the portion of credit and money flows that currently depend on government borrowing. By increasing the credit flows that originate from the private credit markets, the Fed hopes to see more money borrowed into existence by households and businesses, and by the banks themselves, to return the economy to normal. But with the securitization machine down for the count, and the prices of assets to back paper low and falling, how can this be made to happen? How can the Fed get the private credit markets operating as before, to lift debt levels seen back to debt boom times when securitization and asset-backed debt underpinned the lending boom?
The short answer is that they cannot, and no graph more clearly depicts the problem than the level of asset-backed commercial paper outstanding. It has declined from $1.2 billion to $400 billion since late 2007.
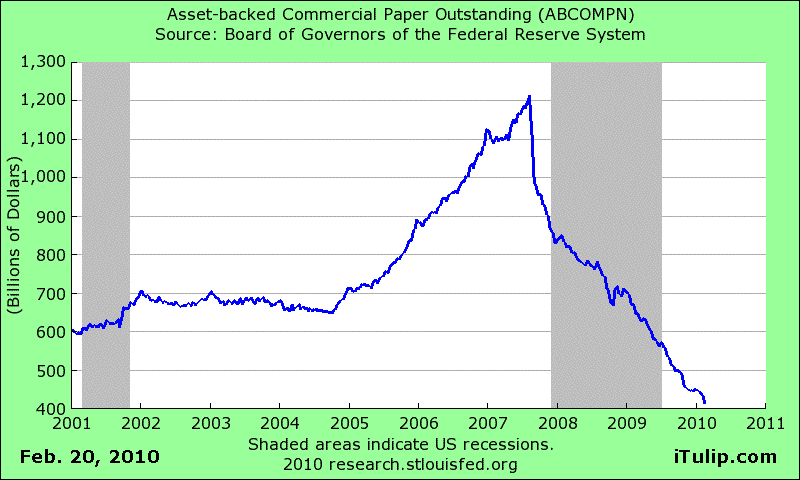
At some point over the next couple of years, and no later than 2013 after the U.S. presidential elections, the long-term need for so-called short-term “emergency” lending, of which the discount window is but a small part, will sink in. Around the same time, the “temporary” expedient of fiscal stimulus will begin to look permanent. As we have warned readers for years, this will spell rising inflation and taxes in the best case, with a potential for a major debt and currency crisis if the process does not go according to plan.
Studying such calamities as the 1906 San Francisco fire, one cannot but be impressed by how quickly the survivors were able to rebuild within five to ten years. Decades after the disasters, not a trace remains.
Studying such calamities as the 1906 San Francisco fire, one cannot but be impressed by how quickly the survivors were able to rebuild within five to ten years. Decades after the disasters, not a trace remains.
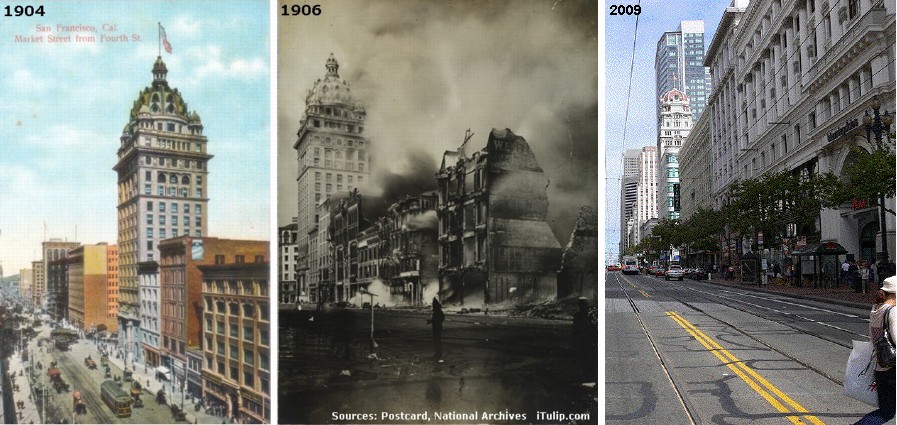
View up Market Street from 4th Street in 1903 before the earthquake, in 1906 after, and today.
If the damage to our economy had resulted from an earthquake or other physically devastating catastrophe rather than a financial and credit crisis the process of rebuilding would be straight forward, provided that the money, will, and institutions needed to rebuild survived and were well managed.
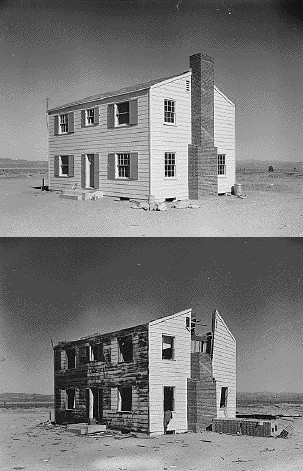
But we are faced with the opposite challenge. The physical world—the buildings and houses, industries, and some of the jobs—left over from the debt boom remain. These ever so slowly devolve as the debt left over from the boom, combined with the government policies intended to counter the short-term effects of private market debt deflation, such as the weak dollar, together act like radioactivity, slowly and invisibly changing the economy, and not for the better.
But we are faced with the opposite challenge. The physical world—the buildings and houses, industries, and some of the jobs—left over from the debt boom remain. These ever so slowly devolve as the debt left over from the boom, combined with the government policies intended to counter the short-term effects of private market debt deflation, such as the weak dollar, together act like radioactivity, slowly and invisibly changing the economy, and not for the better.

From a pamphlet created by the U.S. government in the 1940s to educate
the American public about the dangers of nuclear fallout
the American public about the dangers of nuclear fallout
The process--commodity price inflation combined with asset price deflation--is so devilishly gradual that we tend to adjust to it over time, and only by reviewing landmarks can we keep track of what is happening to us and our world as influenced by economic change.
Great Recession Fallout - Part II: Cars and Houses ($ubscription)
Remember when
Stagflation arrives
Purchasing power lost
Don’t be surprised by a VAT
One seemingly ancient yet only two year old fact about The Great Recession is that it started with a collapse of the housing bubble in mid 2006, as we noted at the time. It engenders a simple axiom: if no housing starts, then no housing recovery, and no economic recovery.
For a simple measure of growing consumer demand, of the strength of the recovery, nothing beats automobile sales. Are we selling more cars?
Then there's the unemployment data. They tell us how employers are feeling about the recovery.
Finally, we have data on commodity price inflation and personal income that tells us how well or badly the government’s cure for the debt deflation disease is working to create new ailments all its own. Here we go. more... ($ubscription)
(Photo credits: Photograph [Operation Cue]: A few minutes after detonation the atomic blast in Operation Cue looked like this, May 5, 1955. ARC Identifier: 541787, Photograph [Operation Cue]: Two-story wood frame house at 5,500 feet (from blast site), May 5, 1955. ARC Identifier: 541785. Photograph [Operation Cue] - Two-story wood frame house at 5,500 feet after the blast, May 5, 1955. ARC Identifier: 541788)
iTulip Select: The Investment Thesis for the Next Cycle™
__________________________________________________
To receive the iTulip Newsletter or iTulip Alerts, Join our FREE Email Mailing List
Copyright © iTulip, Inc. 1998 - 2010 All Rights Reserved
All information provided "as is" for informational purposes only, not intended for trading purposes or advice. Nothing appearing on this website should be considered a recommendation to buy or to sell any security or related financial instrument. iTulip, Inc. is not liable for any informational errors, incompleteness, or delays, or for any actions taken in reliance on information contained herein. Full Disclaimer
 |
Remember when
Stagflation arrives
Purchasing power lost
Don’t be surprised by a VAT
One seemingly ancient yet only two year old fact about The Great Recession is that it started with a collapse of the housing bubble in mid 2006, as we noted at the time. It engenders a simple axiom: if no housing starts, then no housing recovery, and no economic recovery.
For a simple measure of growing consumer demand, of the strength of the recovery, nothing beats automobile sales. Are we selling more cars?
Then there's the unemployment data. They tell us how employers are feeling about the recovery.
Finally, we have data on commodity price inflation and personal income that tells us how well or badly the government’s cure for the debt deflation disease is working to create new ailments all its own. Here we go. more... ($ubscription)
(Photo credits: Photograph [Operation Cue]: A few minutes after detonation the atomic blast in Operation Cue looked like this, May 5, 1955. ARC Identifier: 541787, Photograph [Operation Cue]: Two-story wood frame house at 5,500 feet (from blast site), May 5, 1955. ARC Identifier: 541785. Photograph [Operation Cue] - Two-story wood frame house at 5,500 feet after the blast, May 5, 1955. ARC Identifier: 541788)
iTulip Select: The Investment Thesis for the Next Cycle™
__________________________________________________
To receive the iTulip Newsletter or iTulip Alerts, Join our FREE Email Mailing List
Copyright © iTulip, Inc. 1998 - 2010 All Rights Reserved
All information provided "as is" for informational purposes only, not intended for trading purposes or advice. Nothing appearing on this website should be considered a recommendation to buy or to sell any security or related financial instrument. iTulip, Inc. is not liable for any informational errors, incompleteness, or delays, or for any actions taken in reliance on information contained herein. Full Disclaimer
 It will make you feel better.


Comment