 |
Credit crunch induced commodity, goods and services supply crash meets government money wave. Can the Fed and Congress stop what they started?
Part I: Snowball in Summer
• Liquidation fire sales ending
• Substitution and stealth inflation
• Deflation fighting policy turns dollar into third world money
• Ready for an epidemic of bank failures?
Part II: Snowball in Hell
• Debt Deflation Bear Market First Bounce Correction arrives
• Economy on or off the rails?
• Fiscal stimulus: Is it working?
We start today by recalling our advice to readers December 2008:
U.S. consumer swan song: Cheap now, cheaper later, then expensive—it’s all about supply
Early next year expect a Great American Consumer Fire Sale to follow on the heels of the Great American FIRE Economy Fire Sale of financial assets that began in 2006. While the FIRE Economy fire sale was in houses, stocks, and all bonds but U.S. Treasury bonds, with particularly heavy depreciation in securitized debt, The Consumer Economy Fire Sale starting in Q1 2009 will be familiar to anyone who lived through the 1980 to 1983 recessions when the Volcker Fed slammed the economy in a three years of contraction with rate hikes that created double digit unemployment and brought inflation down from over 12% to under 0% -- yes, resulting in a brief episode of actual deflation. Ask any old-timer coin dealer who survived it. Armageddon for them, nirvana for the FIRE Economy.
The major difference between the 1980 to 1983 recessions and the one that started in Q4 2007: the Fed created the 1980 to 1983 recessions on purpose. This one is running on its own, out of control, with no apparent obstructions – fresh sources of credit, cash, or income -- to brake the fall.
Many retailers, especially discount chains, have already cut prices to cost. Shopping with the wife at a nearby Mall this past weekend we spotted tumbleweeds rolling down the isles of full price, brand name retailers while discounters offered goods Made in China, Indonesia and other lands at absurdly low prices.
The shoppers marveled. They felt rich, no doubt, as they snapped up the well crafted goods using cash and credit earned at an exchange rate value they may not see again for many years, unaware of the ephemeral quality of the precious purchasing power they wield this holiday shopping season in the final act of a 35 year consumption fantasy financed by other peoples' savings.
The spectacle evoked images of ill fated vacationers picking fish up off the exposed sea floor at Bali resort beaches before the tsunami waters rolled back in to drown them, and the story of the young girl who happened to learn about tsunamis in school the week before and, recognizing the danger, talked her family into running for higher ground. I could not help thinking that a year from now many shoppers, blissfully unaware of the economic calamity that awaits them, will wish they’d understood the perversely low prices as a warning of economic trouble ahead and saved their money for later.
The holiday retailer strategy: those left with the least inventory after Christmas live to fight another day.
The first half of 2009 goes like this:
1. After Christmas sales: 20% to 50% off
2. Liquidation sales: 50% to 80% off
3. Then 30% to 40% of retailers go out of business
Advice to readers: take advantage of the early 2009 Great American Fire Sale and go out and buy all the generators, chain saws, washing machines, fine linens, cars, and other durable goods you’re going to need for the next few years because by the end of 2009 most of the inventory may be sold through, many retailers will be shut down, and replenishment of stocks of the survivors will likely be meager; our models say that the goods import supply will decline more precipitously than the supply of money available to pay for them. That spells severe stagflation.
How well has this forecast held up? Sadly, all too well. Early next year expect a Great American Consumer Fire Sale to follow on the heels of the Great American FIRE Economy Fire Sale of financial assets that began in 2006. While the FIRE Economy fire sale was in houses, stocks, and all bonds but U.S. Treasury bonds, with particularly heavy depreciation in securitized debt, The Consumer Economy Fire Sale starting in Q1 2009 will be familiar to anyone who lived through the 1980 to 1983 recessions when the Volcker Fed slammed the economy in a three years of contraction with rate hikes that created double digit unemployment and brought inflation down from over 12% to under 0% -- yes, resulting in a brief episode of actual deflation. Ask any old-timer coin dealer who survived it. Armageddon for them, nirvana for the FIRE Economy.
The major difference between the 1980 to 1983 recessions and the one that started in Q4 2007: the Fed created the 1980 to 1983 recessions on purpose. This one is running on its own, out of control, with no apparent obstructions – fresh sources of credit, cash, or income -- to brake the fall.
Many retailers, especially discount chains, have already cut prices to cost. Shopping with the wife at a nearby Mall this past weekend we spotted tumbleweeds rolling down the isles of full price, brand name retailers while discounters offered goods Made in China, Indonesia and other lands at absurdly low prices.
The shoppers marveled. They felt rich, no doubt, as they snapped up the well crafted goods using cash and credit earned at an exchange rate value they may not see again for many years, unaware of the ephemeral quality of the precious purchasing power they wield this holiday shopping season in the final act of a 35 year consumption fantasy financed by other peoples' savings.
The spectacle evoked images of ill fated vacationers picking fish up off the exposed sea floor at Bali resort beaches before the tsunami waters rolled back in to drown them, and the story of the young girl who happened to learn about tsunamis in school the week before and, recognizing the danger, talked her family into running for higher ground. I could not help thinking that a year from now many shoppers, blissfully unaware of the economic calamity that awaits them, will wish they’d understood the perversely low prices as a warning of economic trouble ahead and saved their money for later.
The holiday retailer strategy: those left with the least inventory after Christmas live to fight another day.
The first half of 2009 goes like this:
1. After Christmas sales: 20% to 50% off
2. Liquidation sales: 50% to 80% off
3. Then 30% to 40% of retailers go out of business
Advice to readers: take advantage of the early 2009 Great American Fire Sale and go out and buy all the generators, chain saws, washing machines, fine linens, cars, and other durable goods you’re going to need for the next few years because by the end of 2009 most of the inventory may be sold through, many retailers will be shut down, and replenishment of stocks of the survivors will likely be meager; our models say that the goods import supply will decline more precipitously than the supply of money available to pay for them. That spells severe stagflation.
Liquidation fire sales ending
AlixPartners LLP, a Michigan-based turnaround consulting firm, estimates that 25.8% of 182 large retailers it tracks are at significant risk of filing for bankruptcy or facing financial distress in 2009 or 2010. In the previous two years, the firm had estimated 4% to 7% of retailers then tracked were at a high risk for filing.
"We will have a lot fewer stores by the middle of 2009," says Nancy Koehn, professor of business administration at Harvard Business School. "It's happening very, very quickly because of the financial crisis and the recession." – Wall Street Journal, June 16, 2009
How does the supply crash look at the retail segment of the supply chain from ground level? "We will have a lot fewer stores by the middle of 2009," says Nancy Koehn, professor of business administration at Harvard Business School. "It's happening very, very quickly because of the financial crisis and the recession." – Wall Street Journal, June 16, 2009
Let’s take a tour of the area around iTulip central, around Boston, Massachusetts.
Target, Burlington, MA
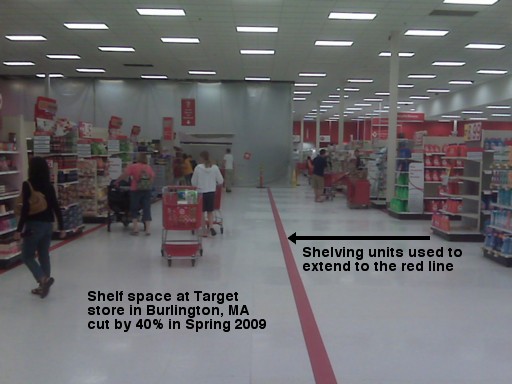
The inside of our local Target store in Burlington, Massachusetts looks like this. Shelf space has been cut by more about 40%. The isles are wide enough to drive through. The selection of goods is a fraction of what it was six months ago. The same is true of the Super 88 where we shop for Asian groceries. The space is half empty, and the items on the shelves no longer include expensive Japanese imports, only Chinese.

In 2006, at the height of the housing bubble, my wife and I shopped for furniture on Massachusetts Avenue in Cambridge. Six stores filled to overflowing with customers. Getting assistance from a salesperson was tough. Today only two original stores remain. One of those that went under is pictured above. A new store next door sells what I’d charitably call “student furnishings,” made of laminated particleboard and sold at astonishingly high prices. By the way, the platform bed is back.

This hideous Nixon era retro design chair made me wonder if the Cambridge, Massachusetts economy got its ass kicked back all the way to 1965. Not the price, however. The chair goes for $885.

The landmark Design Research building that housed Crate & Barrel for the past dozen years sits empty on prime real estate in the middle of Harvard Square.
Competing stores that sell similar items are charging prices that are noticeably higher than a year ago, and far higher than during the fire sale period from Christmas 2008 until the end of Q2 2009.
What’s happening?
In a normal recession, demand falls and unit sales decline. In a debt deflation, unit sales collapse. Like this.
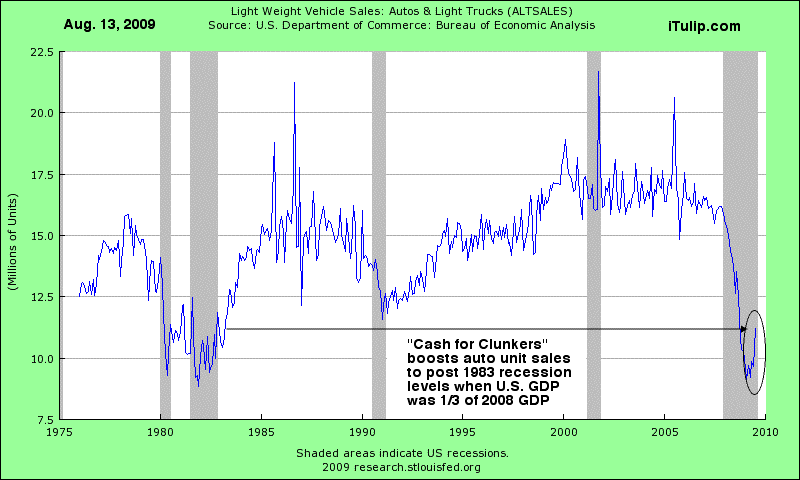
Unit sales of autos collapsed during the acute crisis phase of the FIRE Economy Depression from Q1 2008 to Q2 2009 as demand fell with the availability of consumer and business credit.
Even with the government offering a $2 billion taxpayer financed spiff program to customers of auto companies, unit sales remain close to where they were at the end of the 1980s recession when the economy was 1/3 as large as the economy was in 2008. Margins are abysmal. Ford’s are -5% and its competitors’ are likely no better, but who knows? They aren’t saying. They are “private,” you see, majority owned by the government.
Even with the government offering a $2 billion taxpayer financed spiff program to customers of auto companies, unit sales remain close to where they were at the end of the 1980s recession when the economy was 1/3 as large as the economy was in 2008. Margins are abysmal. Ford’s are -5% and its competitors’ are likely no better, but who knows? They aren’t saying. They are “private,” you see, majority owned by the government.
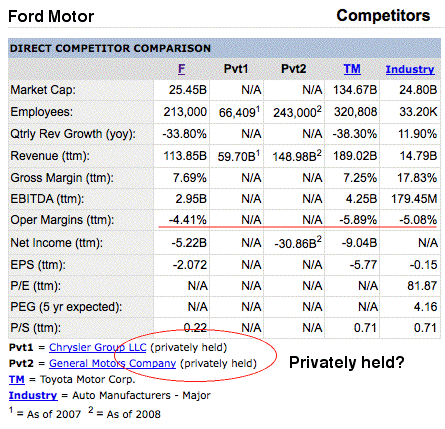
The government hopes to accomplish two goals with the Cash for Clunkers program. The first is to generate excise tax revenue that it derives from auto sales. These largely cancel out the cost of the Cash for Clunker program to the government. The second is to burn through inventory quickly to get new orders on the books so that auto companies will have to re-hire employees to make more cars.
Soon car lots will fill with lower end models that will sell at significantly higher prices than the low end inventory that is now being sold through.
What about politically unconnected industries?
The auto industry is a special case. What if you do not happen to run a company in an industry that employs millions of workers who vote as a block in every election? You can’t get a government spiff program to help you sell product. You need to return to cash flow positive, and fast, before you run out of money to make payroll, pay suppliers and bankers, and of course the tax man.
Here are the latest retail sales data from Friday.
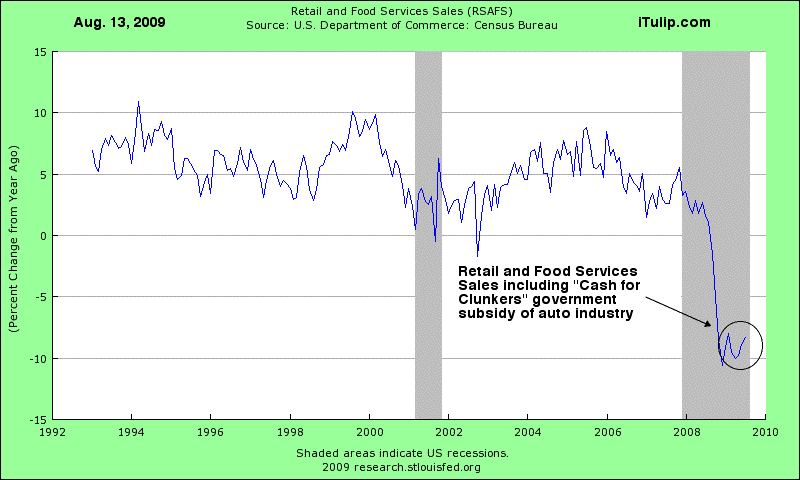
They show a modest year over year gain, reported as a sign of recovery. But here are the retail sales data minus the government supports of the auto industry.
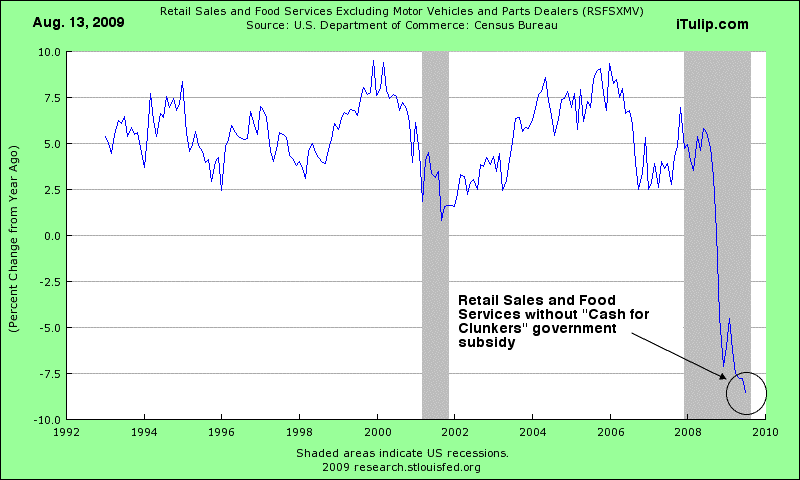
That's bad but then that’s the good news. Remember when we noted the slowing in the rate of decline in personal consumption expenditures in June 2009 in a follow-up to our March 2009 First Bounce of the Debt Deflation Bear Market analysis?
Here is our best-case scenario from June:
Here is our best-case scenario from June:
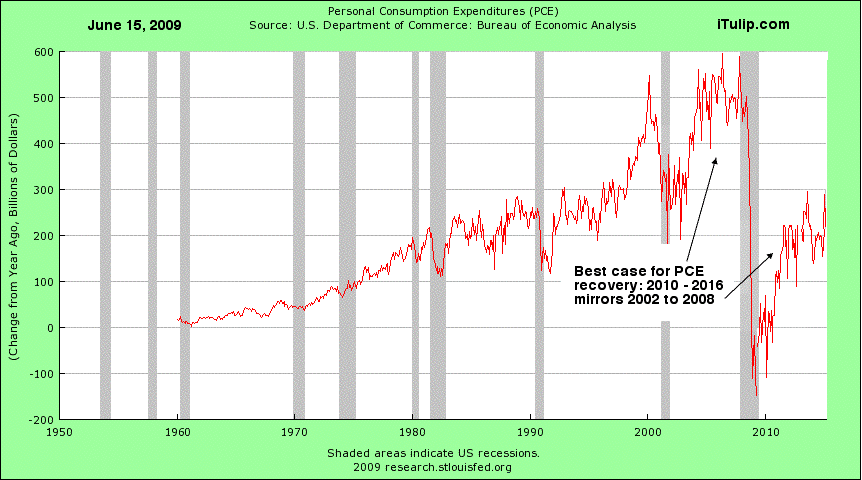
That assumes that PCE miraculously recovers as it did during the housing bubble after the technology bubble collapsed.
Here are Friday’s PCE data.
Here are Friday’s PCE data.
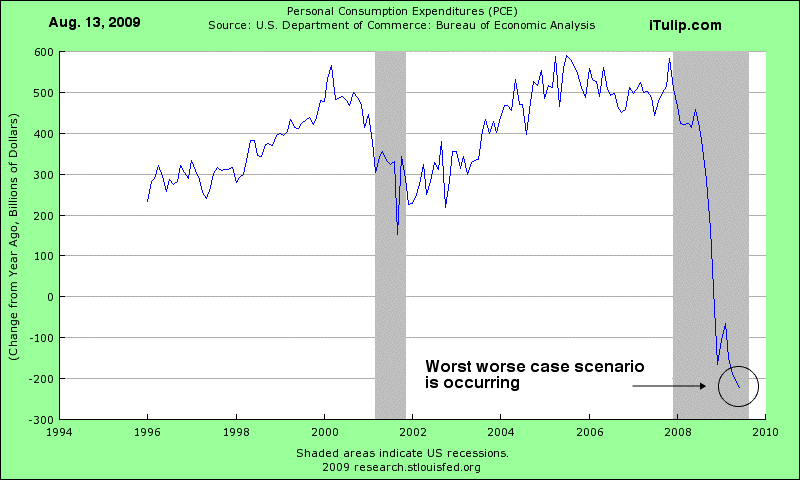
We fully expected PCE to bounce along a bottom created by government spending programs, not resume a decline. We didn’t even have a worst-case scenario that covers the decline that actually occurred since then.
Add our June 2009 PCE forecast to our long record of excessive optimism.
Why did PCE resume falling? In a word, jobs. The unemployment picture is bad and, again, defying even our most pessimistic projections, continues to worsen.
Add our June 2009 PCE forecast to our long record of excessive optimism.
Why did PCE resume falling? In a word, jobs. The unemployment picture is bad and, again, defying even our most pessimistic projections, continues to worsen.
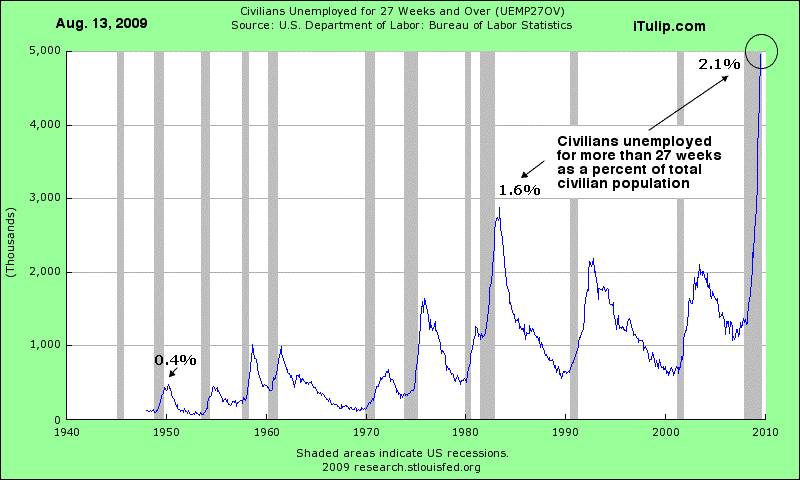
The number of members of the civilian labor force counted as officially unemployed for more than 27 weeks is over 18% of the total civilian population, exceeding the previous peak of 12.3% in 1983. Worse, the rate of growth shows no signs of slowing—the trend is still vertical.
We’re sick of fussing with U3, U6, and all the “alternative measures of unemployment" and we are sure the definitions will change again before this depression is over. For a solid measure of the health of the private sector, from now on we start with the official count of the total civilian labor force before the depression, and measure the portion of it that is no longer working.
Another factor hammering producers is consumer credit.
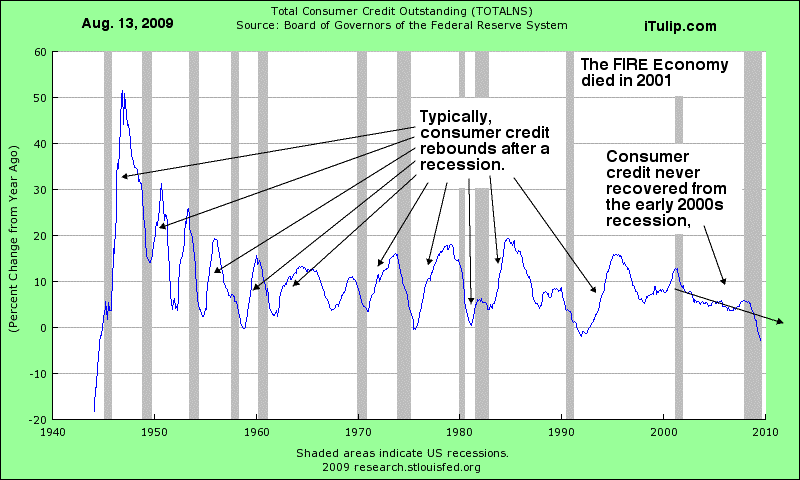
Everyone knows that the credit crunch that followed the collapse of the securitized debt market in 2007 brought down total consumer credit during the FIRE Economy Depression that started in Q4 2007. But rarely is it observed that after the recession of 2001, that followed the crash of the technology market bubble, consumer credit never recovered as it did after every other recession since WWII.
This is one of the reasons why we believe that the FIRE Economy ended with the 2007 collapse, that the current depression is a continuation of the massive recession that would have occurred in the early 2000s if not for the housing bubble. Of course, this depression is much worse than that one might have been because debt levels were so much higher going into this one than the previous one.
As good as it gets
By our estimates, and those of the increasingly unpopular Goldman Sachs, stimulus from Q4 2008 and Q1 2009 reaches peak effect in the current quarter. This is as good as it gets. But it's not good enough: there are more stimulus programs in our future. Count on it.
Back to the plight of the goods or services producer or retailer who doesn’t have a powerful lobby in Congress like the auto industry’s.
To save yourself from the effects of high unemployment and declining access to credit among your customers, you must reduce costs.
For almost all businesses, payroll is your largest expense, so first you lay off non-essential employees and cut salaries while reducing all spending that is not directly tied to revenues—travel, advertising, marketing, and so on.
Next you try to improve unit profit margins by eliminating the least profitable products from the price list, that is, those that sell in low volumes, require expensive labor to produce, and have high input costs.
If you run a restaurant you eliminate menu items that require pricey ingredients and expensive, highly trained chefs to prepare.
You offer items that can be prepared by minimum wage labor out of lower quality ingredients. You pile the cheap ingredients up on the plate. That way it appears to customers that you are “giving them more” when of course you are giving them less.
In this environment pizza sales boom but sushi is a bust.
Most retail landlords, rather than lowering rents so that higher priced, higher margin stores can stay in business, wait until these business fail before lowering the rent to accommodate a new low margin business that moves in to replace it. Not a very clever strategy, but there it is.
Look around you and you will notice that among high-end restaurant chains one will go out of business in one town while in the next town over virtually the same restaurant survives. One key difference is that the survivor has a landlord who understands that lowering the rent is the best possible accommodation in a weak economy for a retailer because it does not result in a lowering of product or service value to the customer.
Note to retail landlords: you can raise your rents again later, but if you keep rents high you will have to lower your rent for a new low margin business that will never be able to pay you higher rents later when unit volumes rise. Of course, if your mortgage is too high to allow you to lower the rent, you are in trouble. But you already knew that (see Time at last to short commercial real estate, June 2008).
If you run a retail chain store such as Target, you survive by eliminating high cost products that take up shelf space and don’t move when consumers don’t have jobs or have taken a pay cut, and don’t have access to credit, or both.
When I went to the Target store near my home recently, customers wandered the new wide isles, mumbling and confused. “Where is my favorite fill-in-the-blank,” was a common statement overheard.
Gone.
Substitution and the weak dollar: Welcome to the third world
This is not deflation. A three quarters full box of corn flakes sold for the same price today as a full box last year is not deflation. Fish and chips made with cheap versus premium cod and sold for the same price is not deflation. Getting packed like a sardine into a passenger jet that flies a given route half as often as before the depression started is not deflation. Getting a giant plate of rice or spaghetti sprinkled with vegetables and meat is not deflation.
Inflation is more than higher prices. It is also a lower quantity and quality of goods and services for the same price, and new fees and taxes (see Inflation in America - Part I: Five signs of inflation).
All major periods of inflation start with a supply crash, that is, a period when the supply of goods declines faster than demand.
If you are old enough to remember the OPEC oil embargo you know from first hand experience.
The oil import supply fell faster than demand. Result: rising oil prices that also pushed up the price of domestically produced oil. These costs diverted personal consumption expenditures away from other forms of consumption, leading to recession and rising unemployment. Meanwhile, cost-push inflation hammered asset prices.
Our supply crash theory from last year is that the Keynesians have the credit crunch story only half right. Yes, a sudden withdrawal of the purchasing power of household credit will cut demand, but a credit crash will cut goods and services supply even faster than demand because businesses are even more credit sensitive than consumers are. We expected many goods producers and wholesalers to go out of business, leaving the survivors with the pricing power they need to pass on higher costs to customers.
The other source of inflation is the depreciating dollar. With oil stubbornly over $60 even as oil demand falls--but not as fast as dollar demand falls--our 2007 forecast for reflation putting a floor on commodity prices forecast remains intact.
Starting this fall, inventory replenished by suppliers will be lower quality yet sold at the same price as last year’s higher quality goods or at higher prices than previously higher quality goods.
Inflation by currency deflation
To understand the process, say you are an American engineer visiting a third world country from the U.S. in 1999 when the dollar was still strong. The purchasing power of your income earned in the U.S. in dollars is higher than that of the engineer doing the same job working in the third world country you are visiting as a tourist.
Goods appear cheaper to you, purchased with dollars, than they do to your local counterpart because the purchases consume a smaller portion of your income. The engineer living in that third world country who has the same job as you earns income in the local currency—call it pesos. For the local engineer, the same purchases you made consume a larger portion of his peso income so he experiences he same goods as expensive that you think are cheap in dollars.
Since retailers largely cater to the local population that is spending pesos, versus the U.S. tourist spending dollars—except in tourist rip-off areas where prices are raised to take advantage of unaware visitors—the mix of goods available in the stores to be sold to locals are lower quality than those available in an equivalent store in the U.S. because the local population cannot afford to purchase higher quality goods.
Now think about what has happened at your local grocery and department store. Get it?
Now that the dollar has weakened, Americans can stay right here in the U.S. and experience the joys of earning a salary in a depreciated currency: low quality goods that consume an every greater portion of income.
It’s deflation alright, of the currency.
No free lunch
Diminishing product quality and choice is stealth inflation. Like a frog in slowly heated water, stealth inflation cooks your purchasing power so slowly that you hardly notice it.
Next thing you know, you’re poor.
Yes, the Fed rescued us from a deflation spiral but in the process is turning the U.S. into a third world country. Look around you.
No wonder the food stamp participation is up to an all time high of 11% of the population.
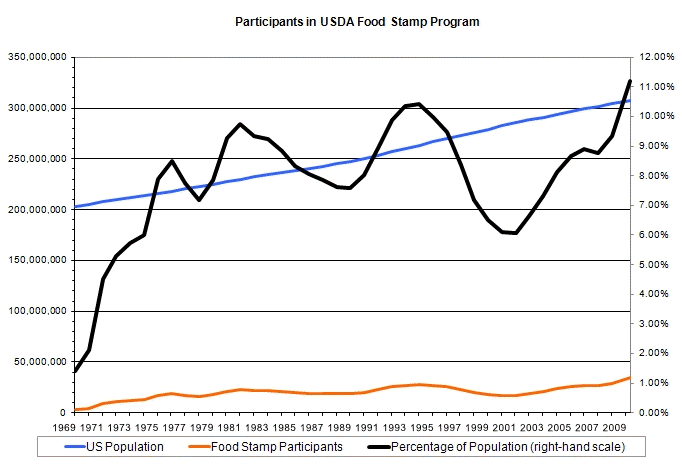
Consumer credit isn’t the only economic measure that never recovered
from the 2001 recession (Hat tip to iTulip member Zoog)
Meanwhile, we continue to hear forecasts of deflation and deflation spirals. It’s surreal.
Inflation is here, but don’t hold your breath waiting for your government to announce it
In fact, you can count on the opposite. As long as unemployment remains high, the Fed desperately wants to maintain low interest rates. To wit, the latest CPI report from the Department of Labored Statistics.
Inflation is here, but don’t hold your breath waiting for your government to announce it
In fact, you can count on the opposite. As long as unemployment remains high, the Fed desperately wants to maintain low interest rates. To wit, the latest CPI report from the Department of Labored Statistics.
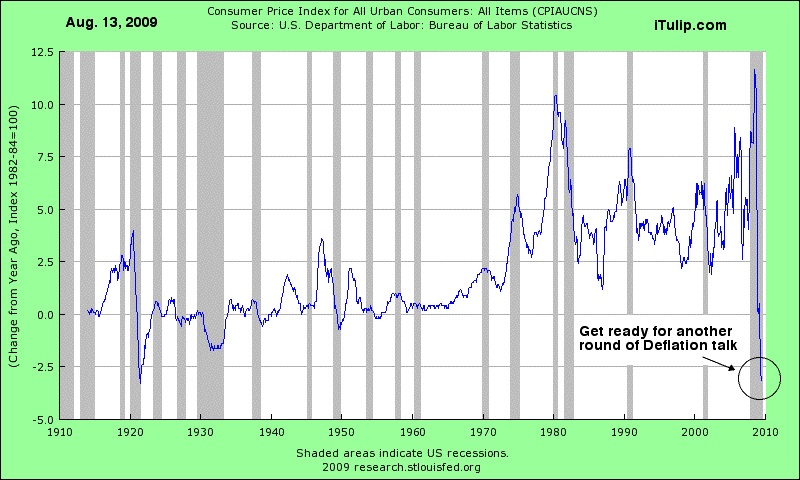
The chart above looks convincingly like deflation, doesn’t it? It shows the percent change in the CPI year over year off more than 2.5%. However, readers will recall that CPI inflation, driven by high energy prices that later spilled over into commodity prices, later into intermediate goods prices, and so on, peaked about a year ago, around the time a gallon of gasoline sold for $3.80 versus $2.60 today, and oil sold for $135. A mere 14 months ago. The year-over-year change from those peaks, of course, appears extreme.
As explained in Deflation fare thee well – Part I: In search of real returns in an unreal world, the four-month period of disinflation we expected ended March 2009 when the dollar stopped rising and commodity prices stopped falling.
As explained in Deflation fare thee well – Part I: In search of real returns in an unreal world, the four-month period of disinflation we expected ended March 2009 when the dollar stopped rising and commodity prices stopped falling.
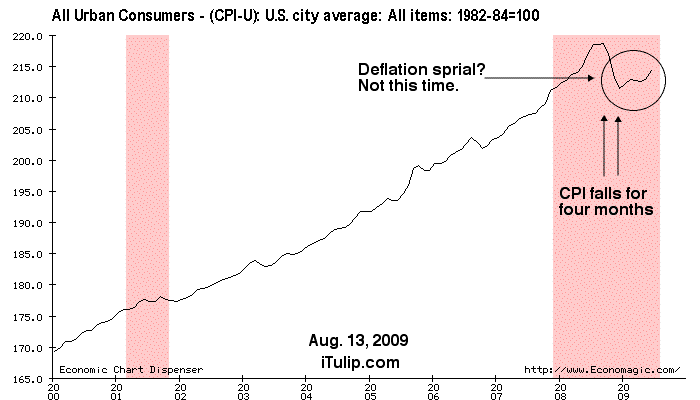
The U.S. experienced a short bout of deflation we call disinflation before
the long-term inflation trend resumed
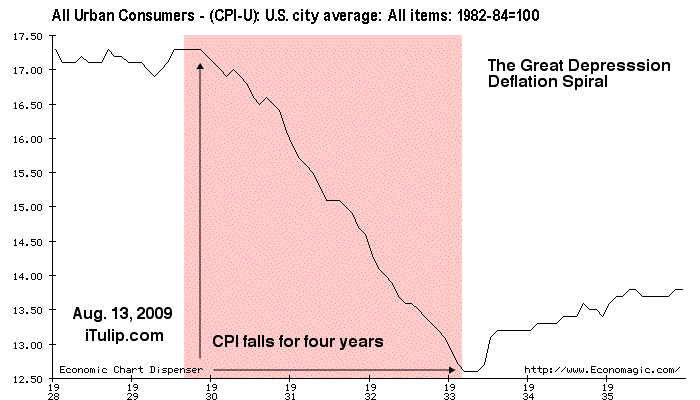
This is what a deflation spiral looks like, from 1930 to 1934
Doesn’t take a rocket scientist to see the difference between 48 continuous months of CPI decline and four months of CPI decline.
Here is a chart of every other deflation spiral that has occurred throughout history.
Here is a chart of every other deflation spiral that has occurred throughout history.
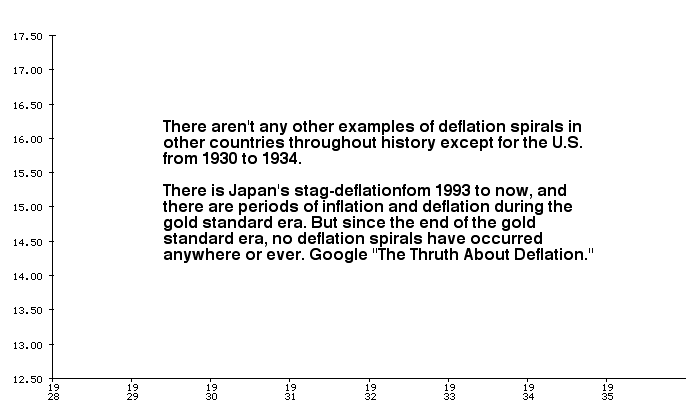
There aren’t any, or at least in over ten years of research we have never located one. The reason? Of all of the nations of the world, only the U.S., and for a brief period Germany, remained on the gold standard during the period and inflated its currency against gold. We find it curious that even a few analysts remain in the forecasting game who are ready to risk their reputations on a prediction of a recurrence of an event that has only happened once in one country over 60 years ago and under unique circumstances. The opposite result—inflation—followed from similar indebtedness antecedents dozens of times in dozens of countries throughout the world over the past 100 years, as variations on a theme of currency depreciation and debt default.
The underlying process is similar but the government’s response and tools were completely different in 2008 than in 1930. For one thing, in the 1930s deflation spiral case a third of all banks went out of businesses and depositors lost their money. There was no FDIC to bail them out. In the current crisis less than 5% of banks have failed and not one depositor lost one dollar. Speaking of bank failures...
Ready for an epidemic of bank failures?
Even if, as we expect, another 900 or so banks fail over the next two or three years, the Treasury Department can move hundreds of billions to the FDIC. The FDIC is, for all practical purposes, an account of the Treasury Department.
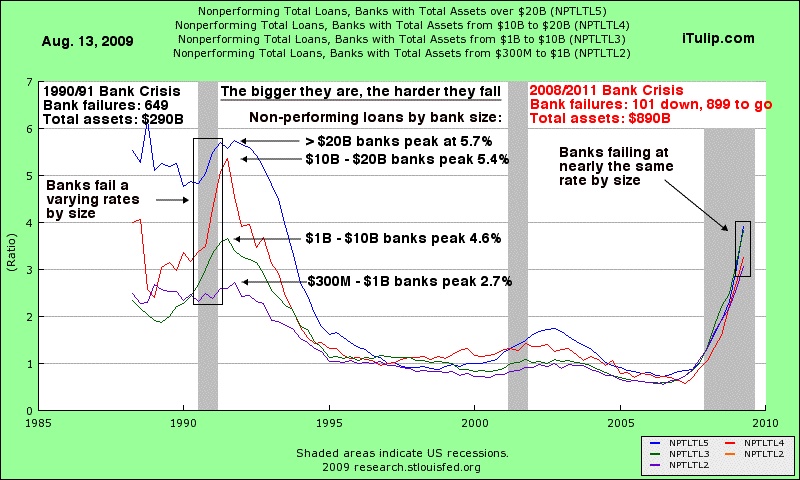
Catch the Wave: Nonperforming loans are rising at alarming rates for all sizes of bank, large and small
Comparing the 1990/1991 banking crisis to the one that is developing:
If the Fed can take trillions of bad debts off of the balance sheets of gigantic banks and insurance companies and move them to its own balance sheet, the Treasury Dept. can cover the insurance liabilities of few hundred billion dollar for smaller banks, too.
1990/1991 Banking Crisis
1) Non-performing loans diverged by size of bank, with the biggest banks had the largest problems
2) As the crisis deepened, the four bank classifications by size experienced non-performing loans in a wide distribution from 2.7% to 5.7%
3) The rate of increase in nonperforming loans ranged from slow for smaller banks to rapid for medium sized banks
2008/2011 Banking Crisis
1) Non-performing loans do not diverge by size of bank as banks are experiencing a rapid rise in non-performing loans
2) The four bank classifications by size experienced non-performing loans in a narrow distribution clustered between 3% to 3.9% as of Q1 2009, and rising rapidly together
3) The rate of increase in nonperforming loans for all banks regardless of size is deteriorating through the depression in near lock step
What is apparent to even the most naive observer is that the management of all of these banks, regardless of size, all did the same stupid things together, such as backing retail commercial real estate loans during a consumer credit bubble when retail floor space increased at five times the population growth rate. What could possibly go wrong? Now they are all going down together.
Some day banks will have to figure out how to compete with each other for profits and customers at the top of a credit cycle without following one another into a hell of bad loans from which they can only later escape with tax payer money.
We estimate banks will continue to fail through the end of 2011, that more than 1,000 will fail representing a total asset loss of $900B, based on RBS estimates, information from contacts at the FDIC, and our own calculations.
This does not mean that the FDIC goes bankrupt and we sit at the precipice of another 1930s period of bank runs. If you want to know the future of the U.S. banking crisis, read this. 1) Non-performing loans diverged by size of bank, with the biggest banks had the largest problems
2) As the crisis deepened, the four bank classifications by size experienced non-performing loans in a wide distribution from 2.7% to 5.7%
3) The rate of increase in nonperforming loans ranged from slow for smaller banks to rapid for medium sized banks
2008/2011 Banking Crisis
1) Non-performing loans do not diverge by size of bank as banks are experiencing a rapid rise in non-performing loans
2) The four bank classifications by size experienced non-performing loans in a narrow distribution clustered between 3% to 3.9% as of Q1 2009, and rising rapidly together
3) The rate of increase in nonperforming loans for all banks regardless of size is deteriorating through the depression in near lock step
What is apparent to even the most naive observer is that the management of all of these banks, regardless of size, all did the same stupid things together, such as backing retail commercial real estate loans during a consumer credit bubble when retail floor space increased at five times the population growth rate. What could possibly go wrong? Now they are all going down together.
Some day banks will have to figure out how to compete with each other for profits and customers at the top of a credit cycle without following one another into a hell of bad loans from which they can only later escape with tax payer money.
We estimate banks will continue to fail through the end of 2011, that more than 1,000 will fail representing a total asset loss of $900B, based on RBS estimates, information from contacts at the FDIC, and our own calculations.
If the Fed can take trillions of bad debts off of the balance sheets of gigantic banks and insurance companies and move them to its own balance sheet, the Treasury Dept. can cover the insurance liabilities of few hundred billion dollar for smaller banks, too.
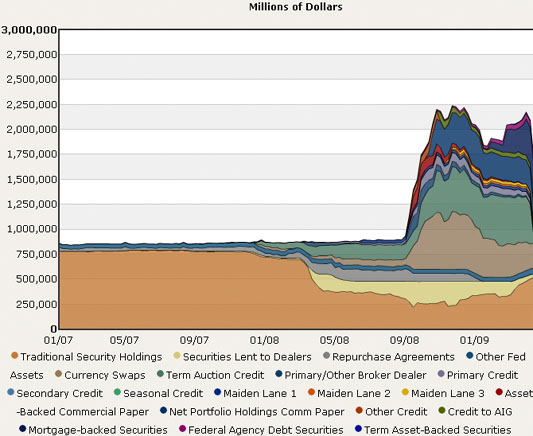
If the Fed can through the miracle of double entry bookkeeping add $1 triilion
worth of asset backed securities and other crap to its balance sheet,
why can't it add another $1 trillion in insured bank deposits?
The deflationsts told us many years ago that the chart above was impossible. No way, no how is the Fed going to buy all that junk. Yet no matter how many times events prove them wrong, they keep on keeping at it.
The latest gambit: falling velocity of money and a declining money supply. This is supposed to prove the deflation spiral case. Here I argue otherwise.
No deflation spiral, nor will the U.S. experience a Japan style stag-deflation. For that a nation needs to be a net capital exporter.
Net capital exporters have to cope with the tendency of the exchange rate value of the currency to rise due to foreign exchange accumulation. Still, things have not been so bad for the average Japanese. Wages are up and inflation is down, the exact opposite of what has occurred in the U.S. over the past ten years.
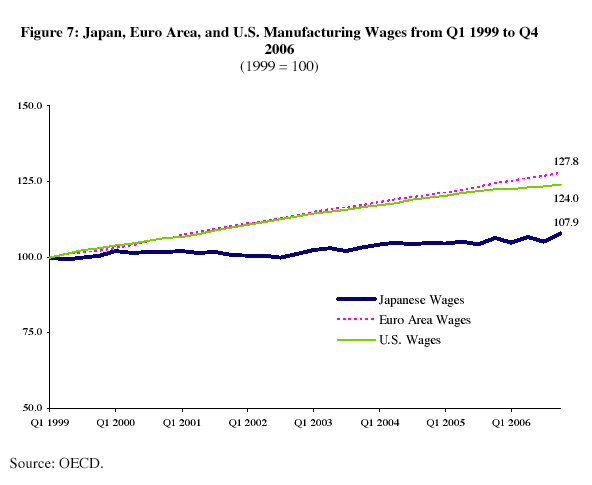
Japan since 1999: Wages up
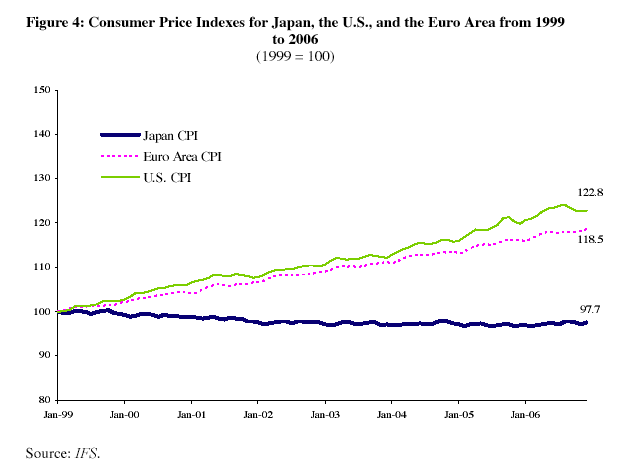
Japan: Inflation down
The U.S. is a net capital importer and has the opposite problem, mitigated only by the fact that the U.S. dollar is a reserve currency, which produces an artificial global demand for dollars. The dollar devalues as a natural consequence of the process of a reduction in the demand for the dollar that happens during economic recessions when U.S. consumers buy fewer imports and foreign capital inflows fall.
Let's not forget, the whole argument for why a trade deficit is "good for America" is that foreign capital then flows into the U.S. where it creates new jobs that are better than the making toys and clothes jobs that were exported.
Let's not forget, the whole argument for why a trade deficit is "good for America" is that foreign capital then flows into the U.S. where it creates new jobs that are better than the making toys and clothes jobs that were exported.
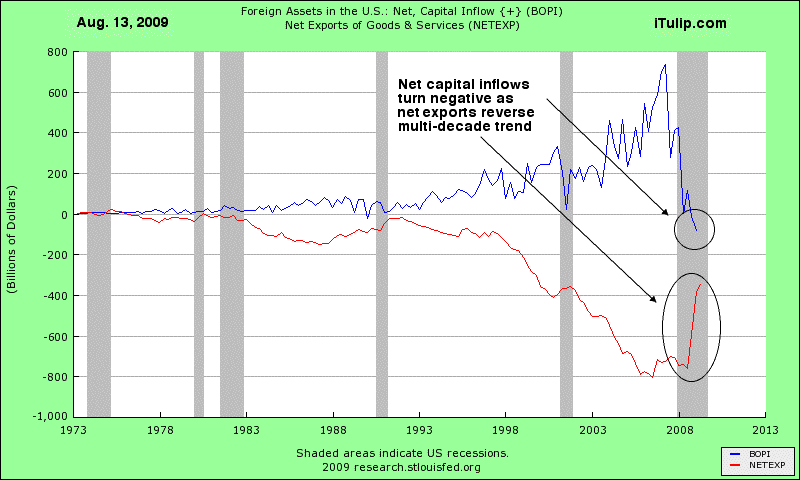
Vendor financing deal is off: No net goods and services imports, no capital exports,
no capital export financed jobs
Now that the U.S. is not importing as much, where will the foreign direct investment come from to generate jobs in the U.S. to fuel the recovery?
I recommend to deflationists that they focus their minds on one fact: governments cannot print purchasing power.
The current administration’s economic advisers do not appear to understand what is happening.
They are too busy fighting the last war.
They believe we are dodging a second Great Depression by avoiding the mistakes of central bankers in the 1930s.
They are “stimulating demand” with loose monetary policy and fiscal stimulus spending.
They believe that they can then “withdraw liquidity” at the first sign of inflation, and create a perfect balance between falling unemployment and rising inflation.
The theories behind these policies are fiction.
They do not understand that they are creating structural incentives for producers to offer lower quality goods and services at higher prices to consumers, and that this inflationary domestic structural change is combining with two trade-related global structural changes: high energy import costs due to Peak Cheap Oil and rising goods and services import costs due to a switch from imported to domestically produced goods as the dollar weakens and the U.S. loses its ability to finance trade deficits.
Anti-deflation economic policy has unleashed inflationary processes that were in the wings anyway. They cannot be contained.
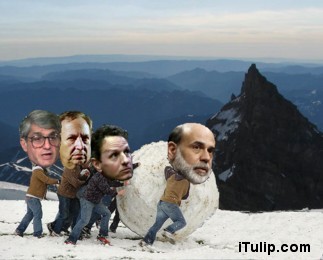
They have built a snowball of inflation and sent it down the mountainside.
If you live in the U.S. and remaining stores start to take on a third world look in your area, now you know why. Actually, you knew why back in December 2008 when we warned you. If you didn’t take our advice from last year and buy up all the cheap durable goods you may need for the next ten years, your window of opportunity is closing fast. You will not see cars and other durable goods this cheap, as measured in the purchasing power of your savings and income, for a very long time. Need some work done on your house? Better hurry.
August 2009 FIRE Economy Depression update – Part II: Snowball in Hell
Debt Deflation Bear Market First Bounce Correction arrives
Economy on or off the rails?
Fiscal stimulus: Is it working?
Since December 2008 we expected the stock market to bounce in response to fiscal stimulus spending. We missed the second leg down in Q1 2009 then noted the start of a First Bounce on March 27, comparing it to the first bounce in the Nikkei in 1993 also driven by government money.
Never keen to try to catch the very top or bottom in any bubble or government driven market--and perhaps the distinction is precious--on June 17 after the S&P had risen 28% off March panic lows, we said the First Bounce was over. The S&P went up another 6% after that before rolling over.
To time the Debt Deflation Bear Market, we keep an eye on both the results and the costs of re-inflation efforts. The direct cost of re-inflation is public debt. The indirect cost is a weaker dollar. The results can be seen in the impact on demand as measured in rail traffic, the longest running statistical measure of economic activity available that is not managed by government statisticians. more... $ubscription
iTulip Select: The Investment Thesis for the Next Cycle™
__________________________________________________
To receive the iTulip Newsletter or iTulip Alerts, Join our FREE Email Mailing List
Copyright © iTulip, Inc. 1998 - 2007 All Rights Reserved
All information provided "as is" for informational purposes only, not intended for trading purposes or advice. Nothing appearing on this website should be considered a recommendation to buy or to sell any security or related financial instrument. iTulip, Inc. is not liable for any informational errors, incompleteness, or delays, or for any actions taken in reliance on information contained herein. Full Disclaimer
I recommend to deflationists that they focus their minds on one fact: governments cannot print purchasing power.
iTulip Forecast: The U.S. will experience stagflation as the economy drifts in and out of periods of moderate to high inflation while unemployment remains high. The sources of inflation are: 1) high import costs, with energy costs exerting the greatest upward force on the prices of goods, 2) reduced quantity of goods and services, 3) industrial concentration. The challenge for investors and consumers alike will be managing through inflation volatility, high unemployment, and political uncertainly, a new problem for the U.S. that will weigh on the dollar even more than the Fed's and Federal Government's balance sheet. As the U.S. fiscal and external debt position grows increasingly precarious, the U.S. remains vulnerable to a sudden stop event.
ConclusionThe current administration’s economic advisers do not appear to understand what is happening.
They are too busy fighting the last war.
They believe we are dodging a second Great Depression by avoiding the mistakes of central bankers in the 1930s.
They are “stimulating demand” with loose monetary policy and fiscal stimulus spending.
They believe that they can then “withdraw liquidity” at the first sign of inflation, and create a perfect balance between falling unemployment and rising inflation.
The theories behind these policies are fiction.
They do not understand that they are creating structural incentives for producers to offer lower quality goods and services at higher prices to consumers, and that this inflationary domestic structural change is combining with two trade-related global structural changes: high energy import costs due to Peak Cheap Oil and rising goods and services import costs due to a switch from imported to domestically produced goods as the dollar weakens and the U.S. loses its ability to finance trade deficits.
Anti-deflation economic policy has unleashed inflationary processes that were in the wings anyway. They cannot be contained.
They have built a snowball of inflation and sent it down the mountainside.
If you live in the U.S. and remaining stores start to take on a third world look in your area, now you know why. Actually, you knew why back in December 2008 when we warned you. If you didn’t take our advice from last year and buy up all the cheap durable goods you may need for the next ten years, your window of opportunity is closing fast. You will not see cars and other durable goods this cheap, as measured in the purchasing power of your savings and income, for a very long time. Need some work done on your house? Better hurry.
 |
Debt Deflation Bear Market First Bounce Correction arrives
Economy on or off the rails?
Fiscal stimulus: Is it working?
Since December 2008 we expected the stock market to bounce in response to fiscal stimulus spending. We missed the second leg down in Q1 2009 then noted the start of a First Bounce on March 27, comparing it to the first bounce in the Nikkei in 1993 also driven by government money.
Never keen to try to catch the very top or bottom in any bubble or government driven market--and perhaps the distinction is precious--on June 17 after the S&P had risen 28% off March panic lows, we said the First Bounce was over. The S&P went up another 6% after that before rolling over.
To time the Debt Deflation Bear Market, we keep an eye on both the results and the costs of re-inflation efforts. The direct cost of re-inflation is public debt. The indirect cost is a weaker dollar. The results can be seen in the impact on demand as measured in rail traffic, the longest running statistical measure of economic activity available that is not managed by government statisticians. more... $ubscription
iTulip Select: The Investment Thesis for the Next Cycle™
__________________________________________________
To receive the iTulip Newsletter or iTulip Alerts, Join our FREE Email Mailing List
Copyright © iTulip, Inc. 1998 - 2007 All Rights Reserved
All information provided "as is" for informational purposes only, not intended for trading purposes or advice. Nothing appearing on this website should be considered a recommendation to buy or to sell any security or related financial instrument. iTulip, Inc. is not liable for any informational errors, incompleteness, or delays, or for any actions taken in reliance on information contained herein. Full Disclaimer


Comment